Fishbowl AI Insights Tier 2#
Fishbowl AI Insights Tier 2 is a comprehensive, AI supply chain optimization solution designed for organizations seeking advanced automation and prescriptive insights. Building on the predictive capabilities of Tier 1, Tier 2 introduces AI recommendations for purchasing and production, write-back functionality to Fishbowl Inventory, and expanded analytics. Powered by the ConverSight platform, this tier enables fully data-driven decision-making and process automation, transforming supply chain operations from proactive to prescriptive.
Feature Overview – Tier 2#
Tier 2 includes all features from Tiers 0 and 1, which serve as its foundation. These core components are:
Feature |
Description |
|---|---|
Unlimited Custom Reports & Dashboards |
A web-based, drag-and-drop interface for business users to create ad-hoc reports and dashboards without requiring SQL or coding skills. |
Pre-built Dashboards |
12 out-of-the-box dashboards providing immediate visibility into key operational metrics. |
Users |
Supports up to 10 users, enabling collaborative access across business teams. |
Insights |
25 Automated Insights that are predefined. |
Athena |
An AI chatbot for conversational analytics, allowing users to ask questions and get answers from their data in natural language. |
Native Fishbowl Integration |
A pre-configured, secure integration for seamless data extraction and synchronization from Fishbowl Inventory. |
Data Refresh |
Scheduled data pipeline execution to update the analytics platform with fresh data. |
Pre-configured Storyboards#
Tier 1 includes 8 pre-configured storyboards, which are curated narrative views that combine data, visualizations, and insights tailored to specific operational areas. The storyboards for this tier are:
1. Revenue Summary
Evaluate revenue trends across different periods and identify the products and customers that impact your business. This Storyboard offers a detailed view of your revenue performance to aid in strategic decision-making and optimization.
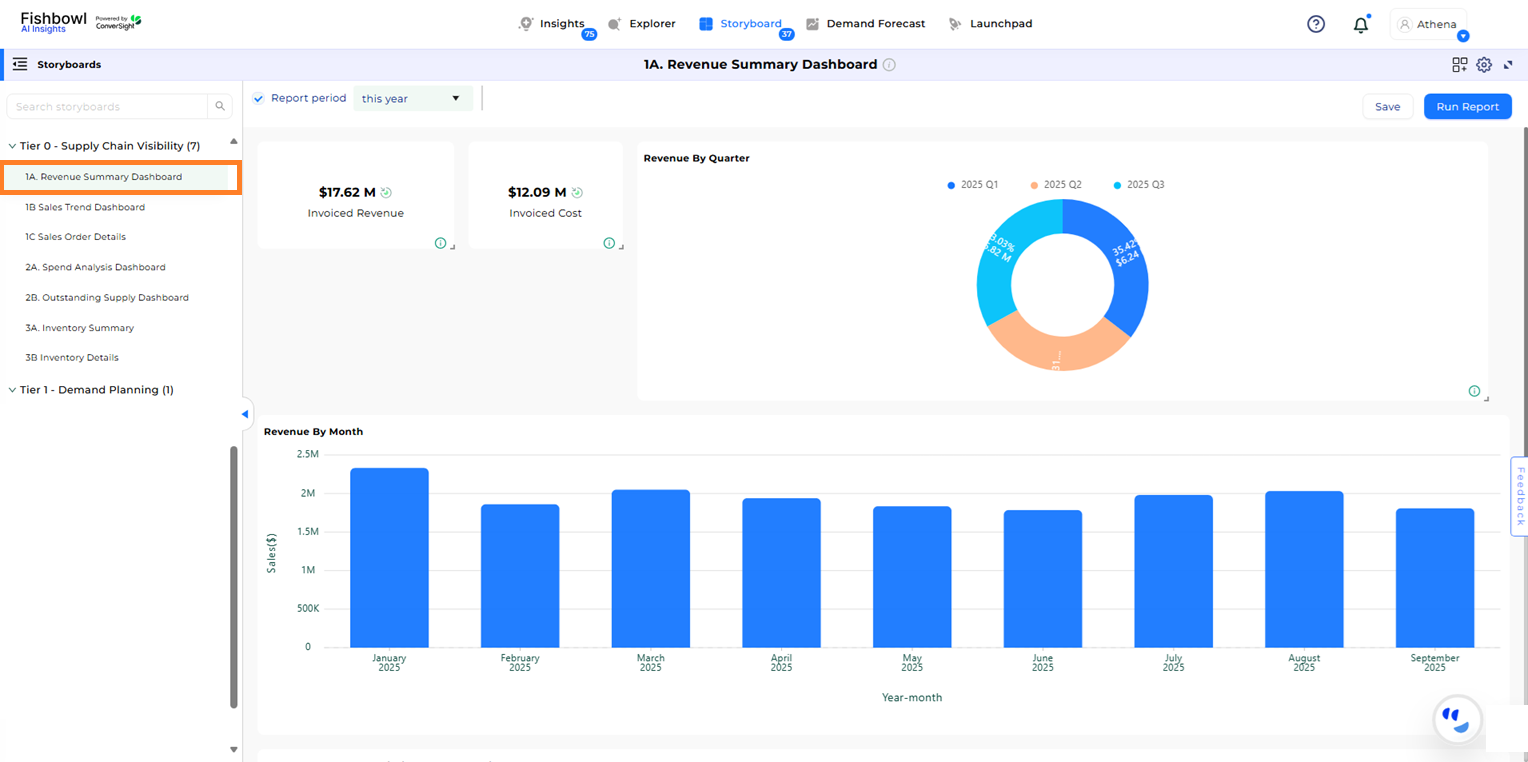
Revenue Summary Dashboard#
2. Sales Trend
Track and analyze sales performance to detect key trends and opportunities for improvement. Review sales data by quarter and month over several years to understand the impact of different customers and products on sales growth.
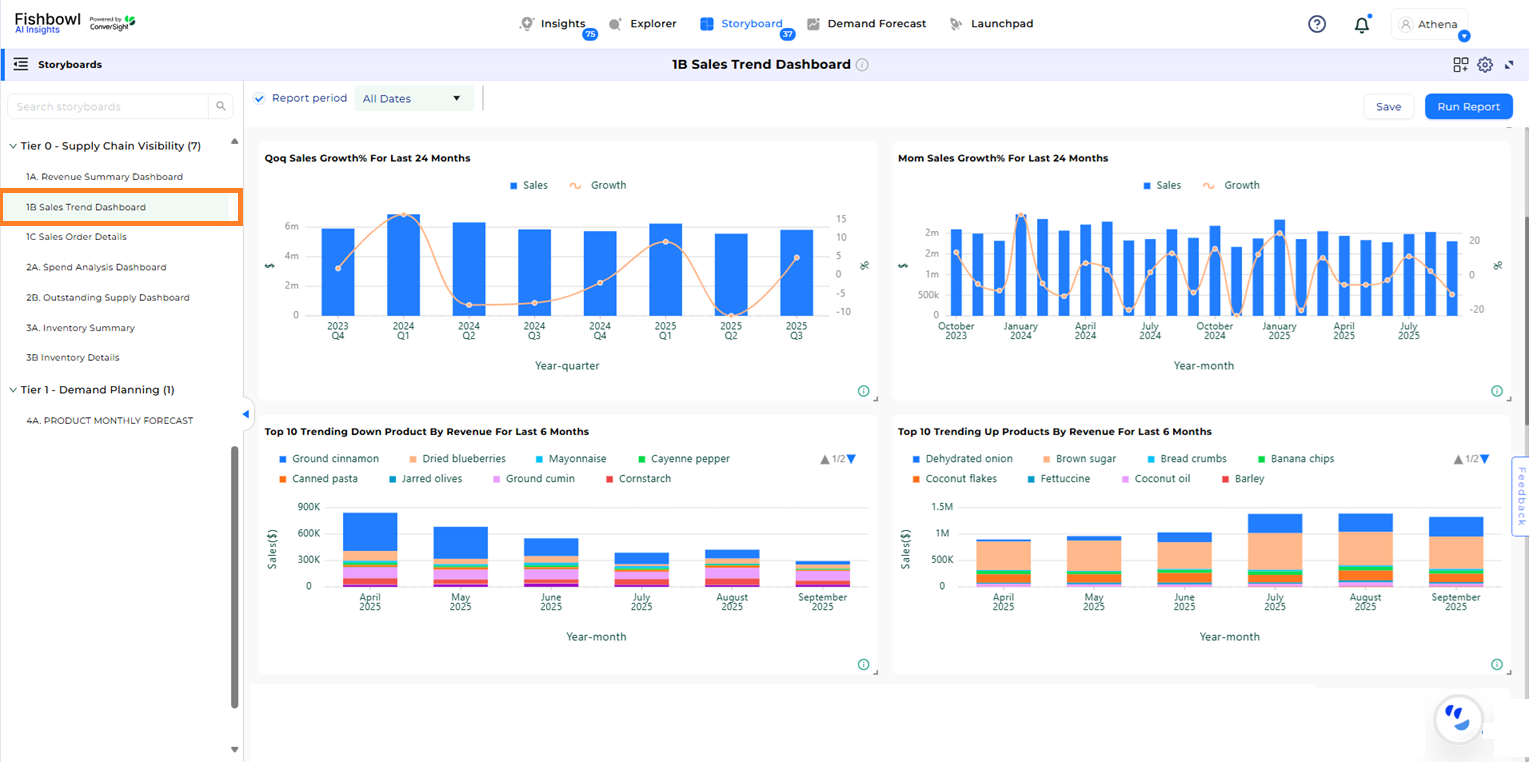
Sales Trend Dashboard#
3. Sales Order Detail
Gain comprehensive visibility into outstanding sales orders, including details such as order status, quantity, fulfillment progress and associated cost metrics. This Storyboard helps manage and prioritize sales orders effectively.
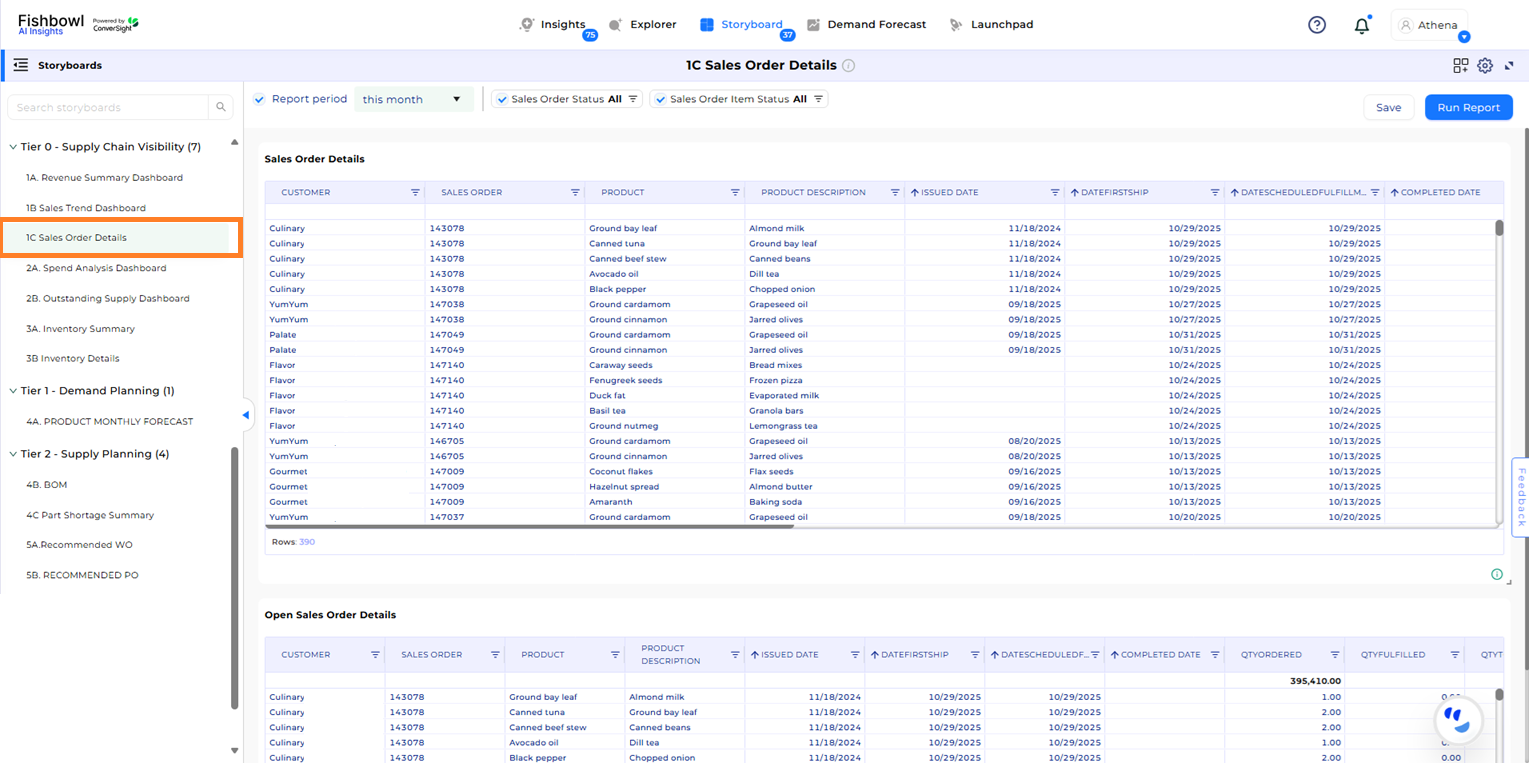
Sales Order Detail Dashboard#
4. Spend Analysis
Manage your budget and make informed decisions with insights into your spending patterns. This Storyboard tracks expenses by month and week, providing detailed views on vendors and products driving your expenditures.
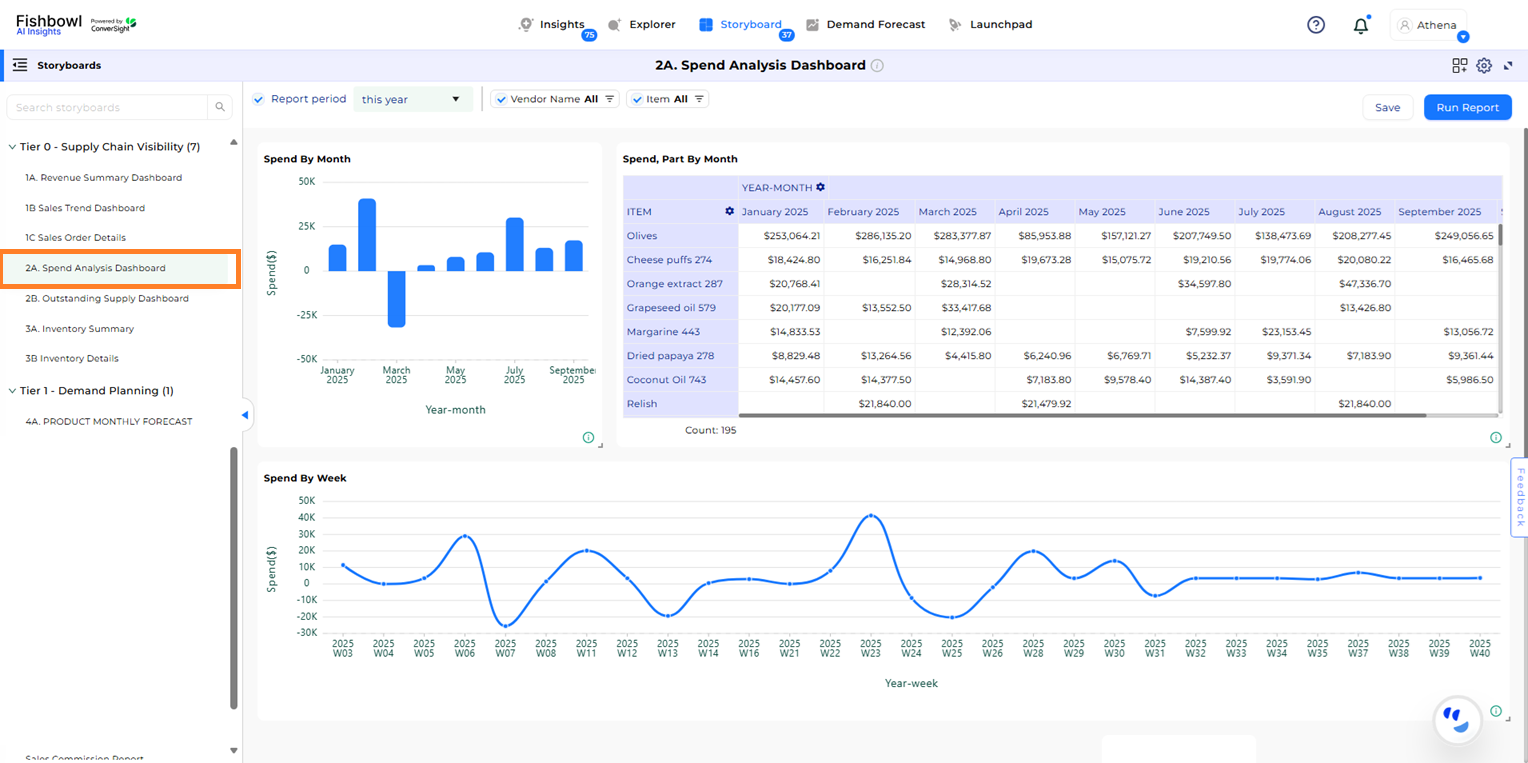
Spend Analysis Dashboard#
5. Outstanding Supply
Achieve a streamlined and effective supply chain with our proactive supply management Storyboard. Track open and overdue purchase orders to optimize your inbound operations and address potential shortages. The Outstanding Supply Dashboard enables users to pinpoint at-risk supplies and work closely with suppliers to resolve gaps in your inventory.
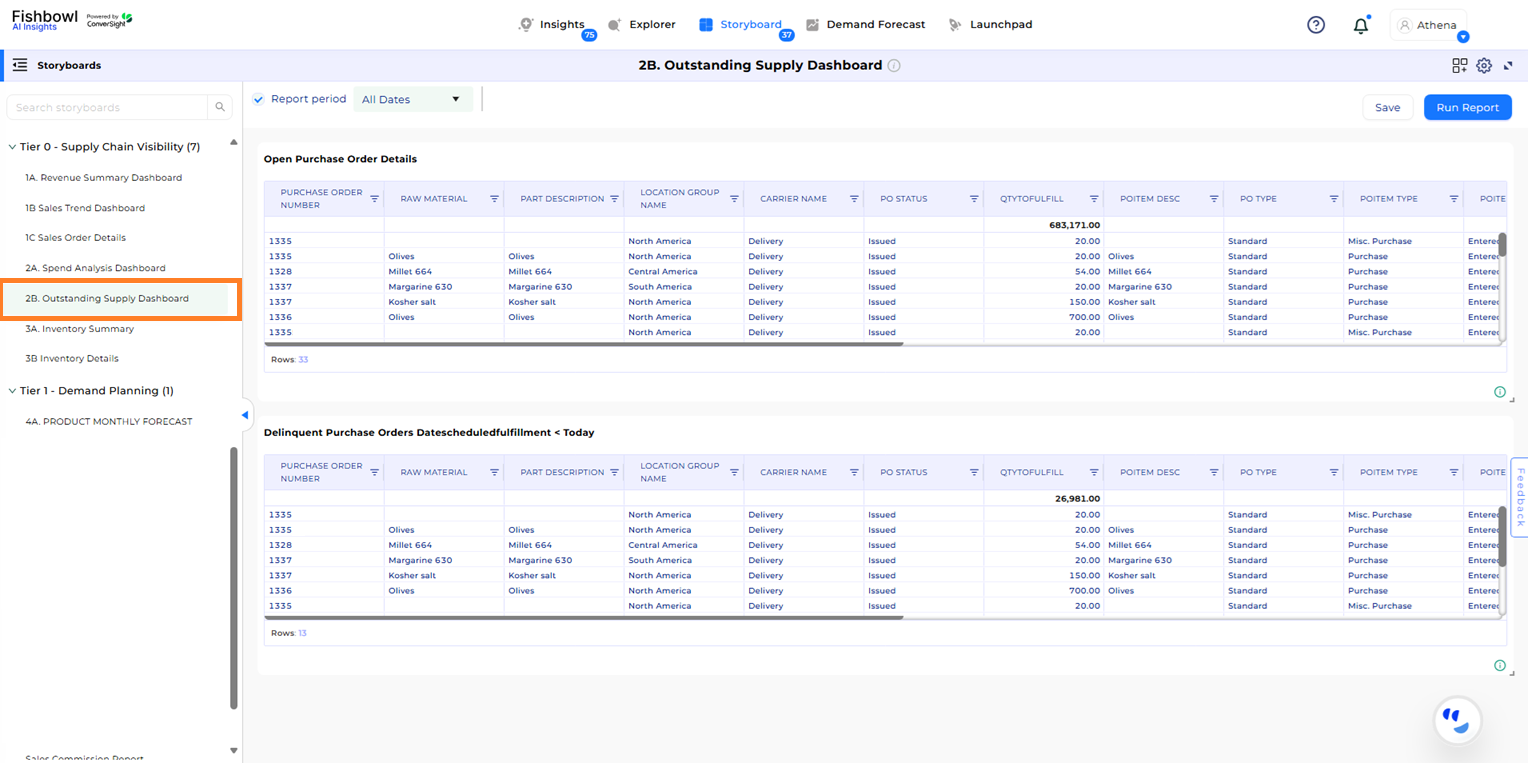
Outstanding Supply Dashboard#
6. Inventory Summary
Gain a broad overview of your product inventory, including areas where stock may be excessive. The Inventory Summary Dashboard offers a detailed view of your stock levels, enabling you to identify and rectify any imbalances in your inventory.
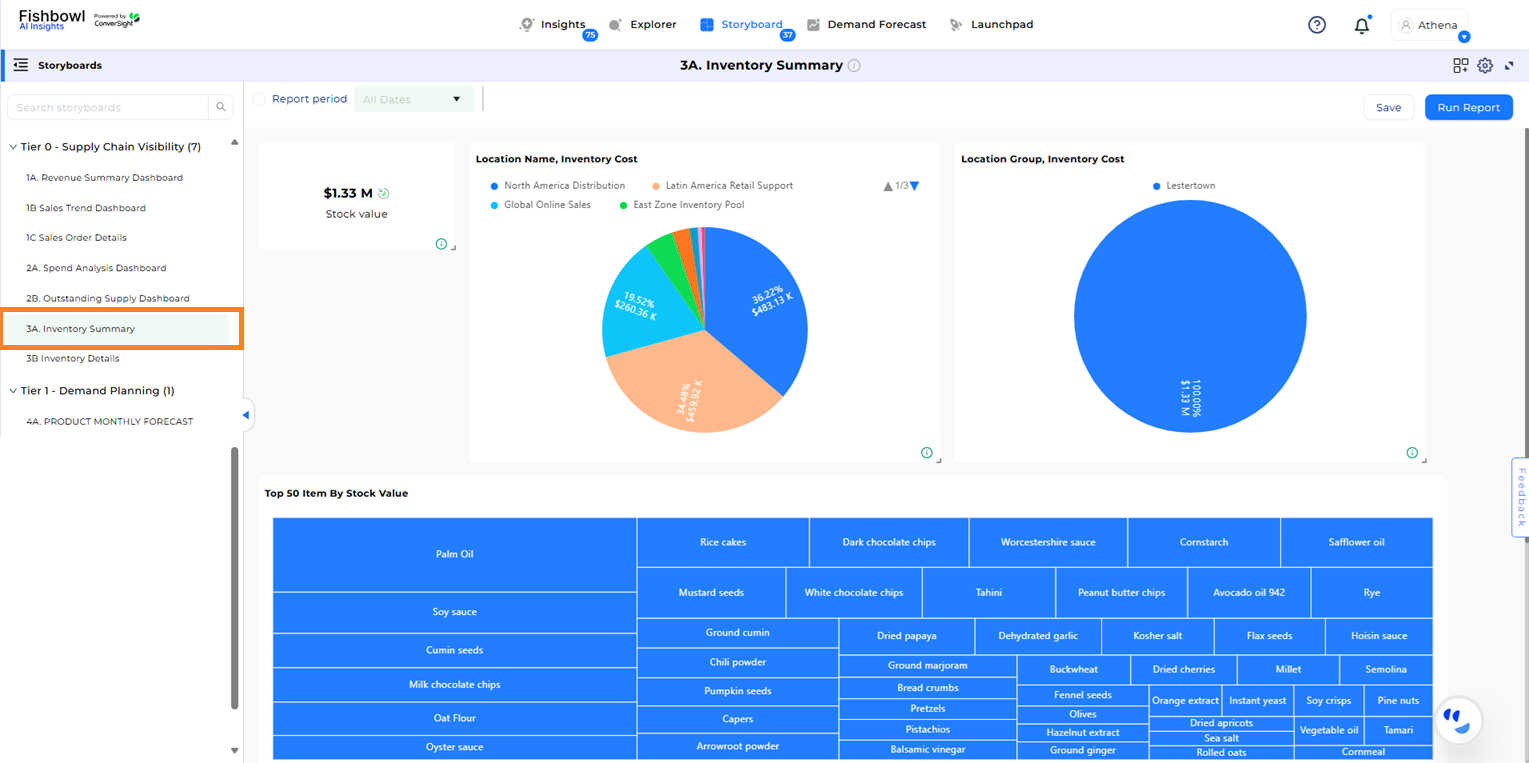
Inventory Summary Dashboard#
7. Inventory Details
Delve into detailed inventory data, including stock levels, vendor information and cost metrics. This Storyboard supports effective inventory control by offering a comprehensive view of your SKUs.
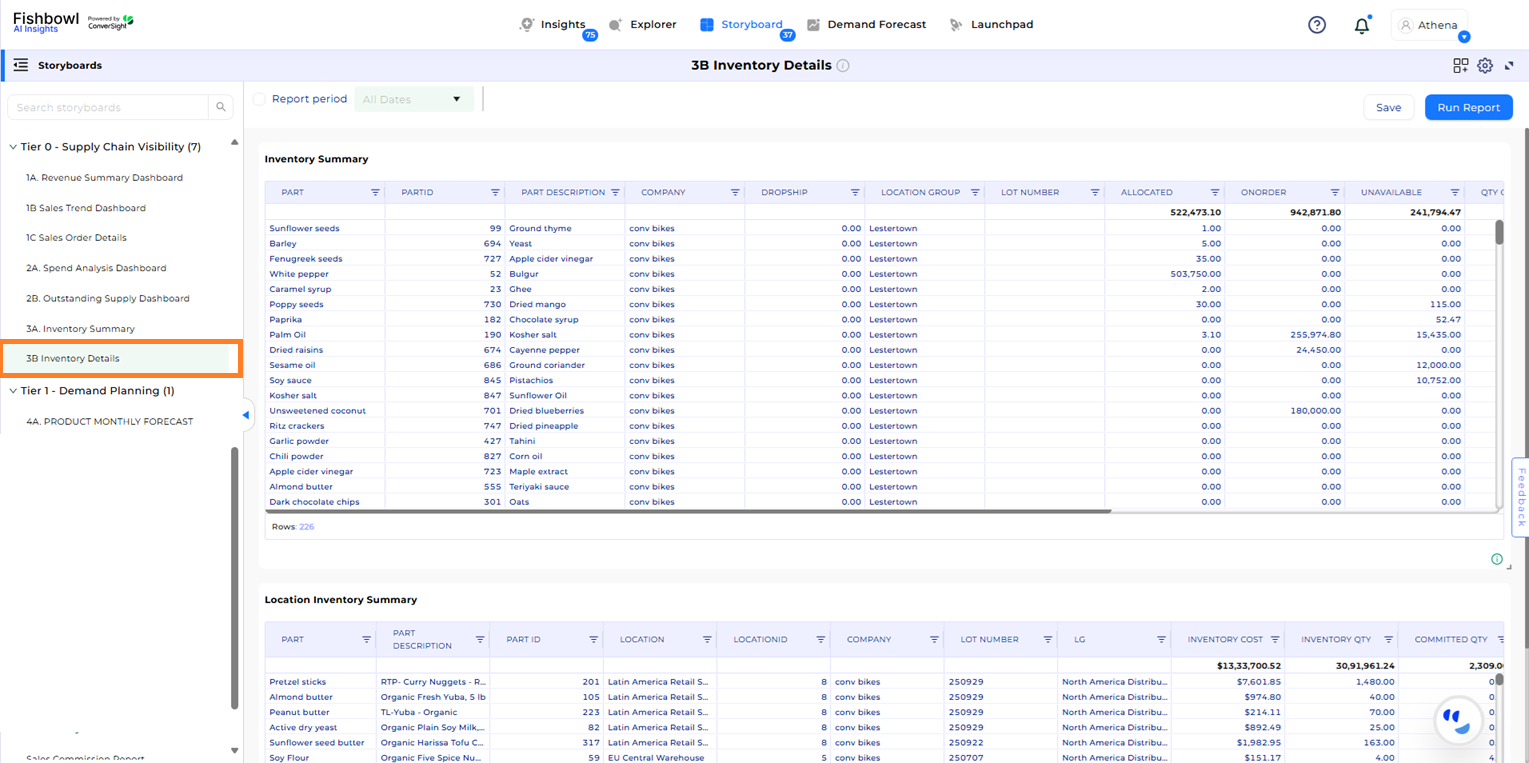
Inventory Details Dashboard#
8. Product Monthly Forecast
This Storyboard provides detailed forecasts of future demand at the item level through AI-driven algorithms. It examines historical sales data, incorporates seasonal variations and detects emerging trends to deliver precise demand projections for the coming months. This capability aids users in optimizing inventory planning and aligning with projected market requirements.
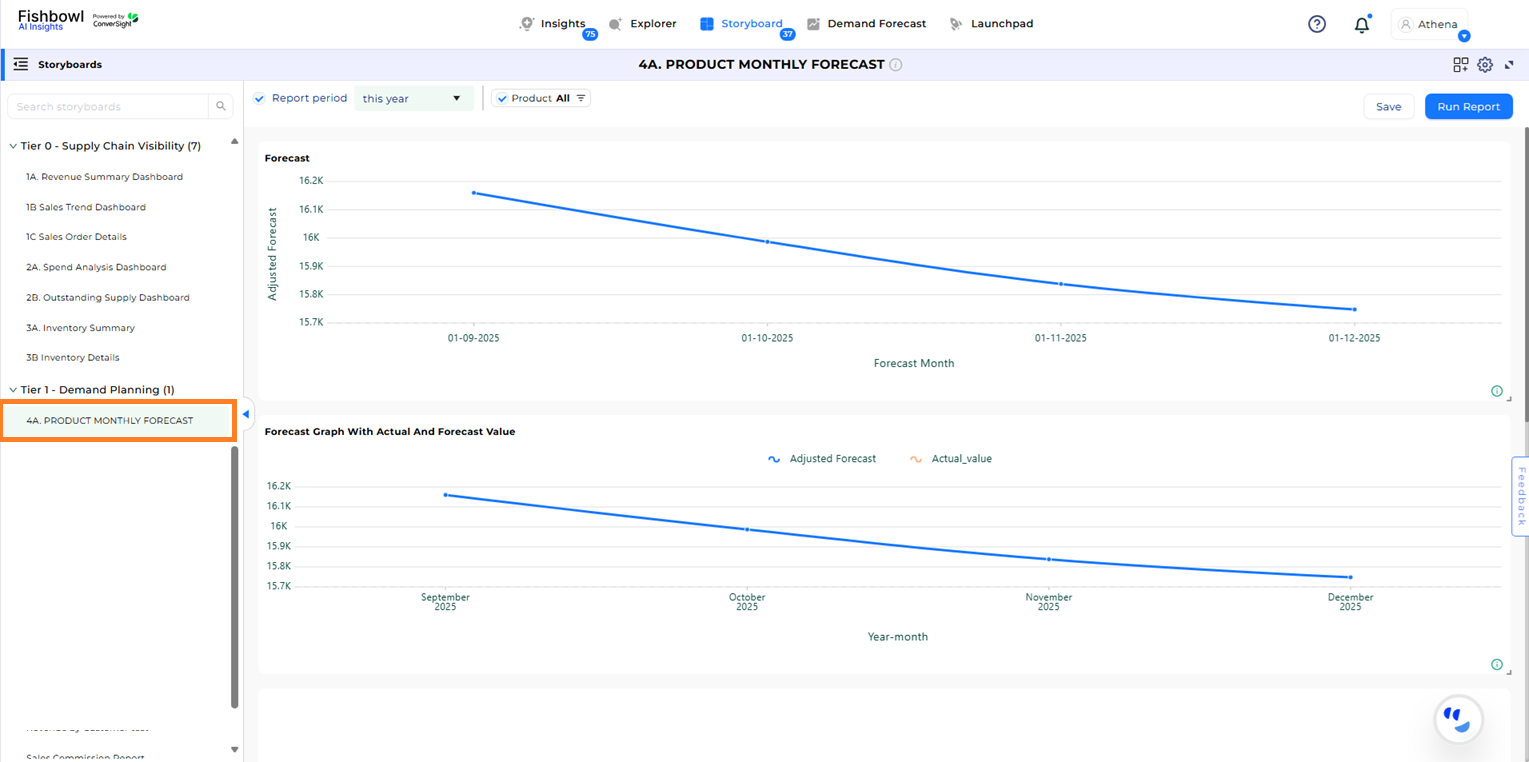
Product Monthly Forecast Dashboard#
9. Bill of Material (BoM)
Review your bill of material hierarchy to understand the parts and sub-assemblies needed for production. This Storyboard helps identify potential shortages based on forecasted demand and supply.
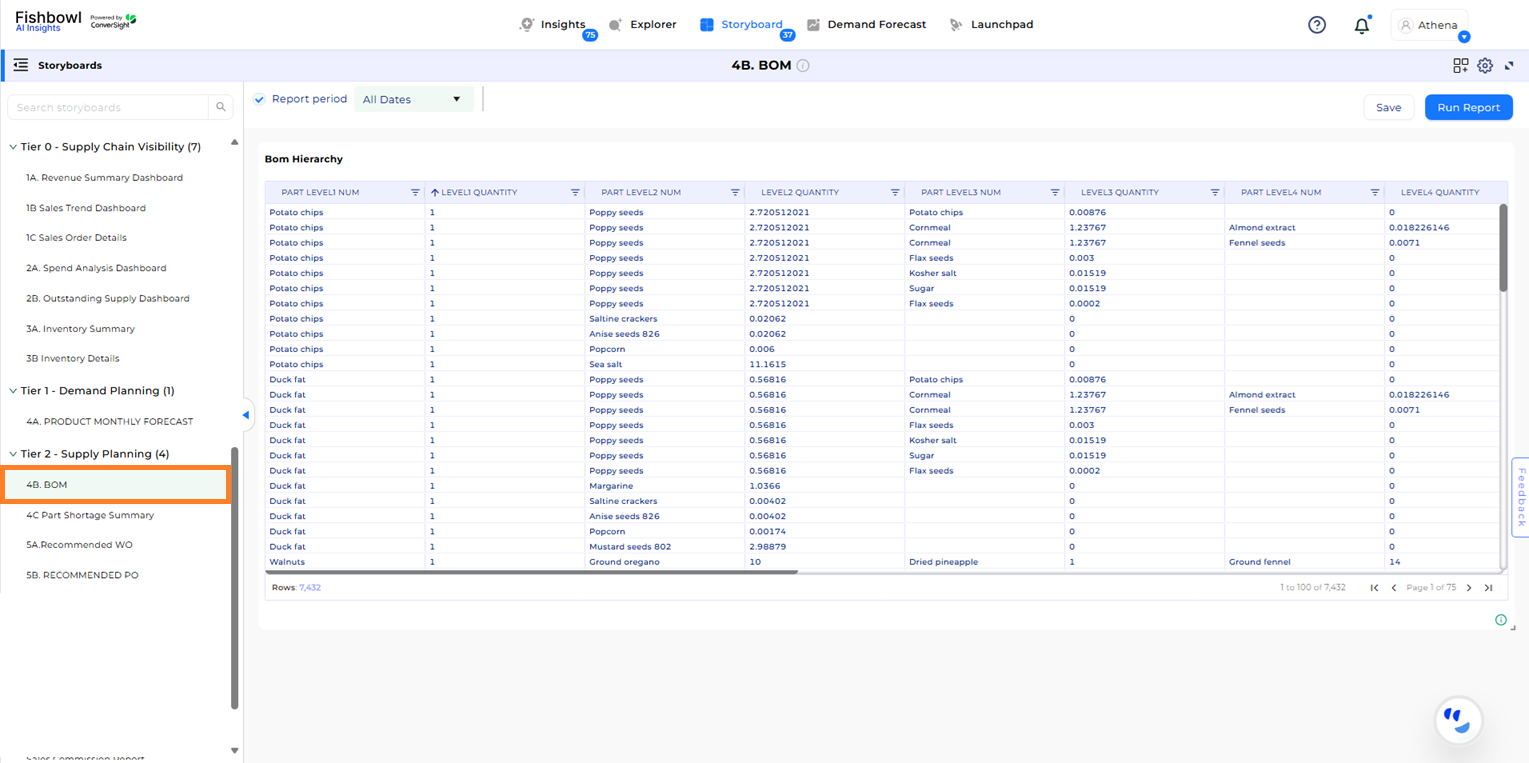
BOM Dashboard#
10. Part Shortage Summary
This Storyboard helps users project stock levels and identify potential shortages on a monthly basis by analyzing sales forecasts and purchase orders. It enables proactive inventory management to ensure that demand is met and stockouts are avoided.
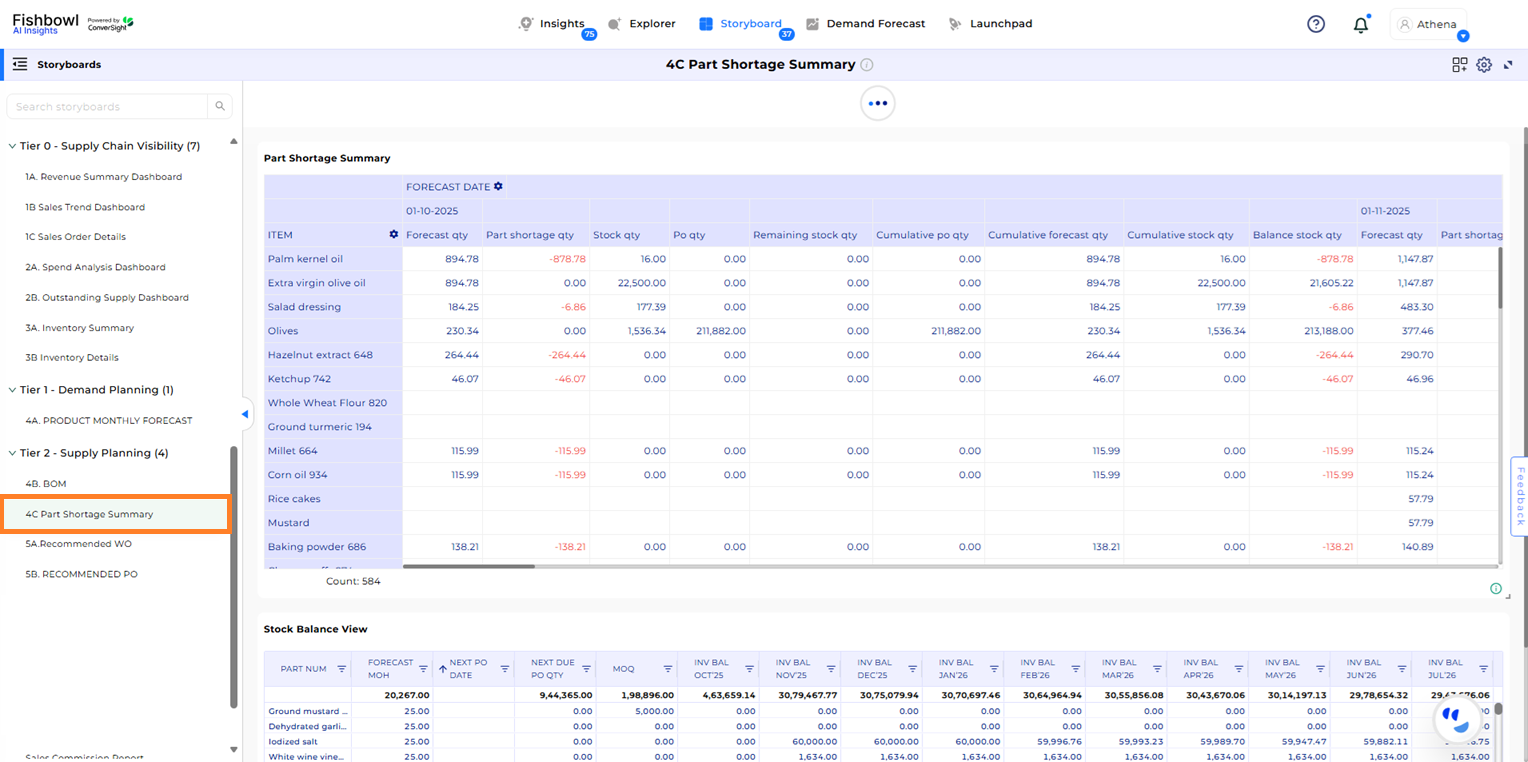
Part Shortage Summary Dashboard#
11. Recommended PO
Optimize inventory levels with recommendations on purchase orders. This Storyboard analyzes demand forecasts, supply plans and supplier performance to suggest optimal purchasing strategies.
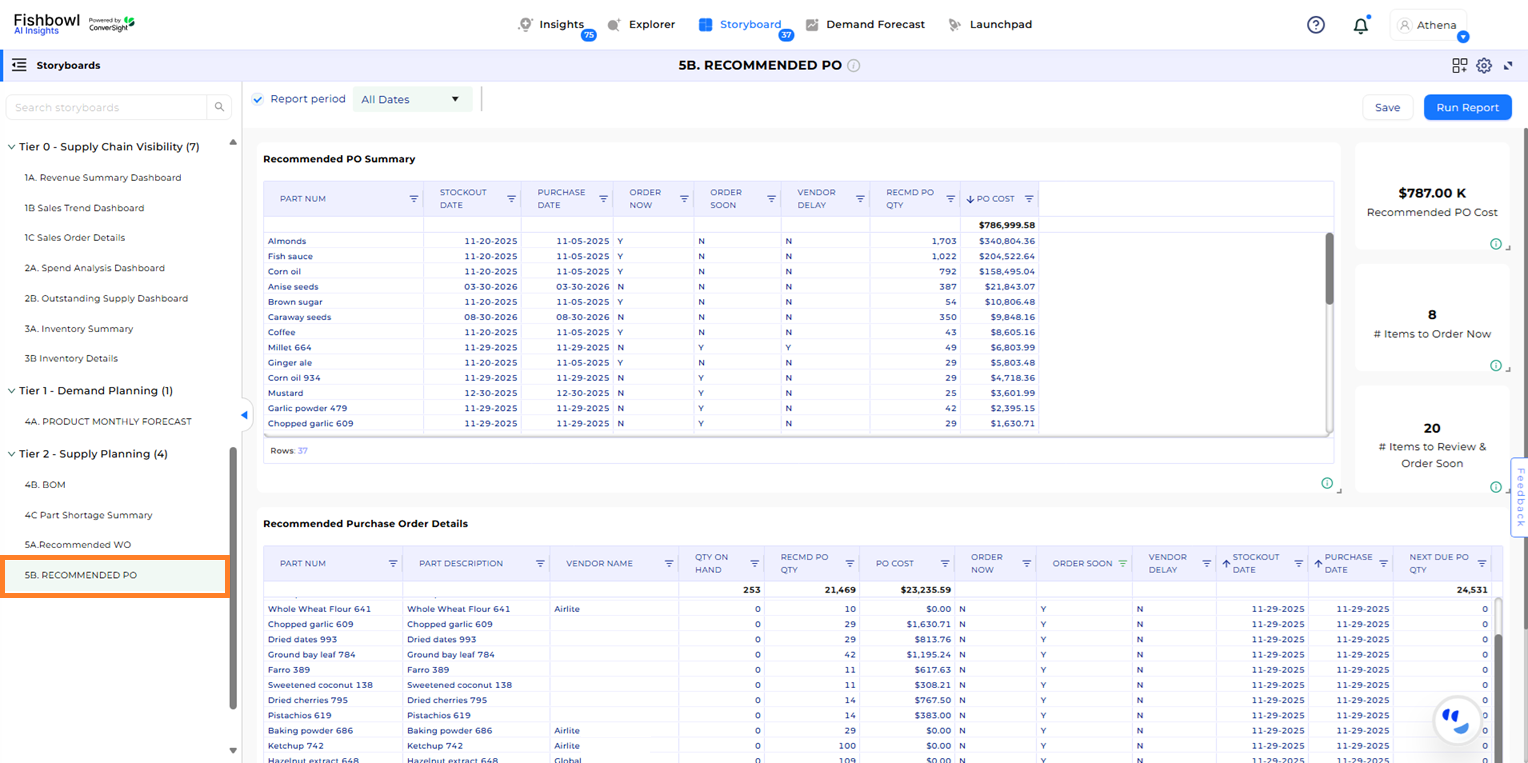
Recommended PO Dashboard#
12. Recommended WO
This Storyboard provides AI-driven recommendations for production planning and work order creation. It analyzes demand forecasts, current inventory levels, bill of materials, and production capacity to suggest optimal work order quantities and timing. The Storyboard helps manufacturers optimize production schedules, reduce excess inventory, and prevent stockouts by aligning manufacturing output with projected demand.
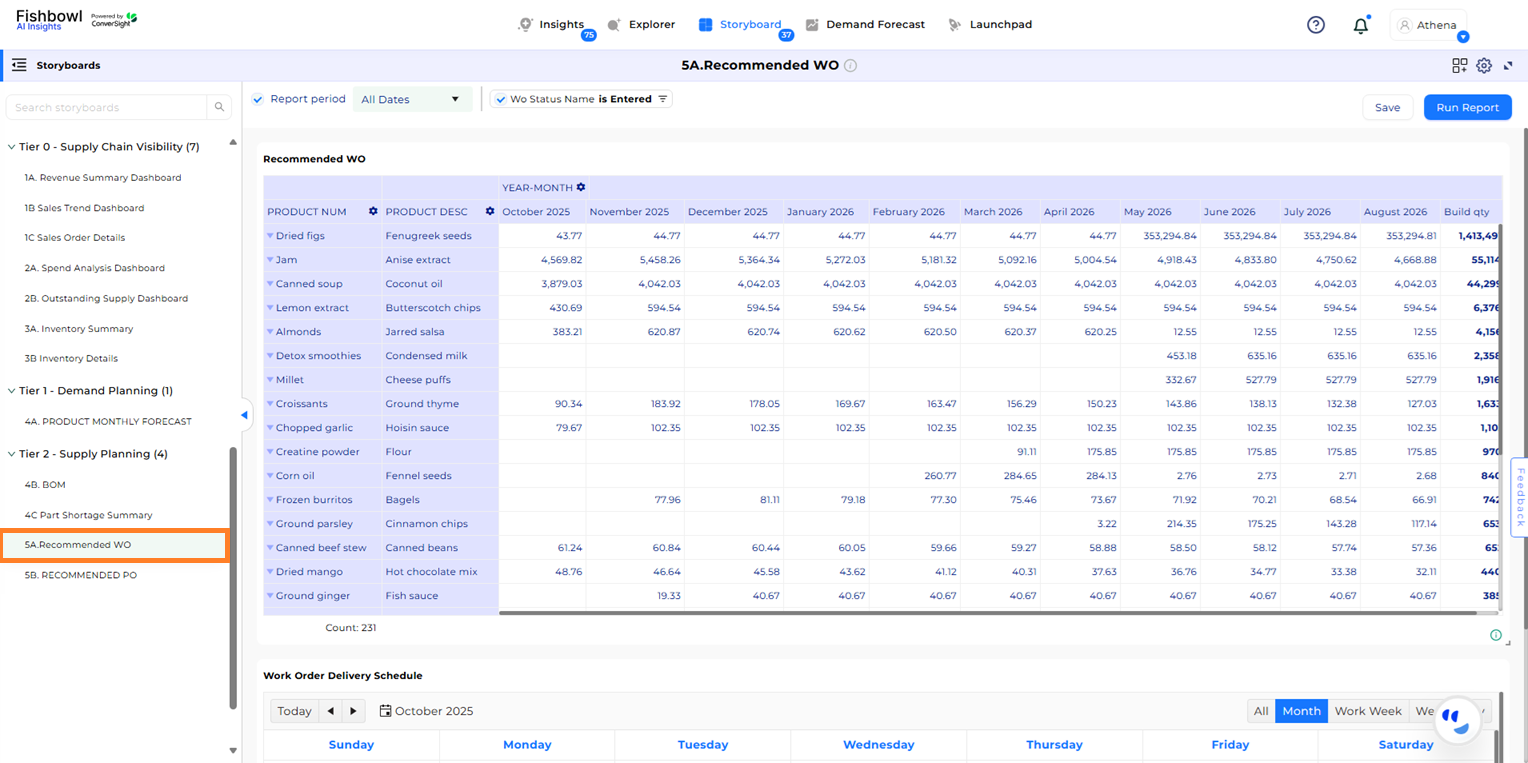
Recommended WO Dashboard#
Business Outcomes#
Prescriptive Decision-Making: AI recommendations for purchasing and production guide teams on optimal actions, helping organizations move from predictive insights to actionable, prescriptive decisions.
Enhanced Production Planning: The Recommended WO Storyboard analyzes current inventory, forecasted demand, and bill of materials to optimize work orders, reduce production bottlenecks, and align manufacturing output with demand.
Optimized Procurement: The Recommended PO Storyboard evaluates supplier performance and demand forecasts to suggest the most effective purchase orders, improving cost efficiency and supplier collaboration.
Supply Chain Resilience: Dashboards such as BoM and Part Shortage Summary allow organizations to anticipate material shortages and potential disruptions, enabling proactive mitigation of risks in the supply chain.