Top/Bottom Queries#
Top/Bottom Queries help users identify the highest or lowest performing values based on a selected metric and dimension. These insights are useful for questions like Top 10 Products by Sales or Bottom 5 Regions by Revenue.
Follow the steps below to run a Top/Bottom Query:
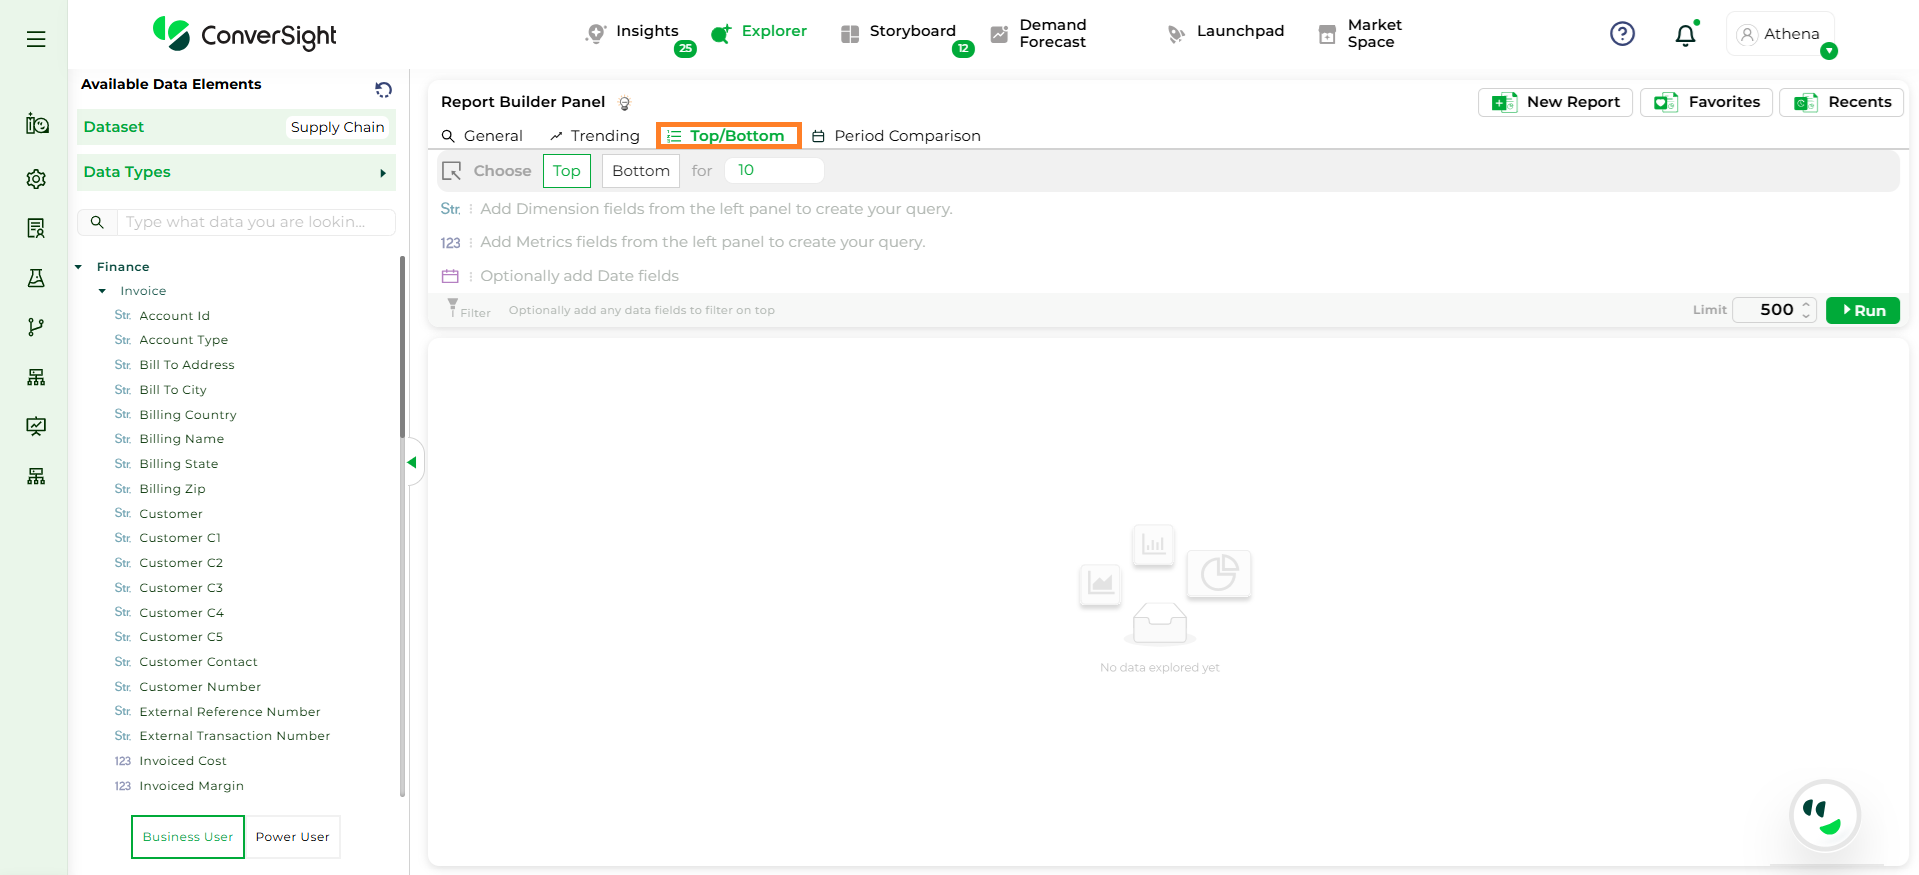
Step 1: On the Explorer page, click on the Top/Bottom option in the query panel to get started.
Top Queries#
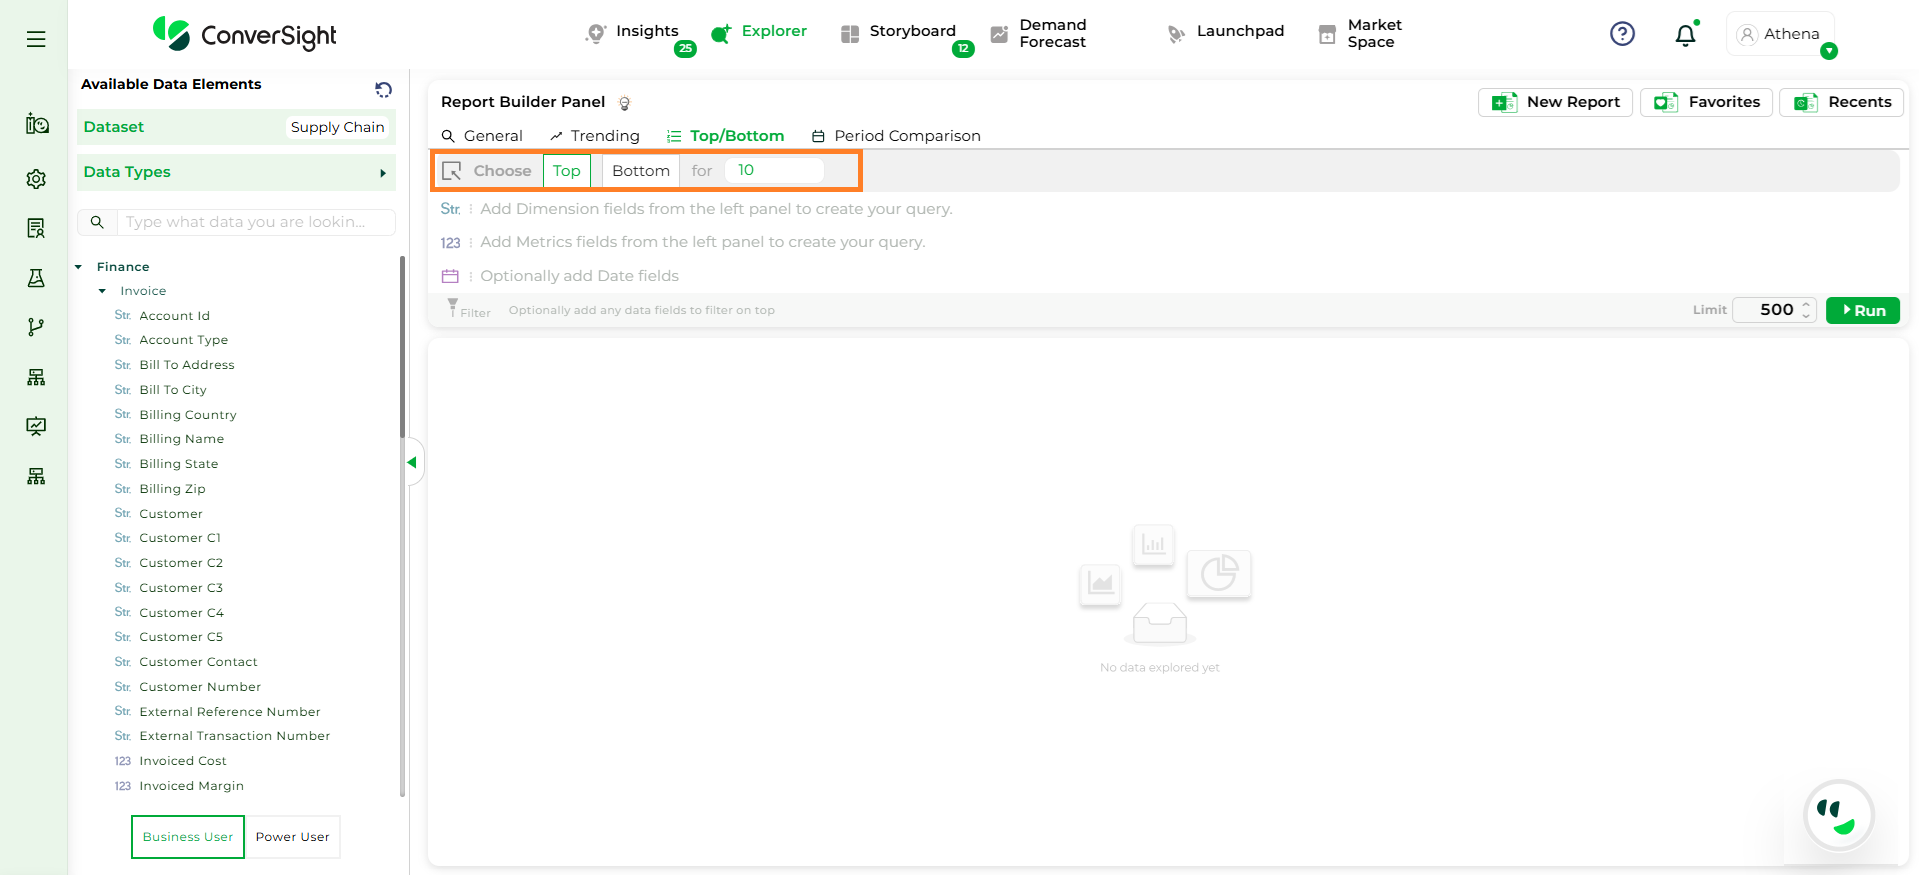
Step 2: Select whether you want to view the Top or Bottom values. By default, the option is set to Top and the result count is set to 10, which can be adjusted if required.
Top/Bottom Queries#
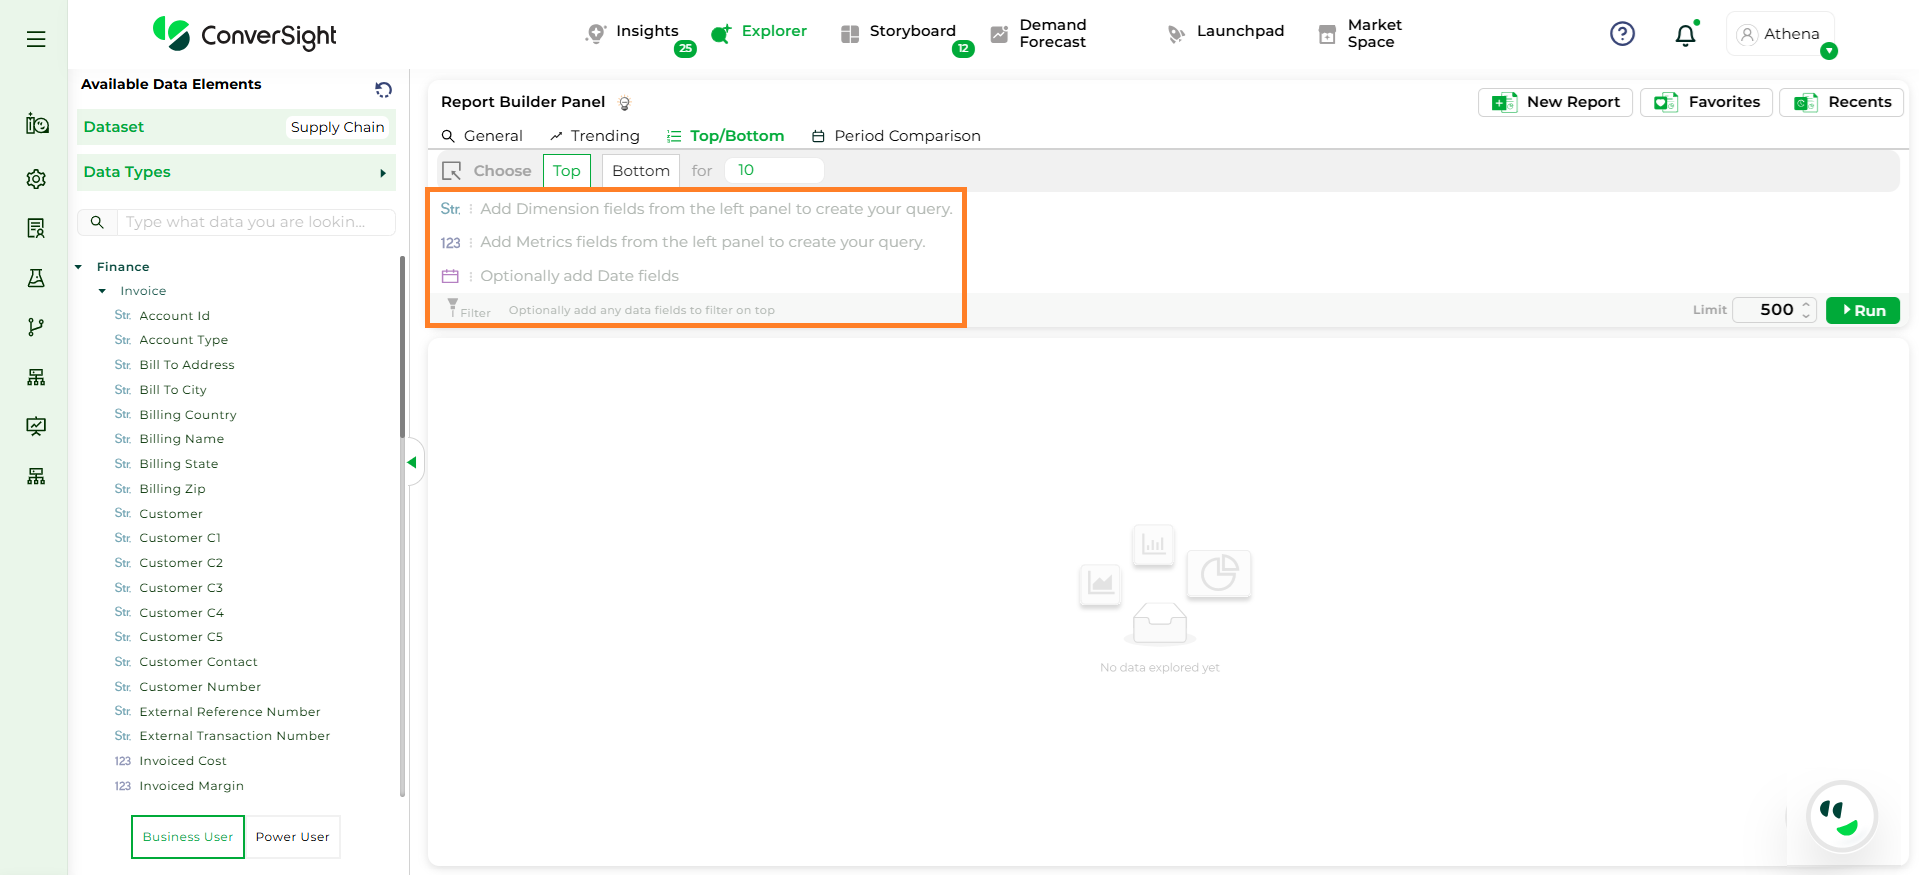
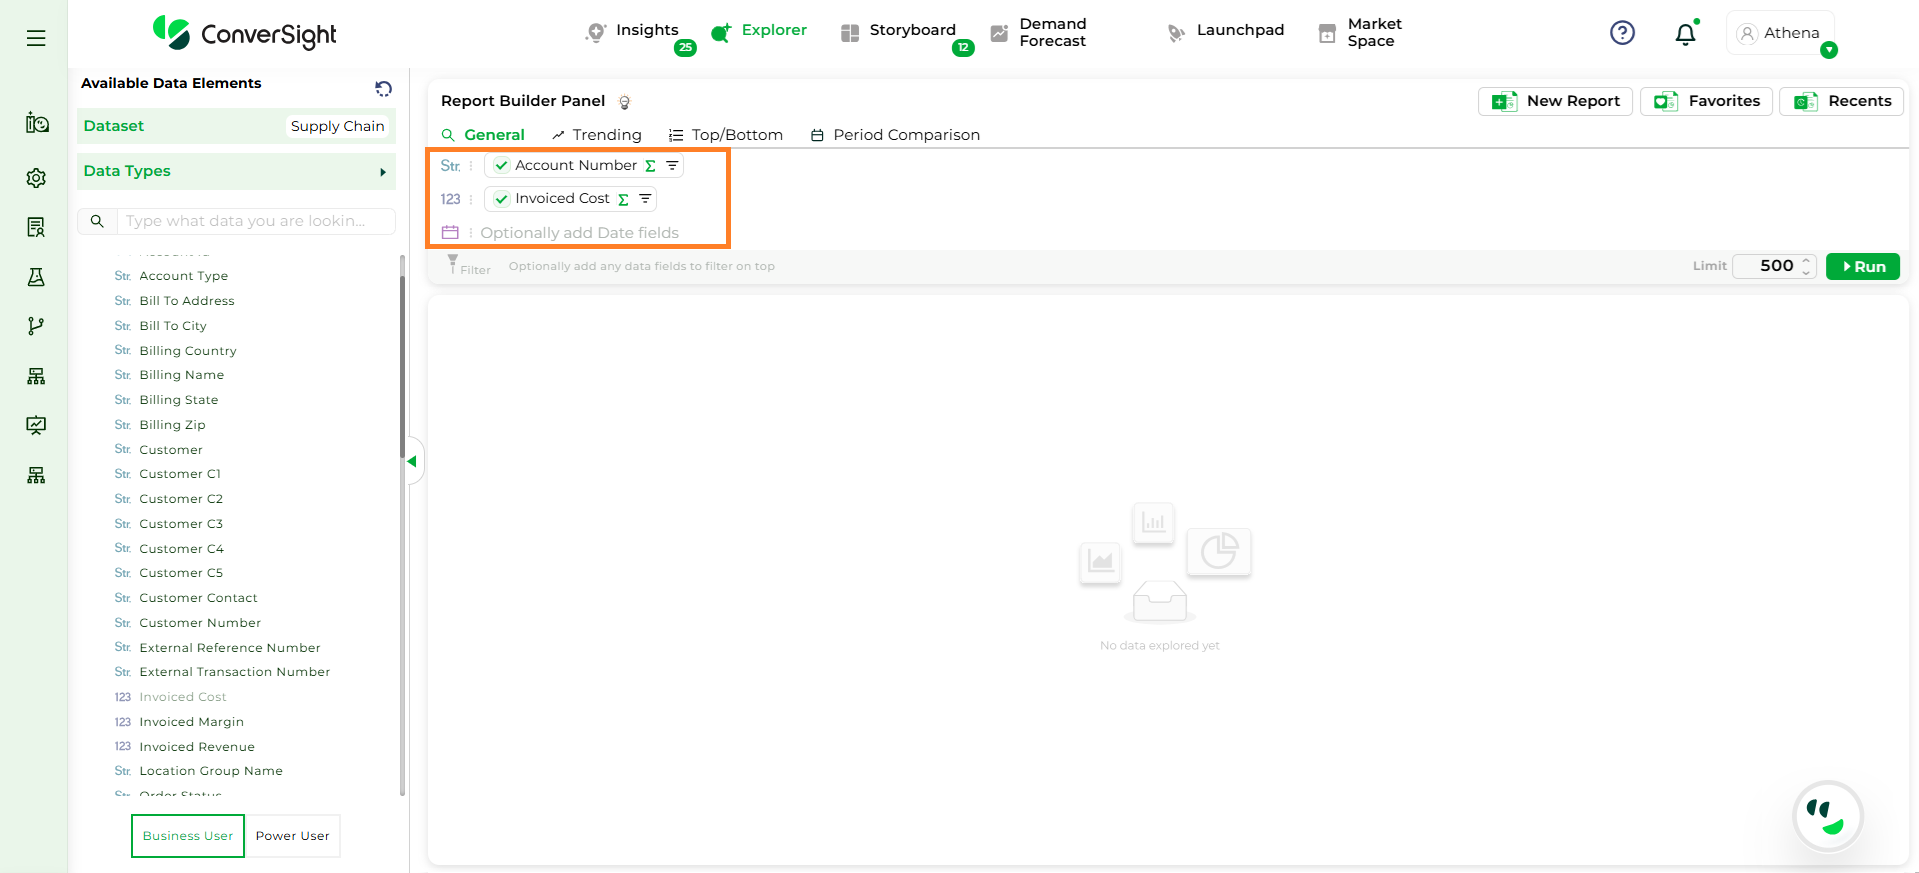
Step 3: To configure the query, select At Least One Dimension and Metric column to enable the Run button. The first metric column selected becomes the primary column for the query. The Date dropdown is set to None by default.
Choose Columns#
NOTE
The Run option will remain disabled until at least one Dimension and Metric column is added.
Step 4: Aggregation is supported for the selected Metric and Dimension column. For metrics, aggregations include Sum and Average while, Dimension supports Count; additional aggregation options will be added in a future release. Filtering is supported for Date columns, allowing you to narrow down data based on specific time ranges.
Aggregation#
Step 5: After all selections are made, click the Run button to generate the Top/Bottom report.
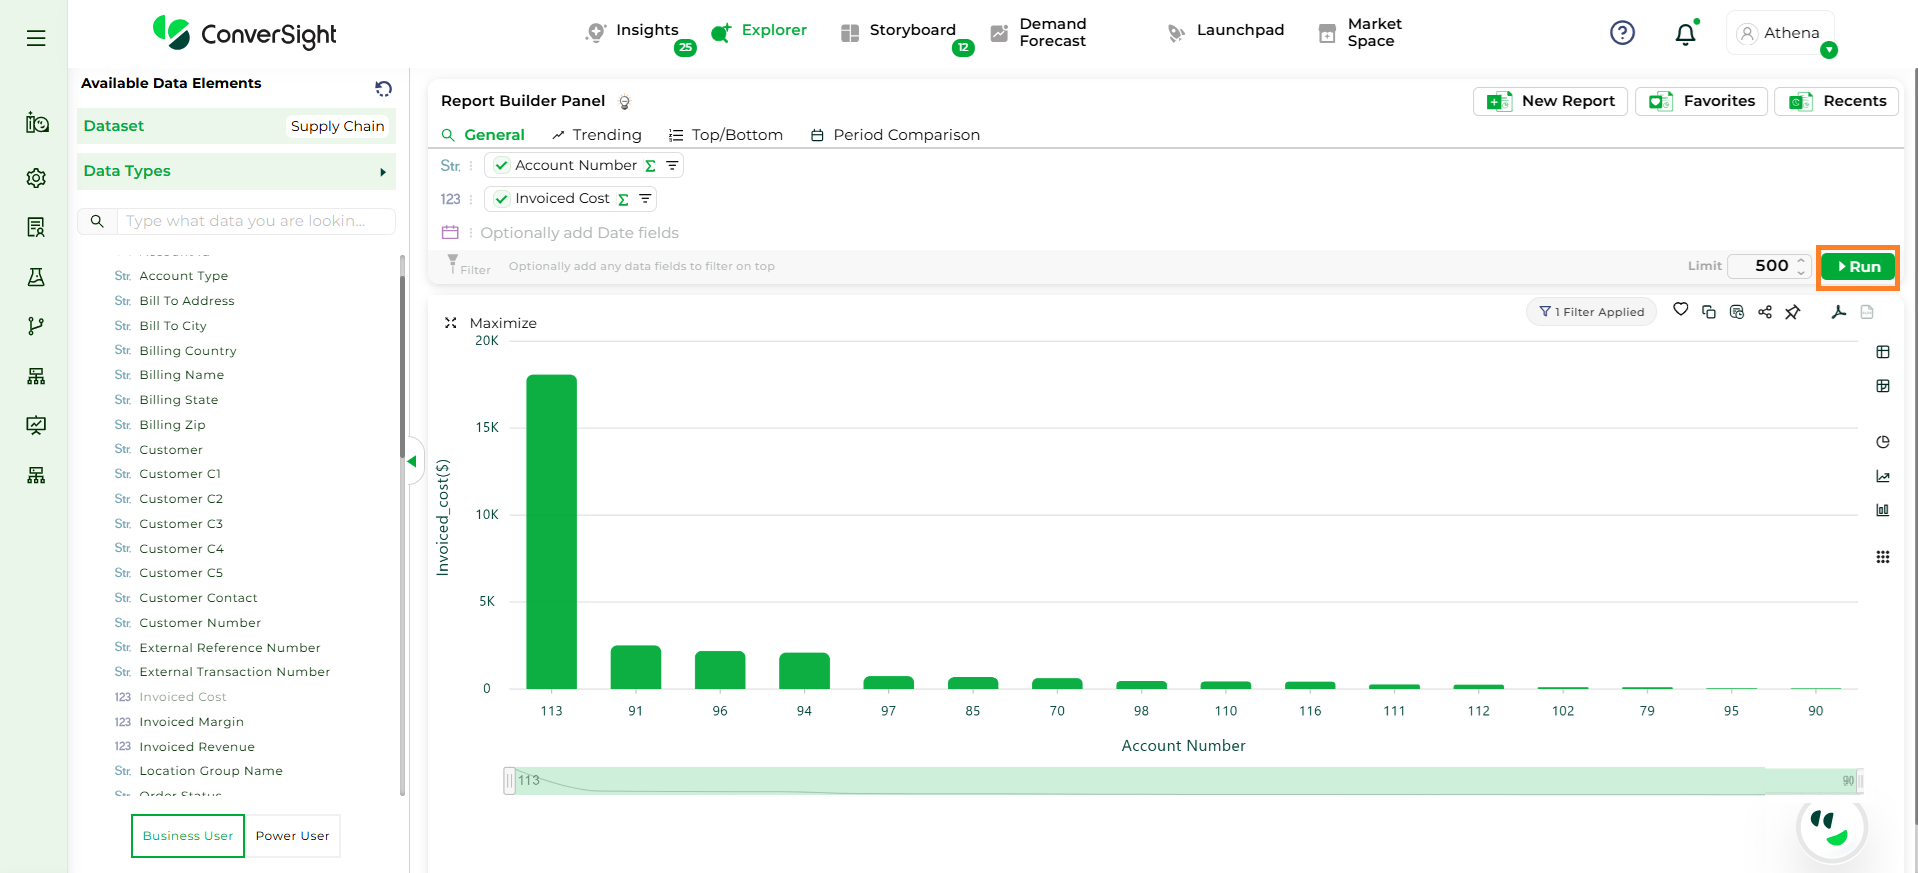
Run Button#