Customizing Reports#
Once a report is created, users can customize it by adding or hiding columns any number of columns in the report as needed.
NOTE
Adding or hiding columns can only be done in the CS Table view.
Adding Columns#
Users can add one or more columns to existing reports by following these steps:
Step 1: First, navigate to the Favorites section and select the report to which you want to incorporate additional columns.
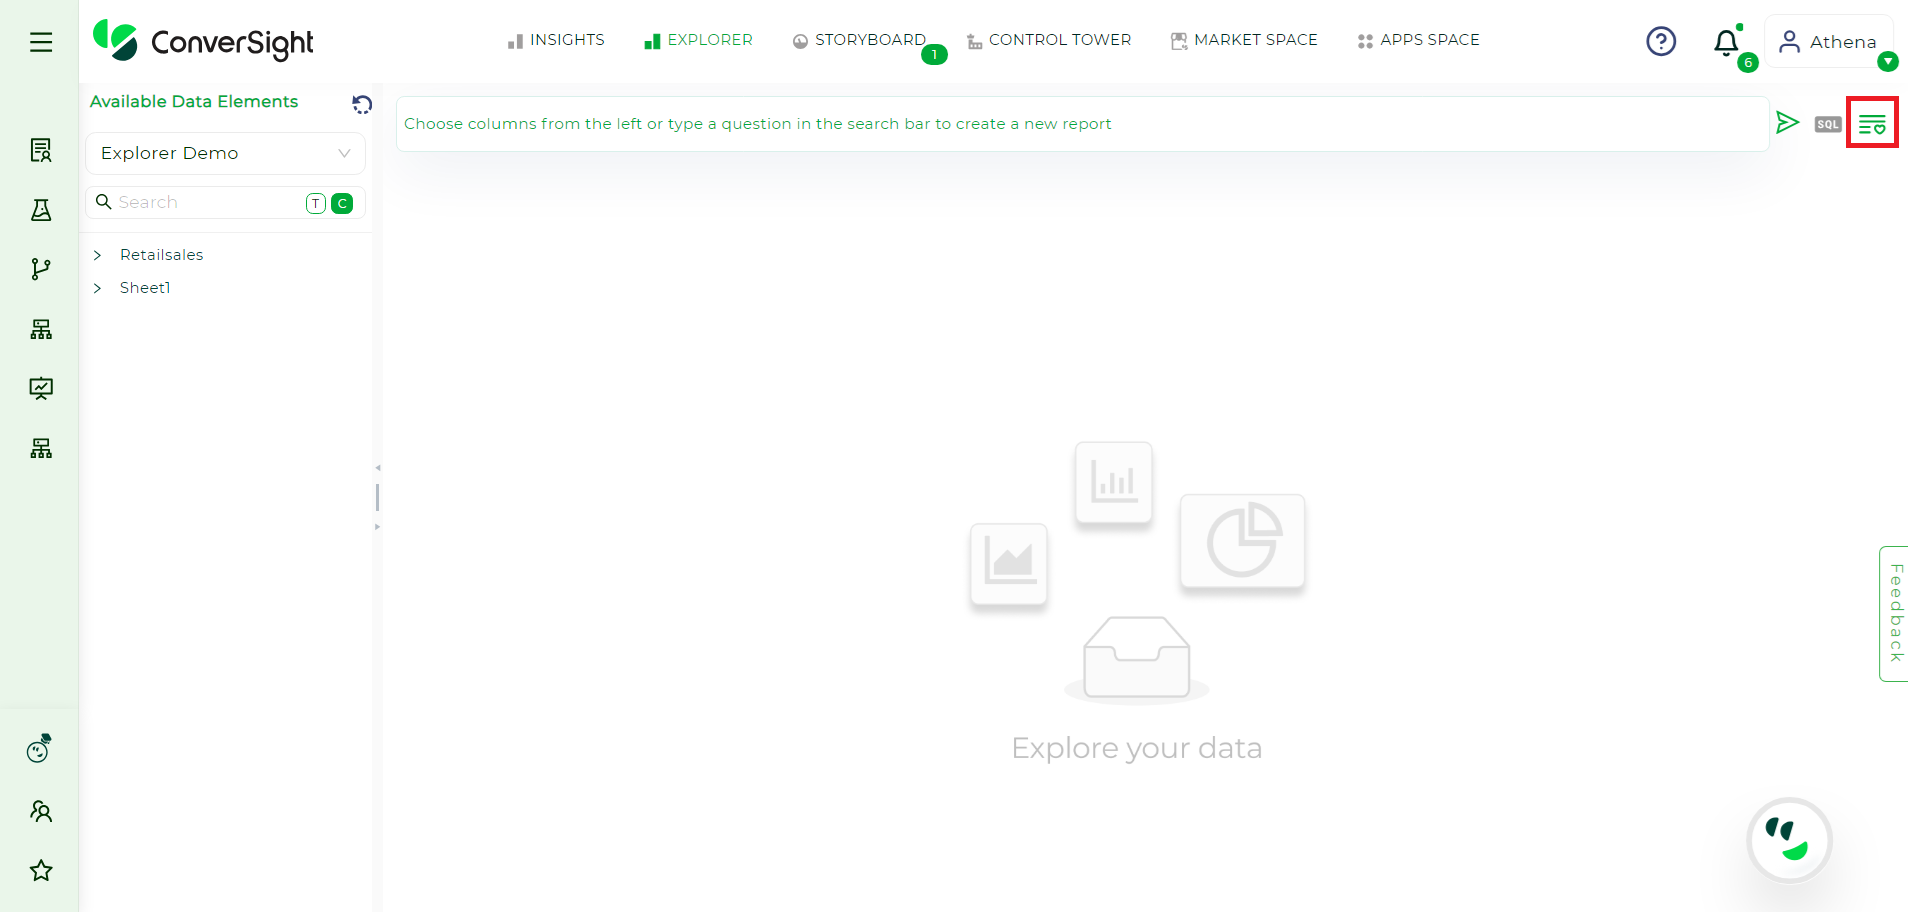
Favorites Section#
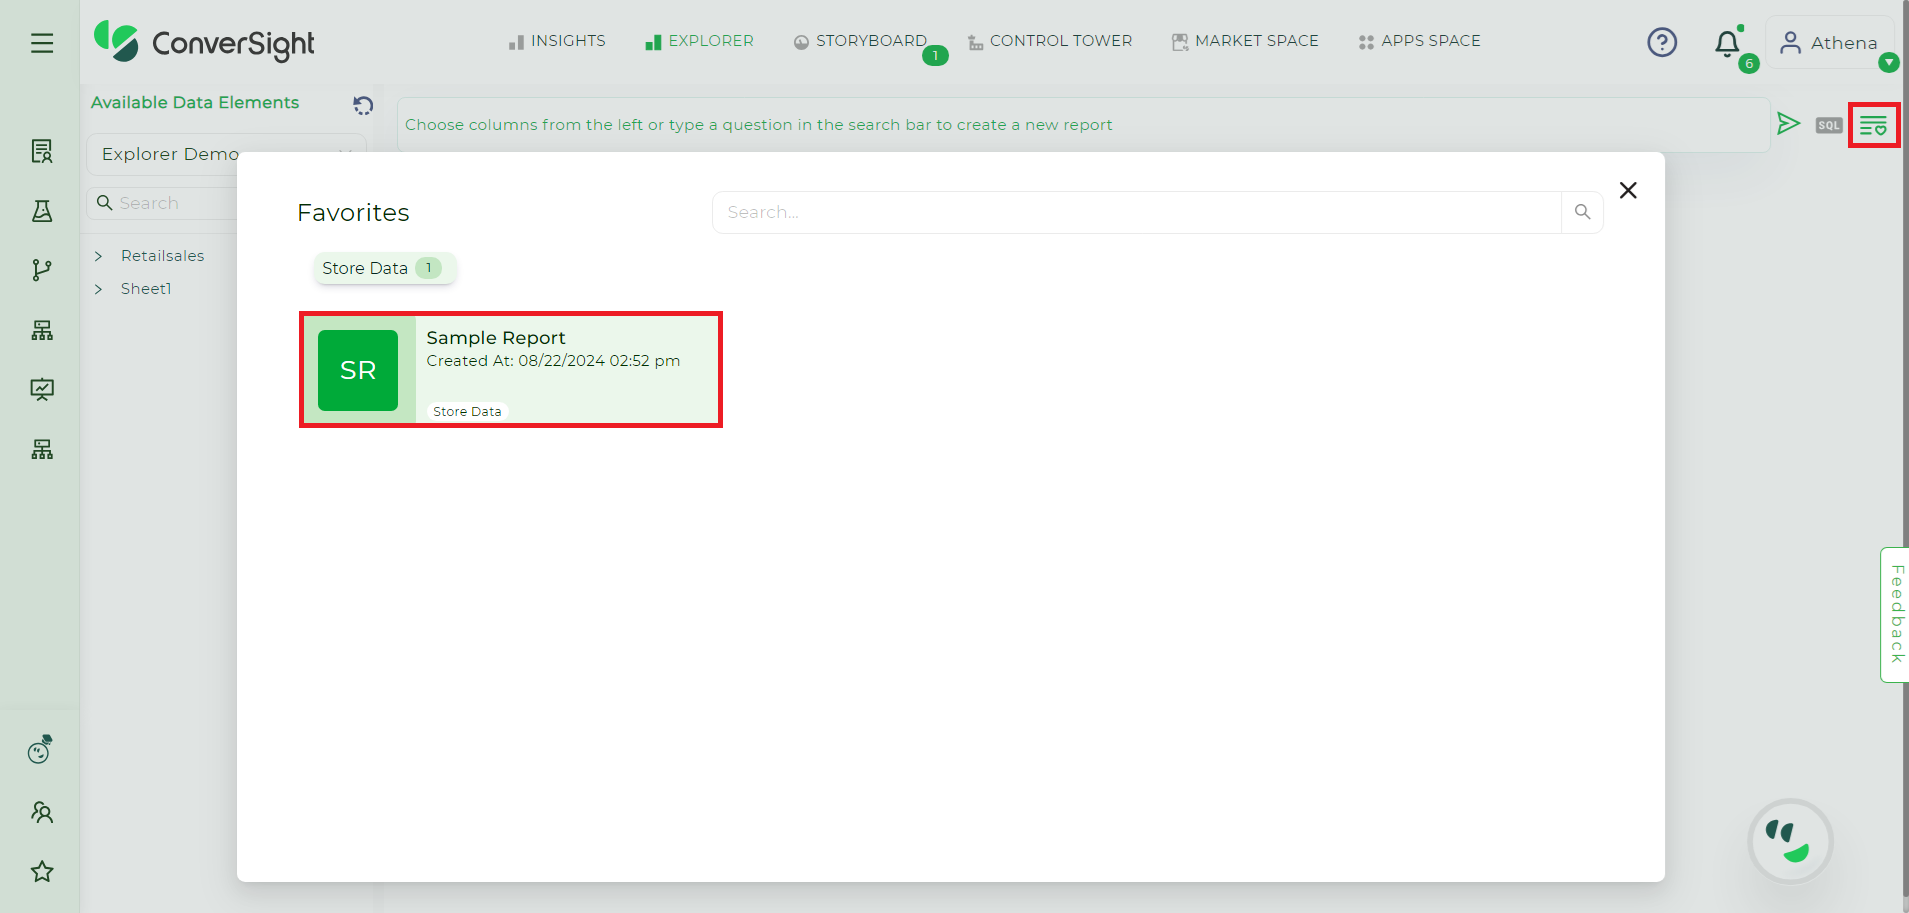
Selecting the Report#
Step 2: Once the report is selected it will be displayed in the Explorer page.
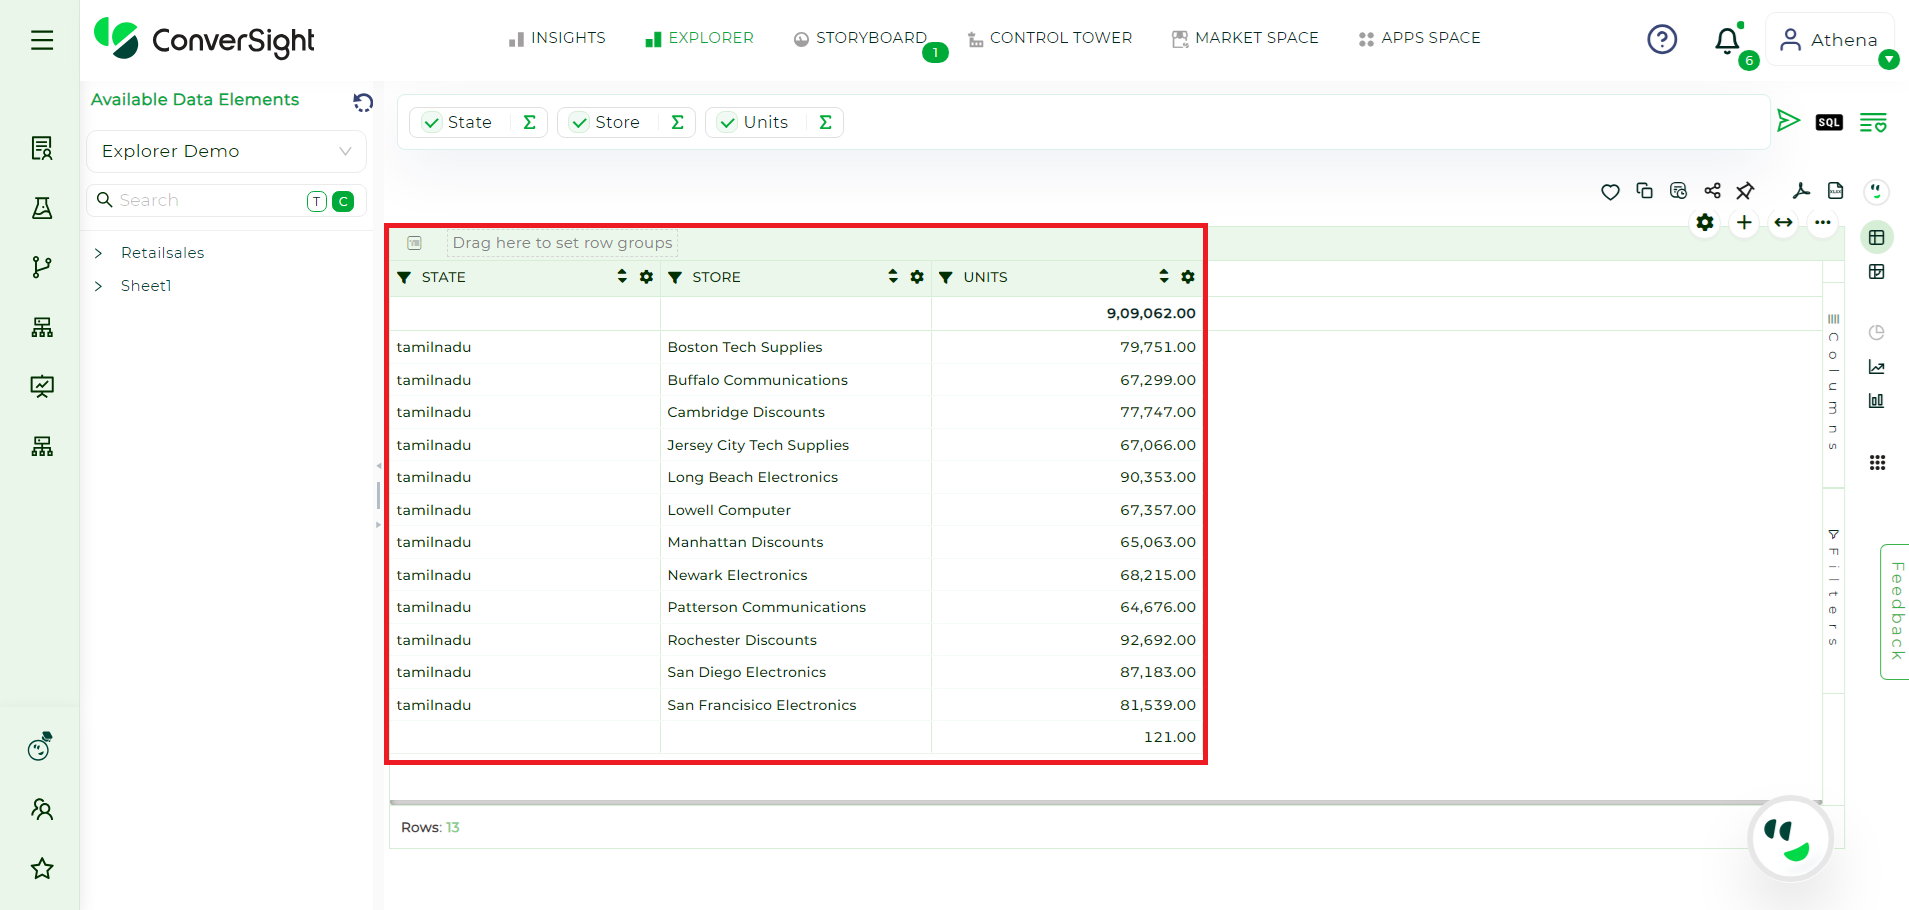
Report#
Step 3: Users will find that all tables, columns, calculated fields and smart analytics within the dataset are displayed on the left-hand side.
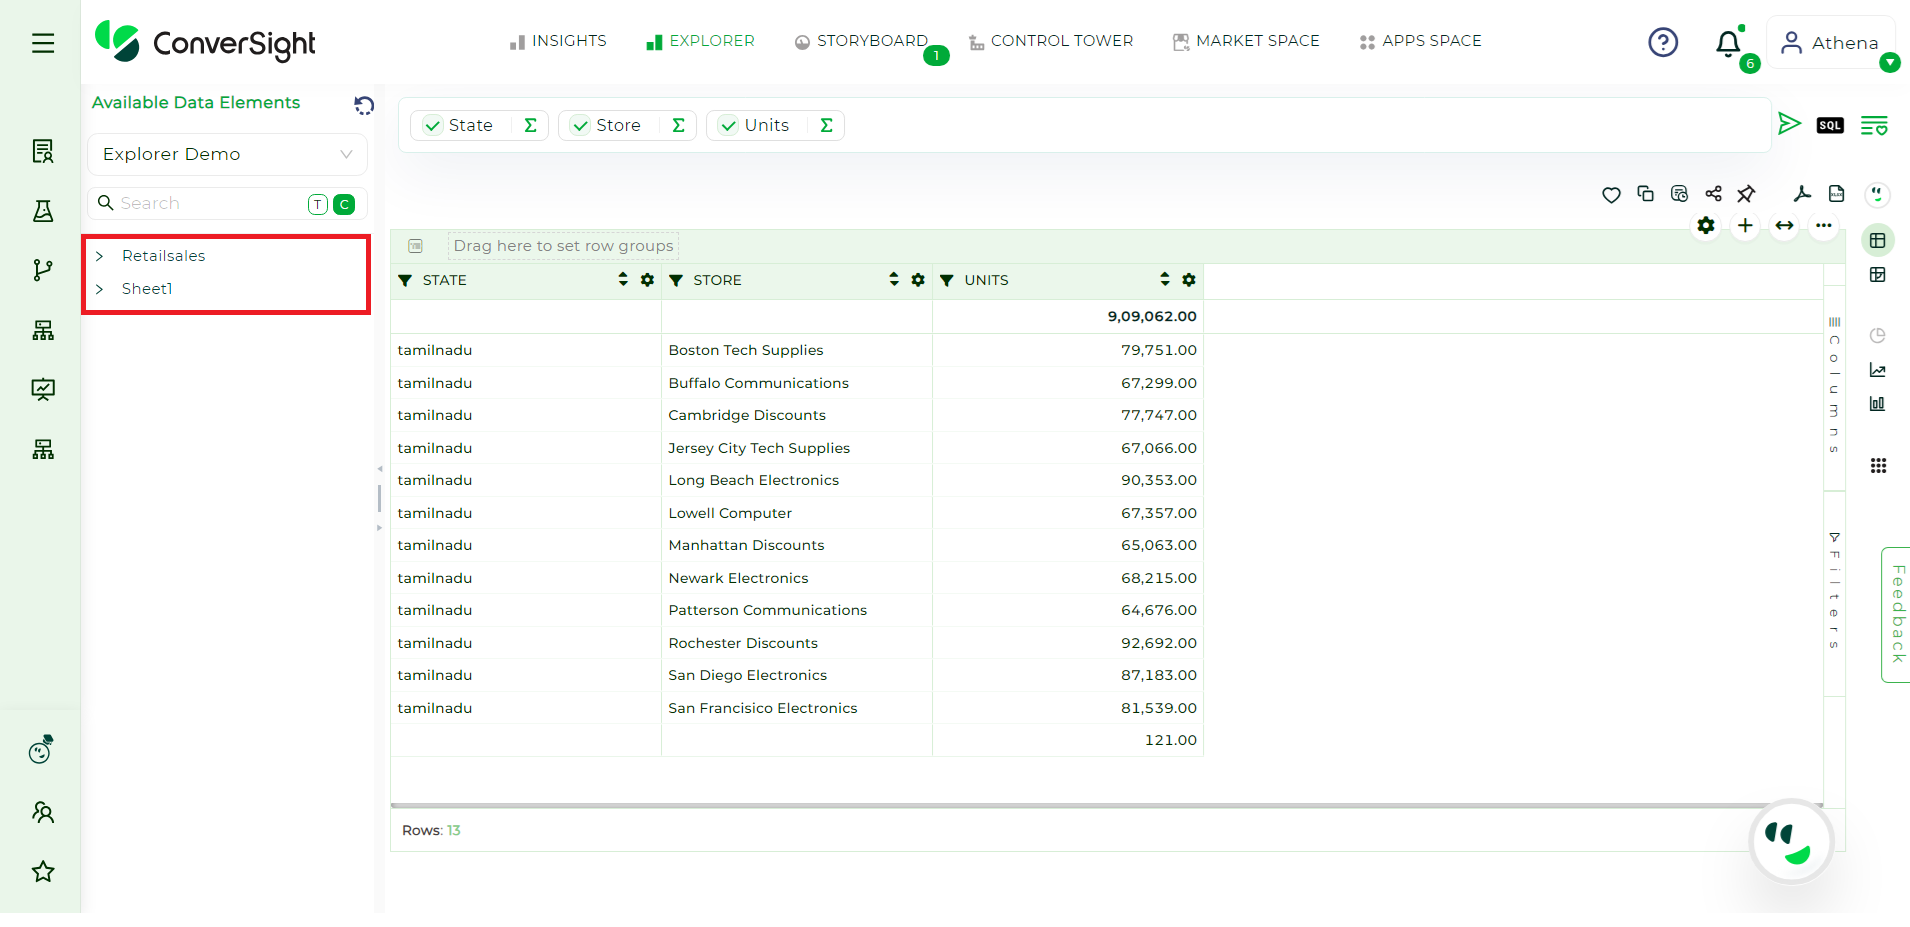
Report#
Step 4: Clicking on the desired table name will reveal all its columns. Users can then select the columns, Calculated Fields or Smart Queries they wish to include in their query.
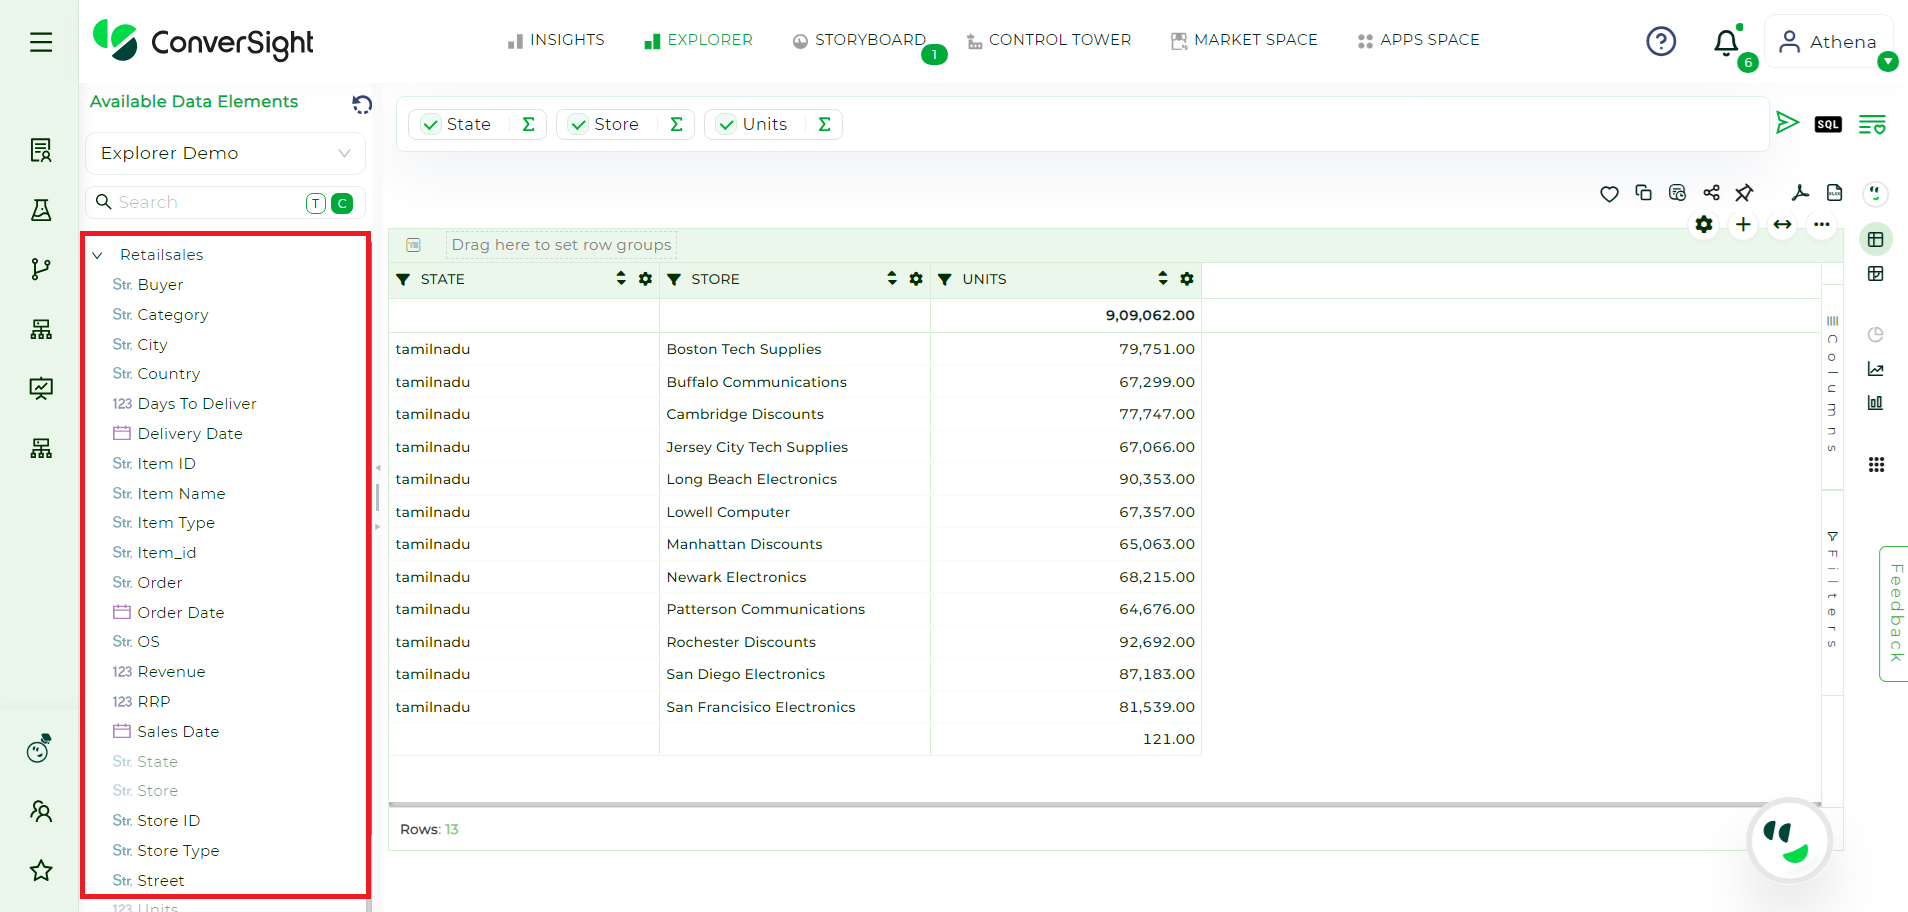
Report#
Step 5: Once you have selected the columns, click the Arrow Icon to generate the report.
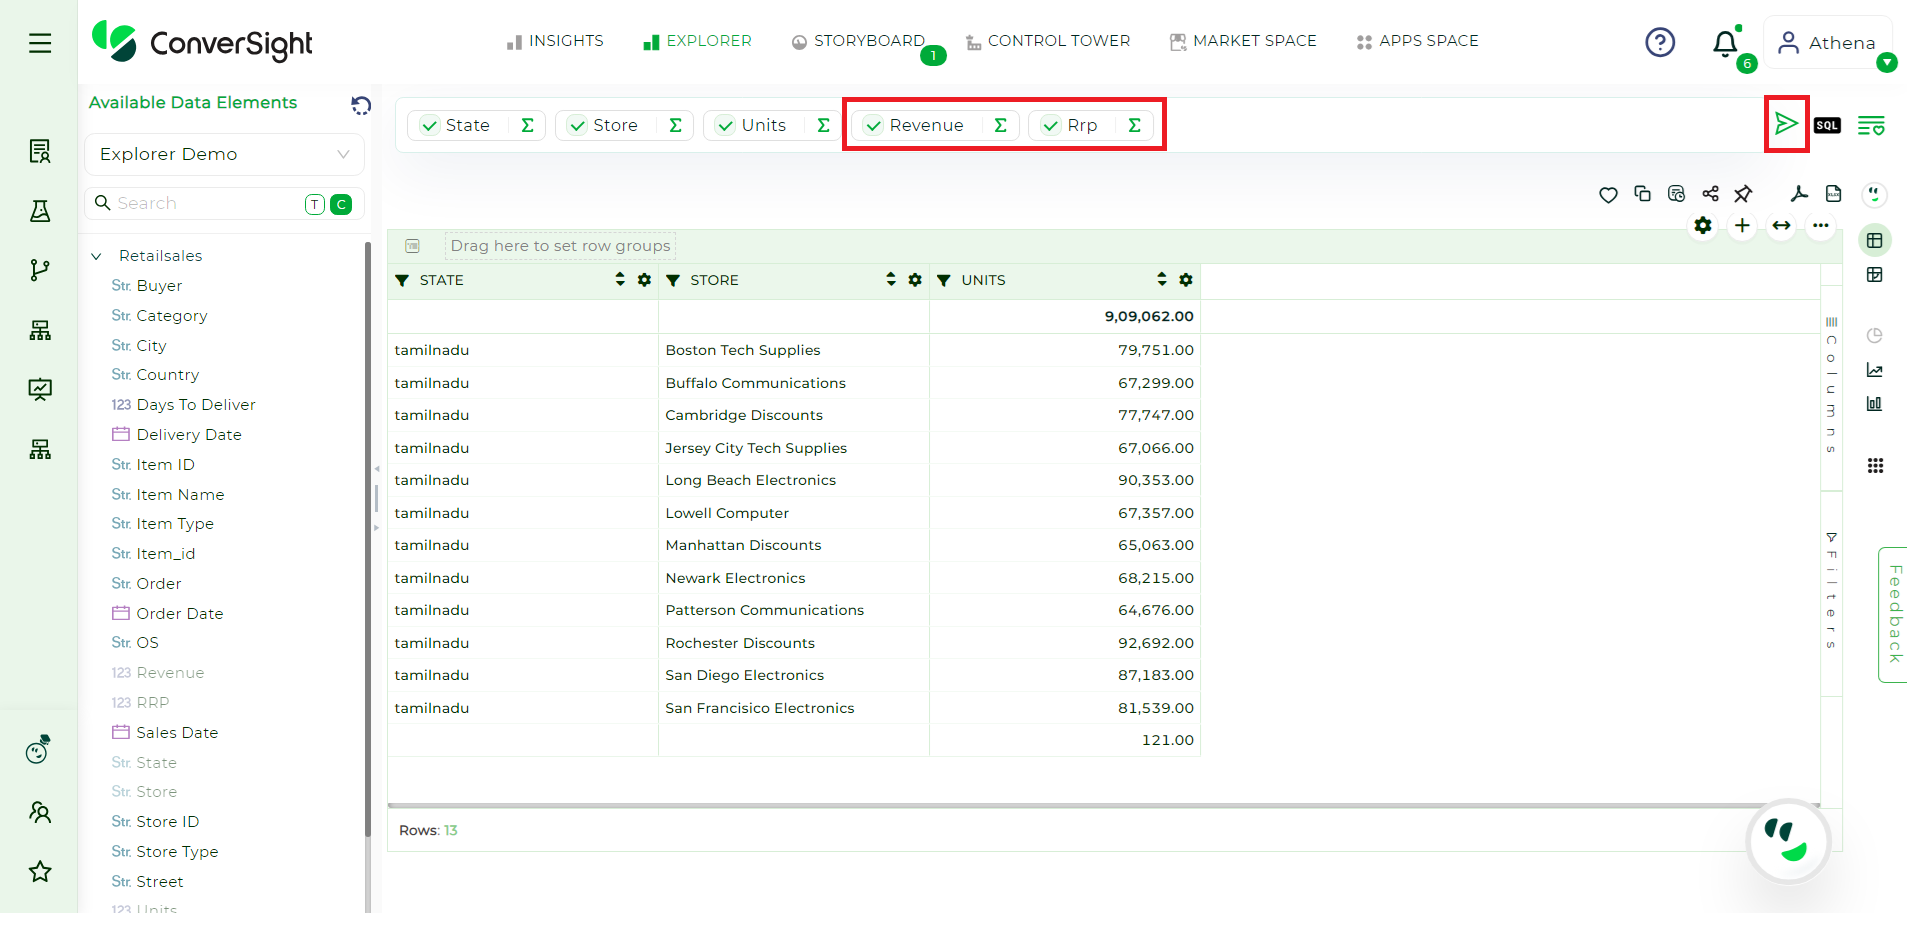
Adding Columns#
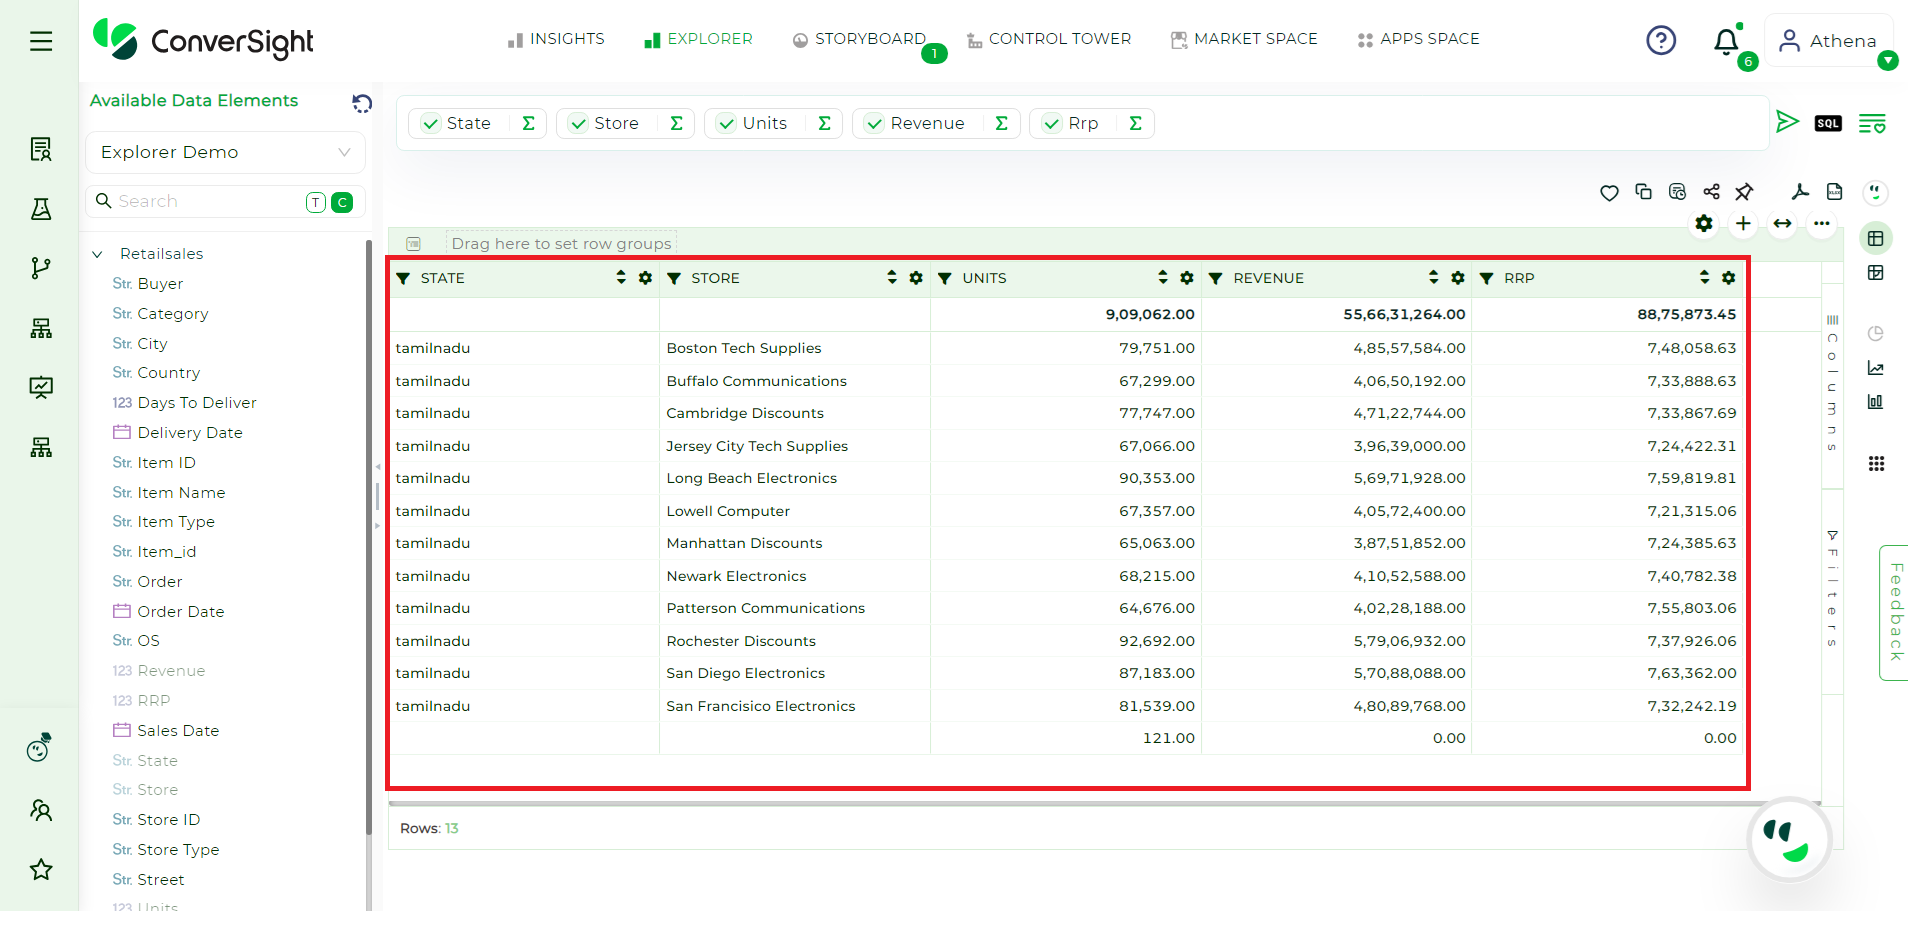
Report Generated#
Hiding Columns#
Users have the flexibility to hide a single column or multiple columns of existing reports.
Steps to Hide Columns are as follows:
Step 1: Click on the Columns option to display a list of all columns that have been queried.
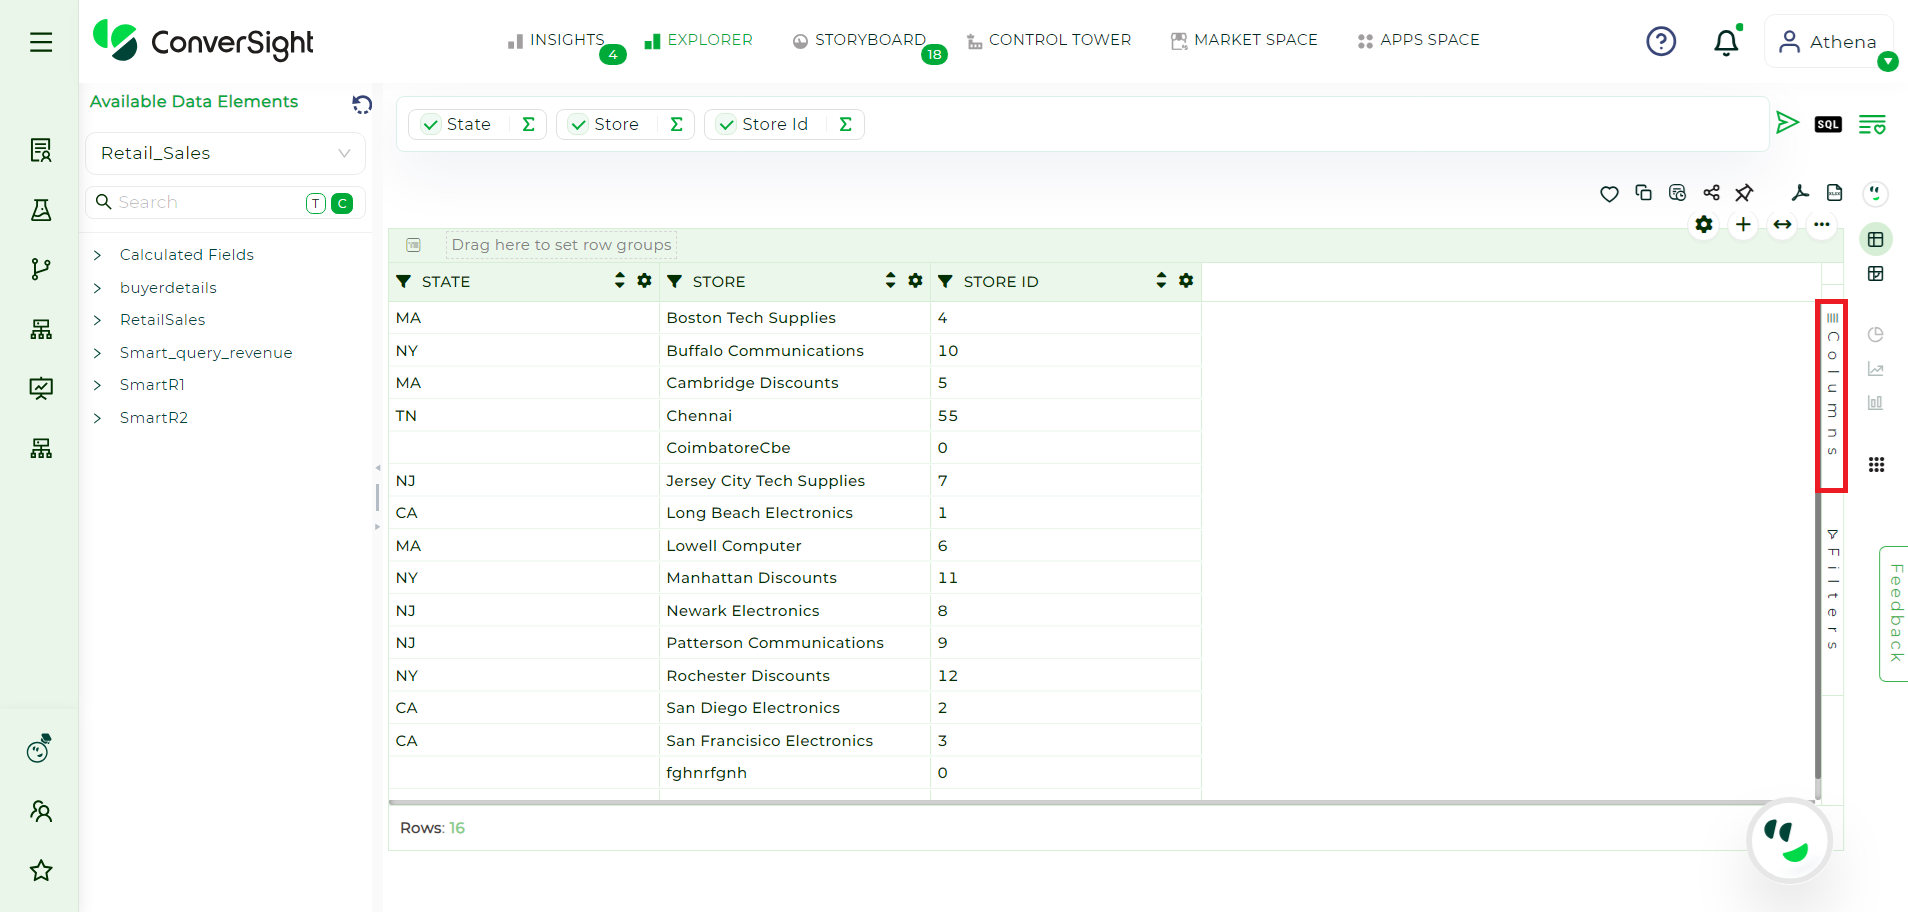
Columns Option#
Step 2: To hide specific columns, uncheck the checkboxes next to the columns you want to conceal. This action will immediately update the view to exclude the selected columns from the report.
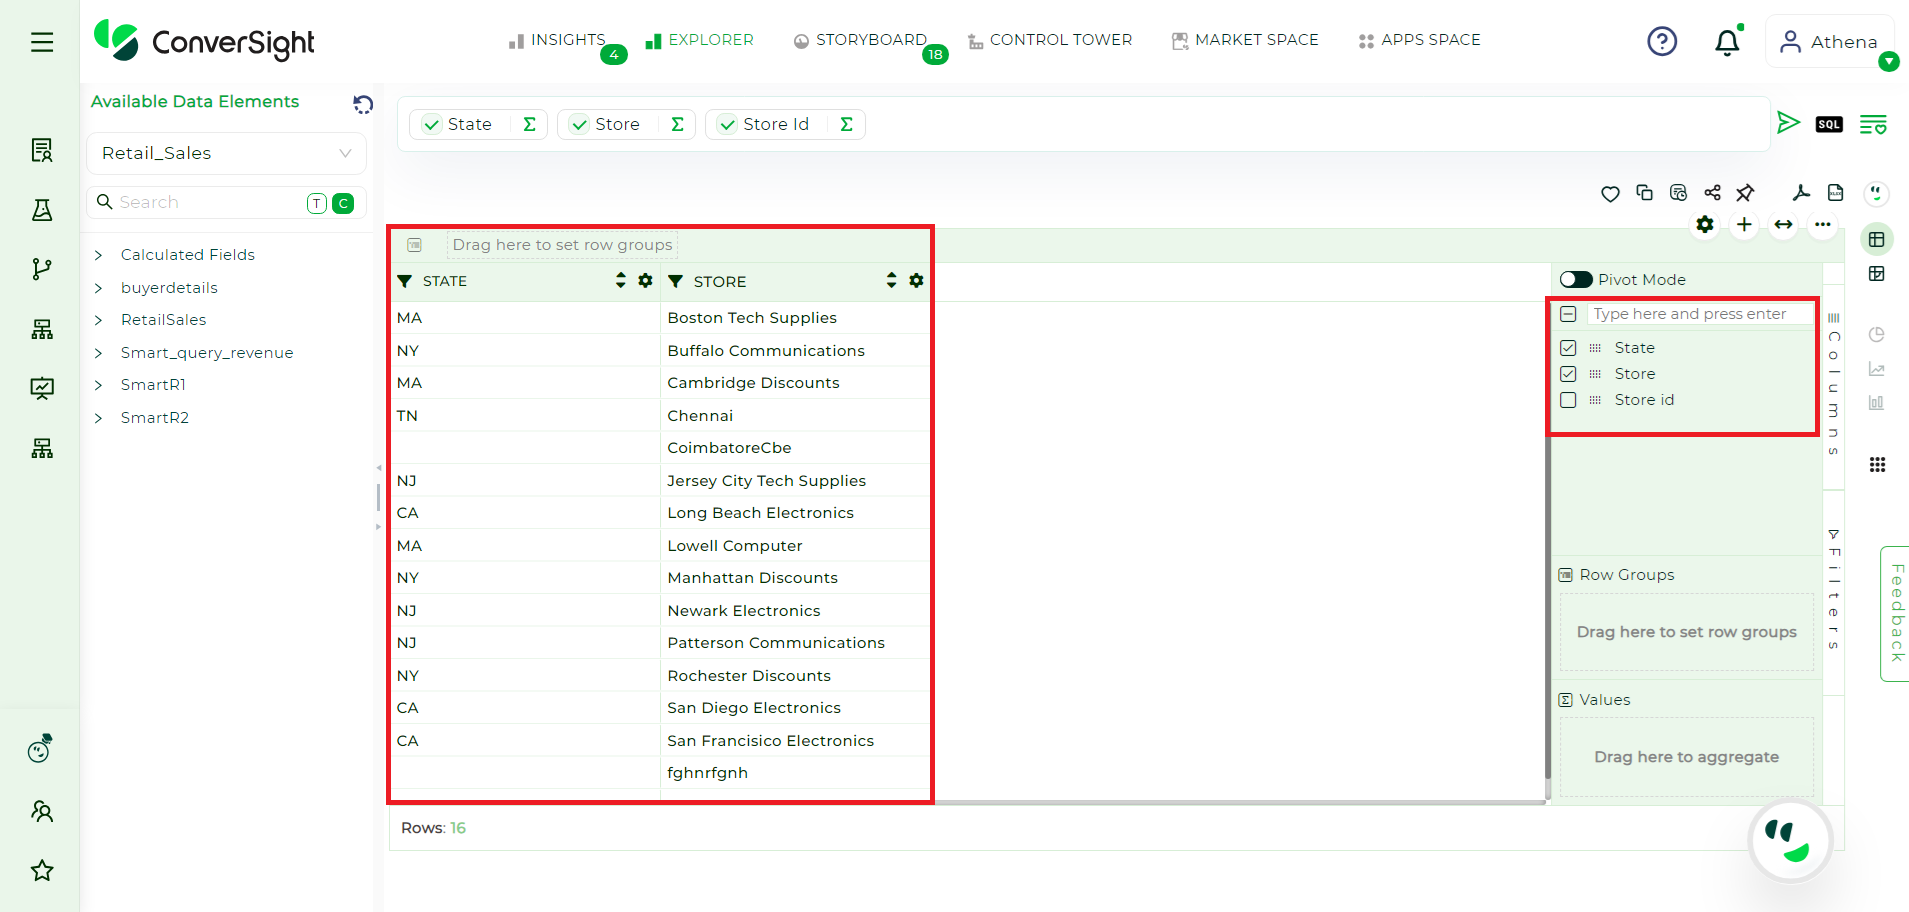
Columns Checkbox#
Step 3: If you wish to save these modifications, you can either add the updated report to your favorites or include it in a storyboard. Note that saving the report in this manner will create a new report, reflecting the changes you have made to the column visibility.
Available Data Elements#
The Available Data Elements feature allows users to refresh the subject areas, including tables, columns and reports, by clicking the Refresh button. This ensures that users have access to the latest information for their analysis or reporting.
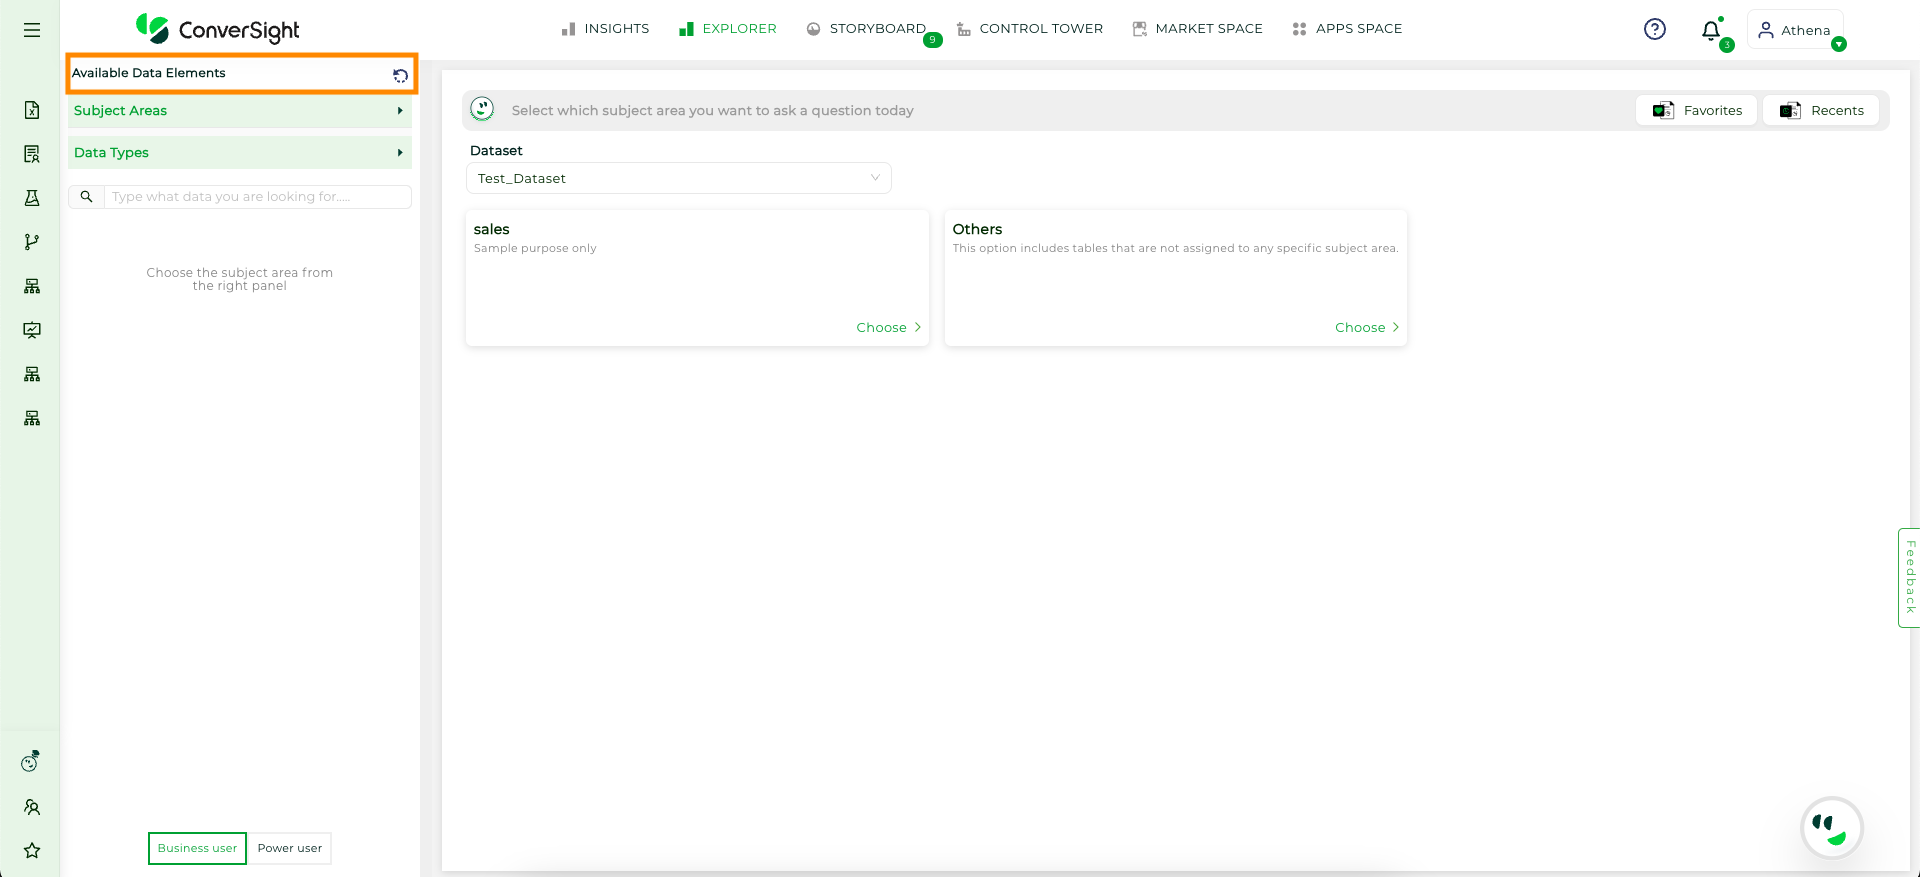
Refresh#
NOTE
Clicking the Trash icon will clear the current query, allowing you to start fresh with new columns and filters.