ConverSight Mobile#
The ConverSight mobile app, available on both Android and iOS, provides a powerful and versatile tool for accessing key data insights and visualizations on the go. It offers seamless functionality across devices, allowing users to explore data through various formats in the Insights section, manage and filter dashboards for detailed analysis, and interact with the AI-powered virtual assistant, Athena, for dynamic data querying. With features designed for efficient navigation and flexible data visualization, the app ensures that users can make informed decisions and stay connected with their data anytime, anywhere.
Installation#
The ConverSight mobile app, named ConverSight.ai, is available for download on both Android and iOS platforms. Users can find it in the Google Play Store for Android devices and in the Apple App Store for iOS devices.
Setup#
After opening the ConverSight app, users have two options to get started:
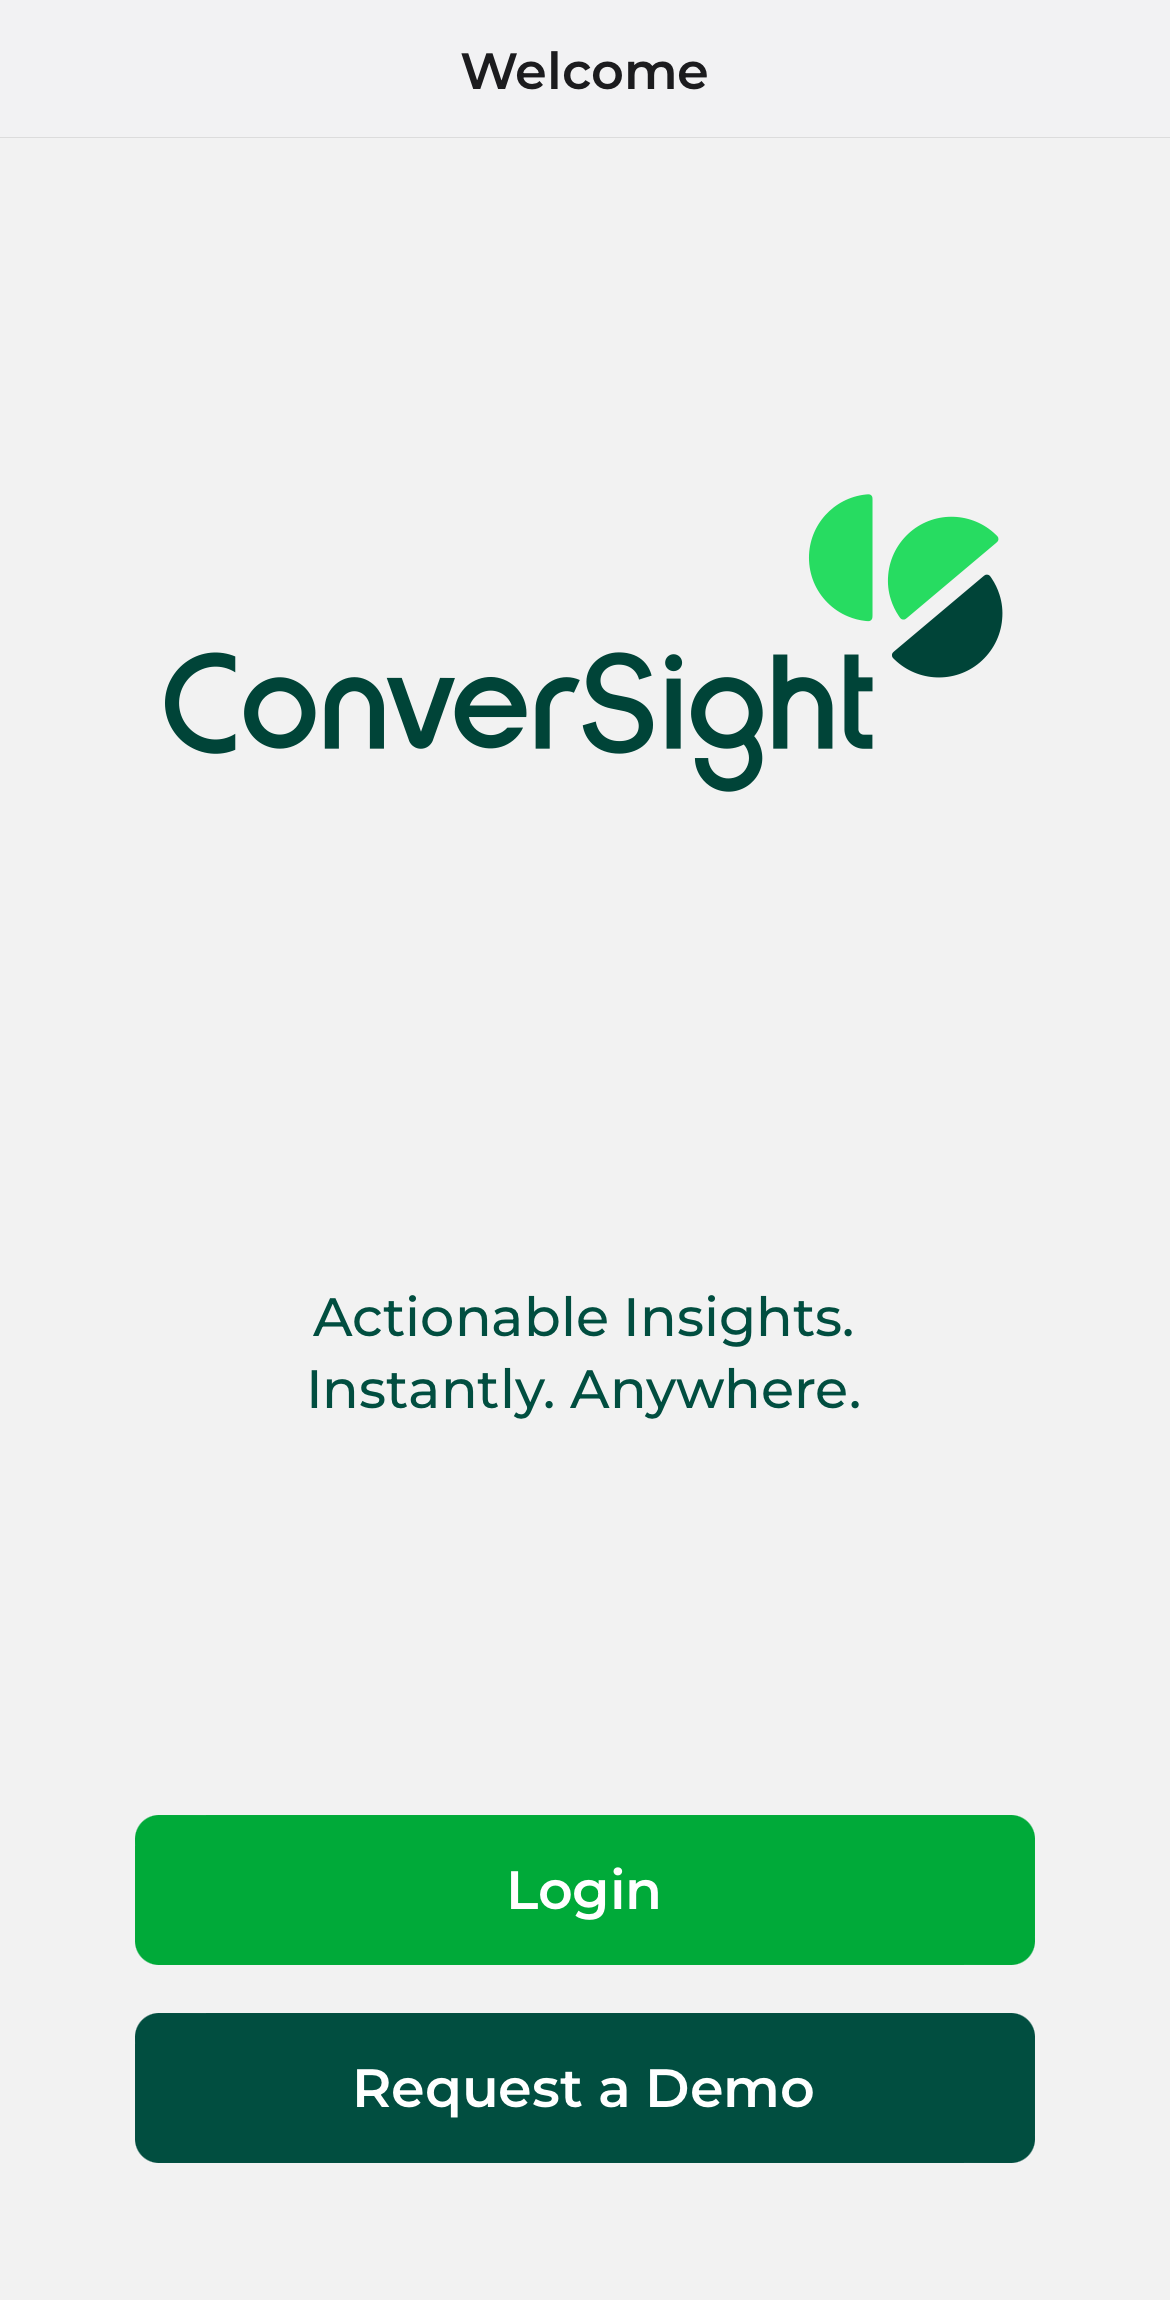
ConverSight Mobile App#
Login with ConverSight Credentials: If you are an existing user, click on Login. Enter the email address associated with your ConverSight account, select your organization, and input your password. Once you’ve entered the details, click Login to access the app.
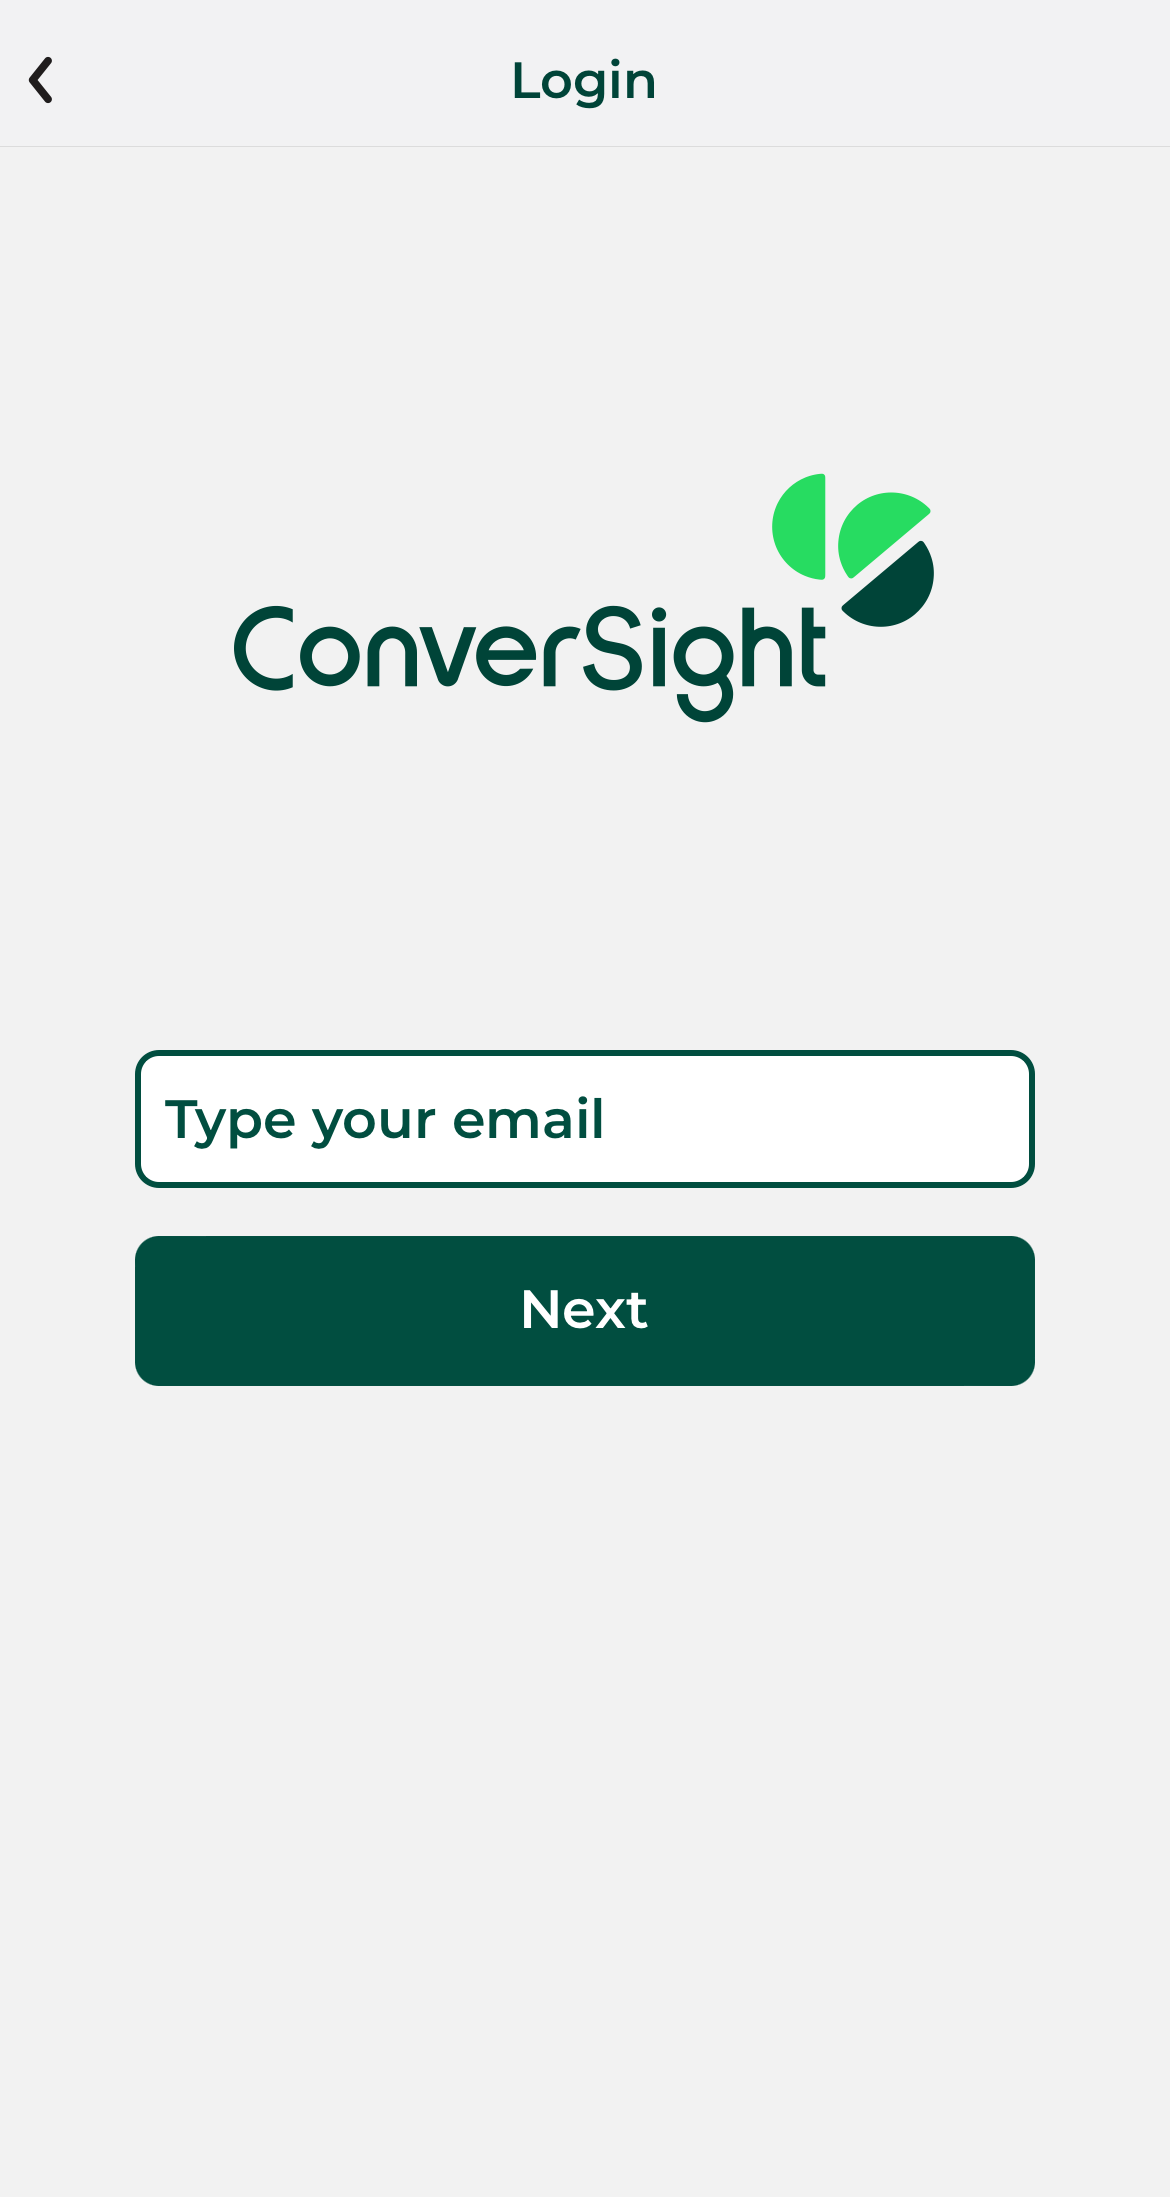
Login#
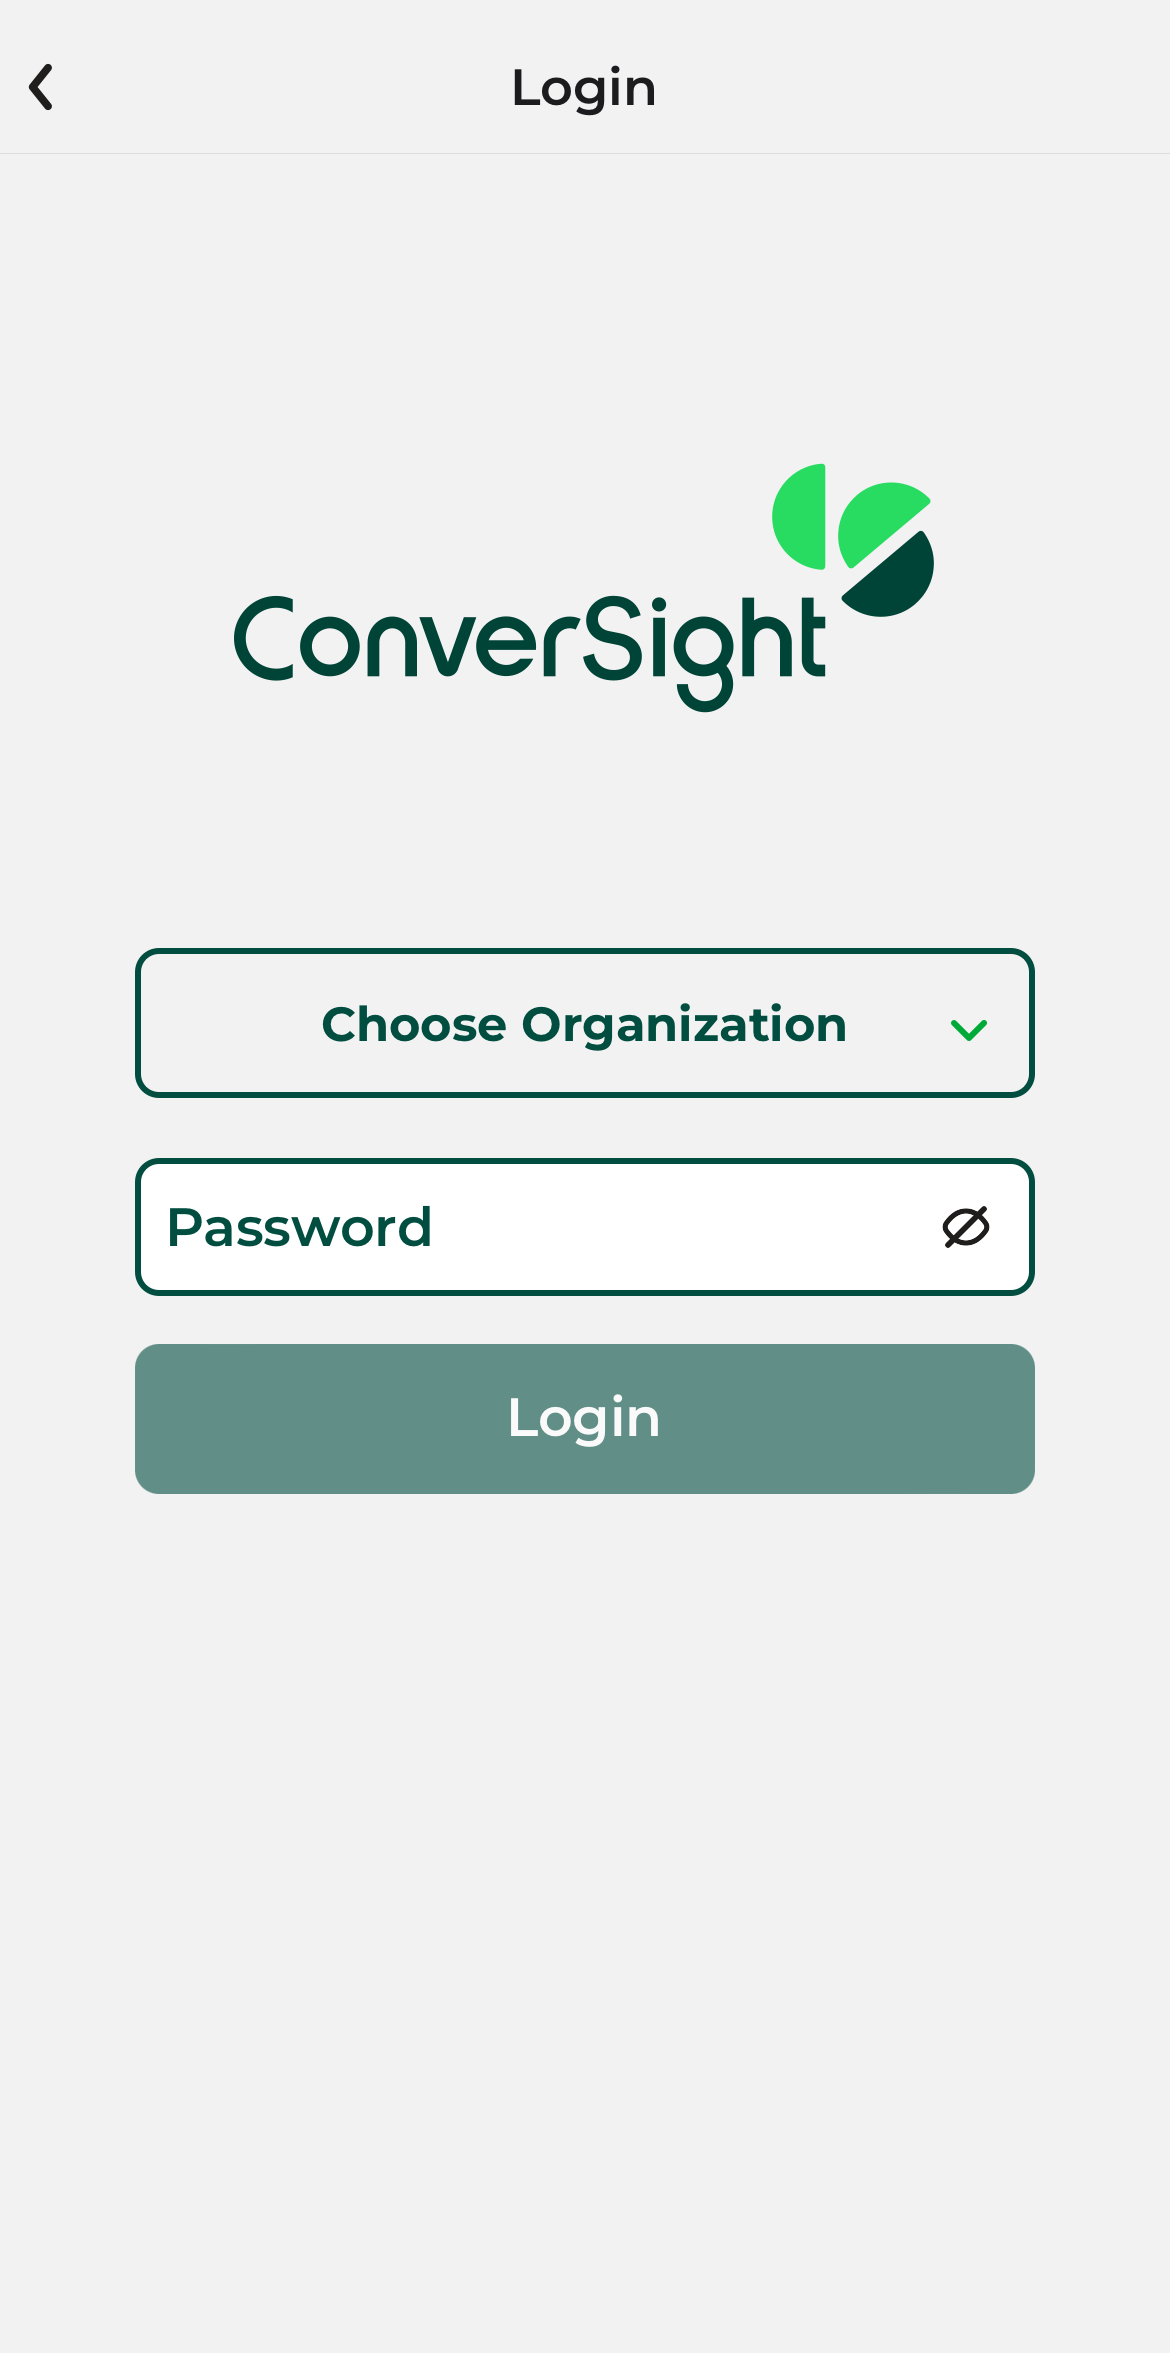
Login Password#
Request a Demo: If you would like a demo of how to work with ConverSight, simply click on the Request a Demo option. You will be prompted to fill out a form with your relevant details. Once the form is completed, click Request a Demo, and one of our representatives will reach out to you shortly to assist and guide you through the demo process.
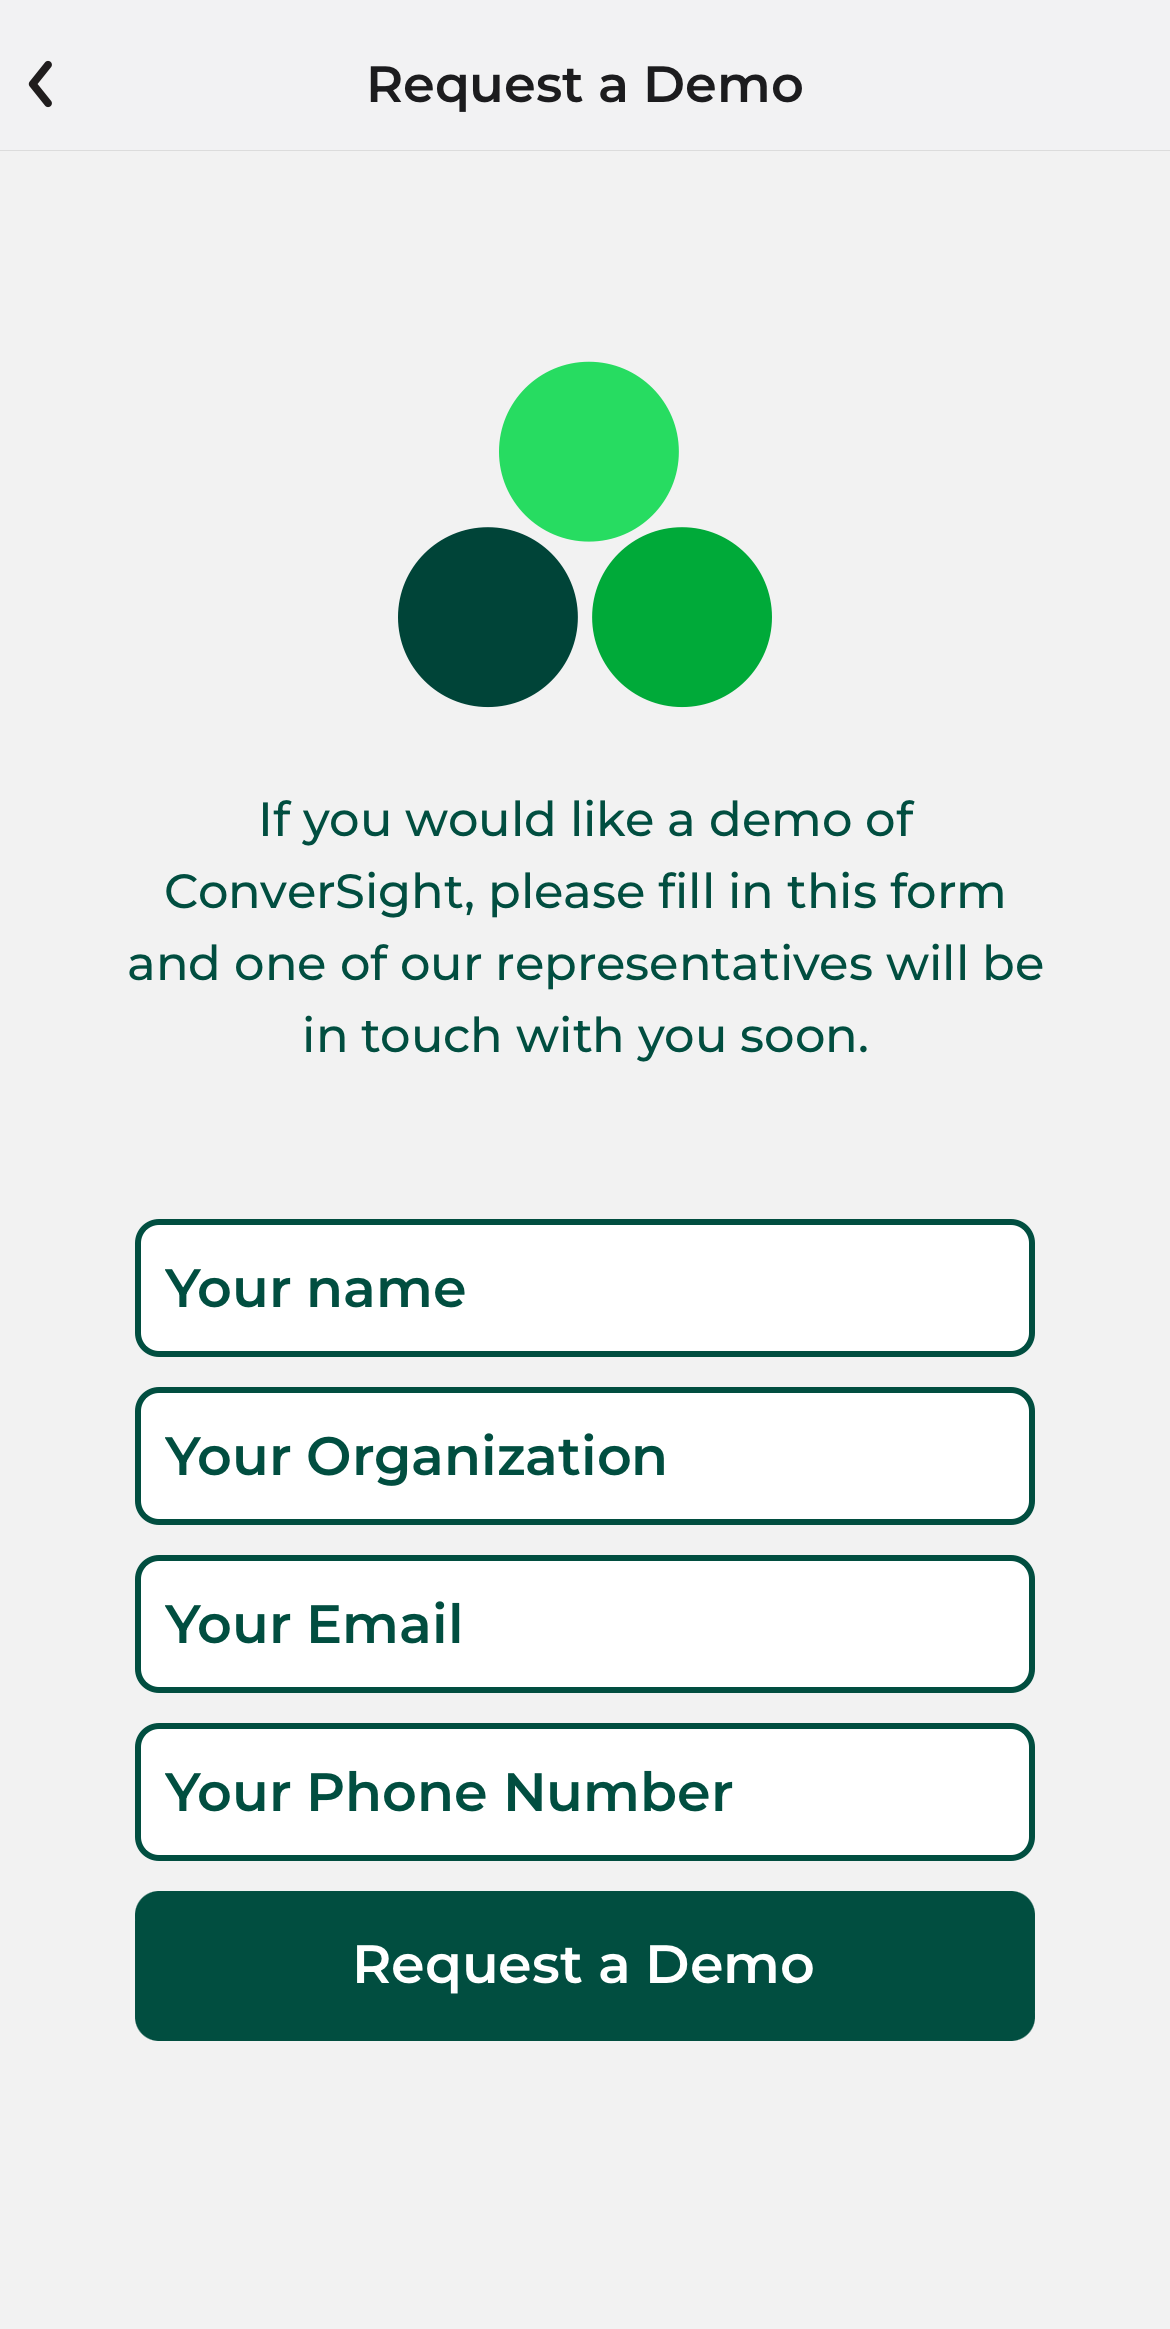
Request a Demo#
After logging into the app, you will find a sidebar menu on the main screen. This sidebar provides easy navigation and access to various features within the app:
Insights
Dashboards
Request a Demo
Sign Out
Sidebar Menu#
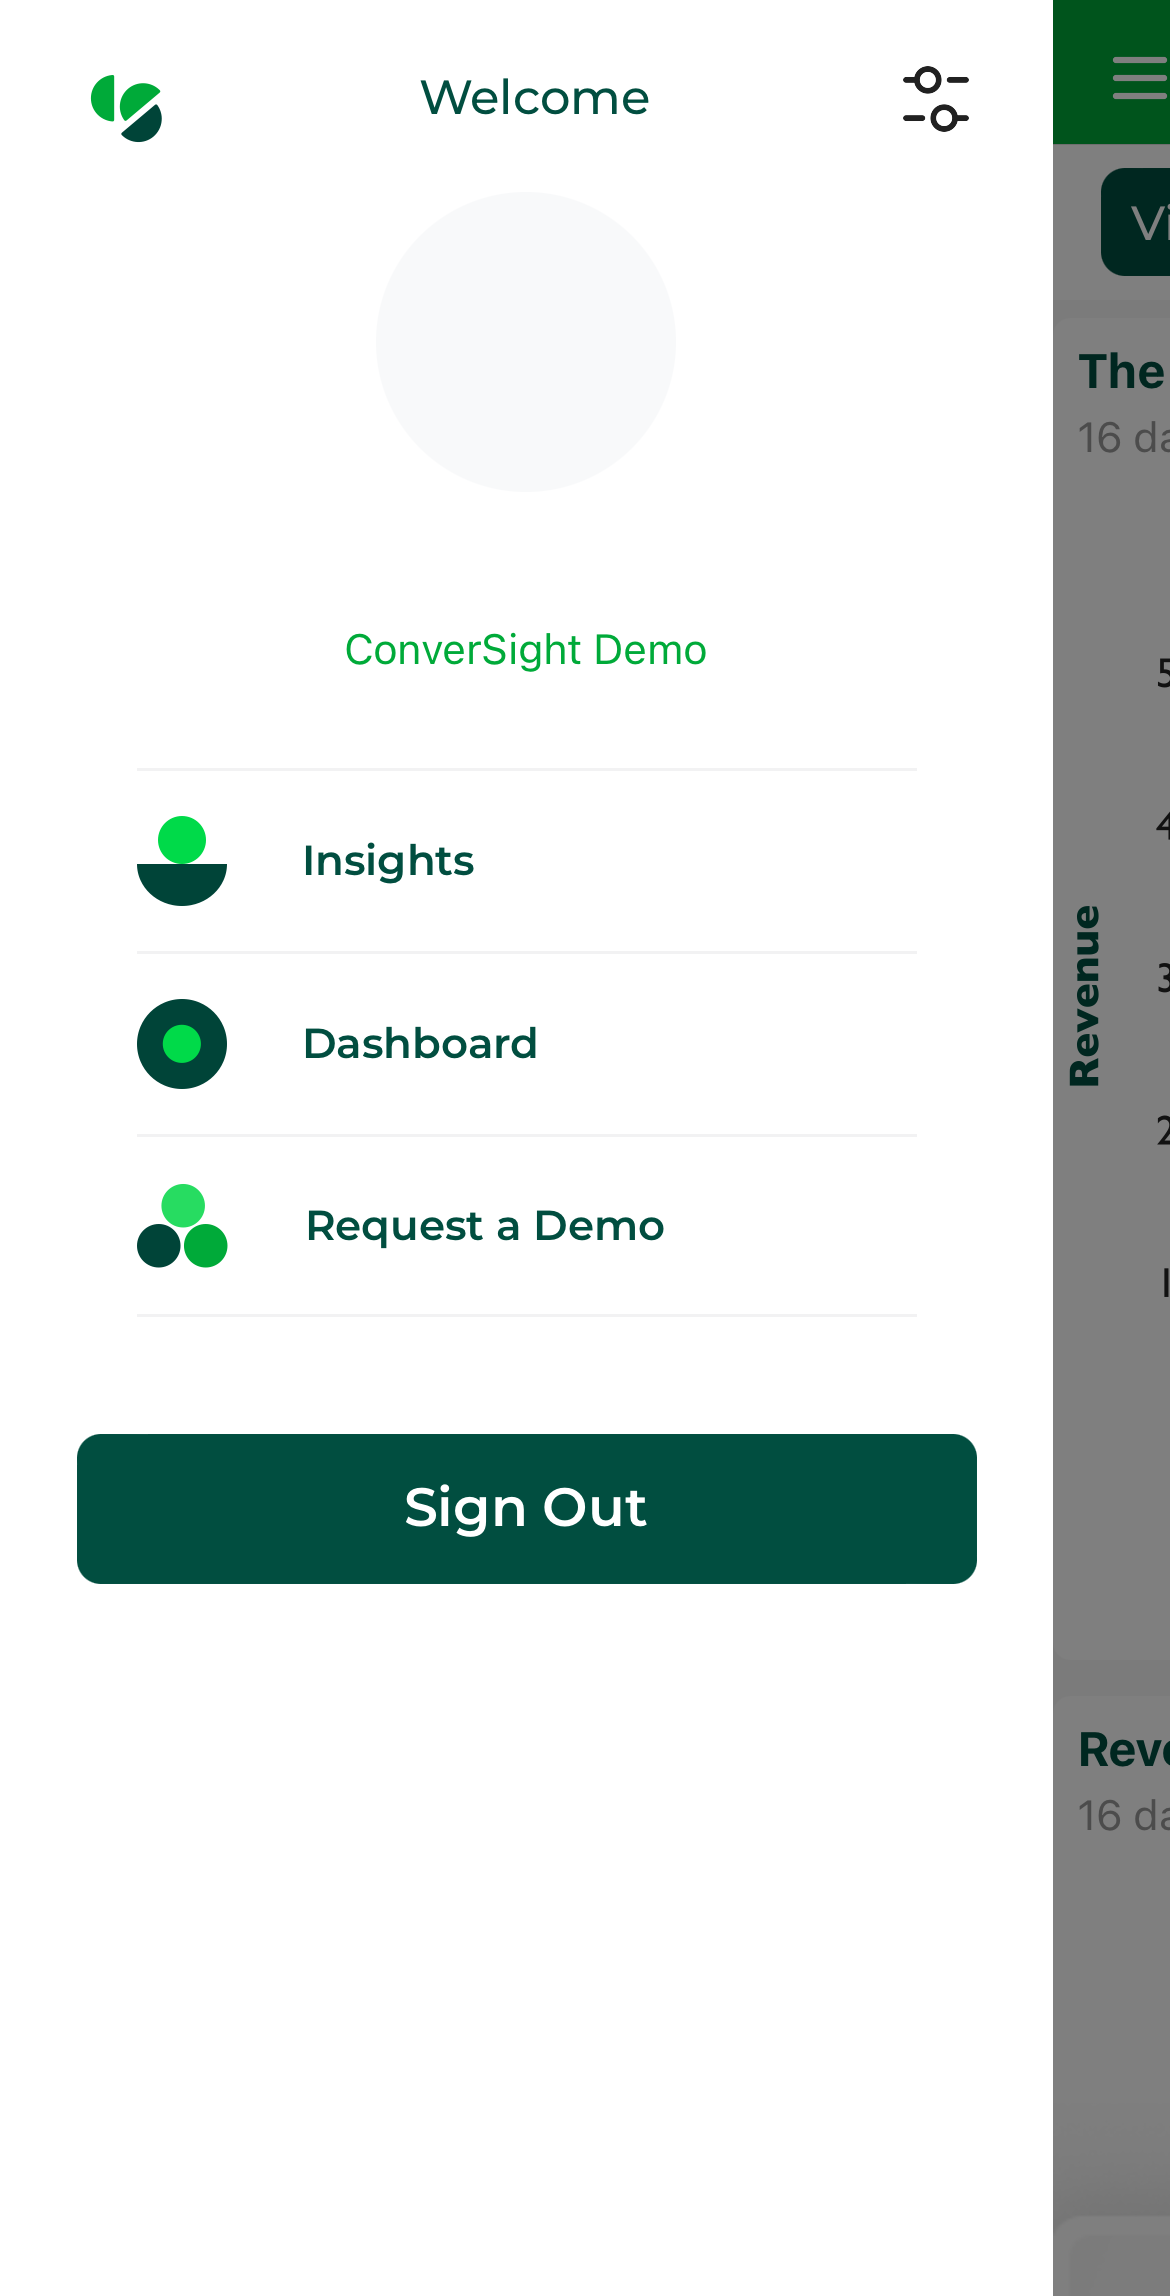
Sidebar Menu#
Additionally, the sidebar menu includes a Profile Settings section where you can view your personal information, including your name, email, mobile number and designation. This central location ensures that you have easy access to essential features and your account details.
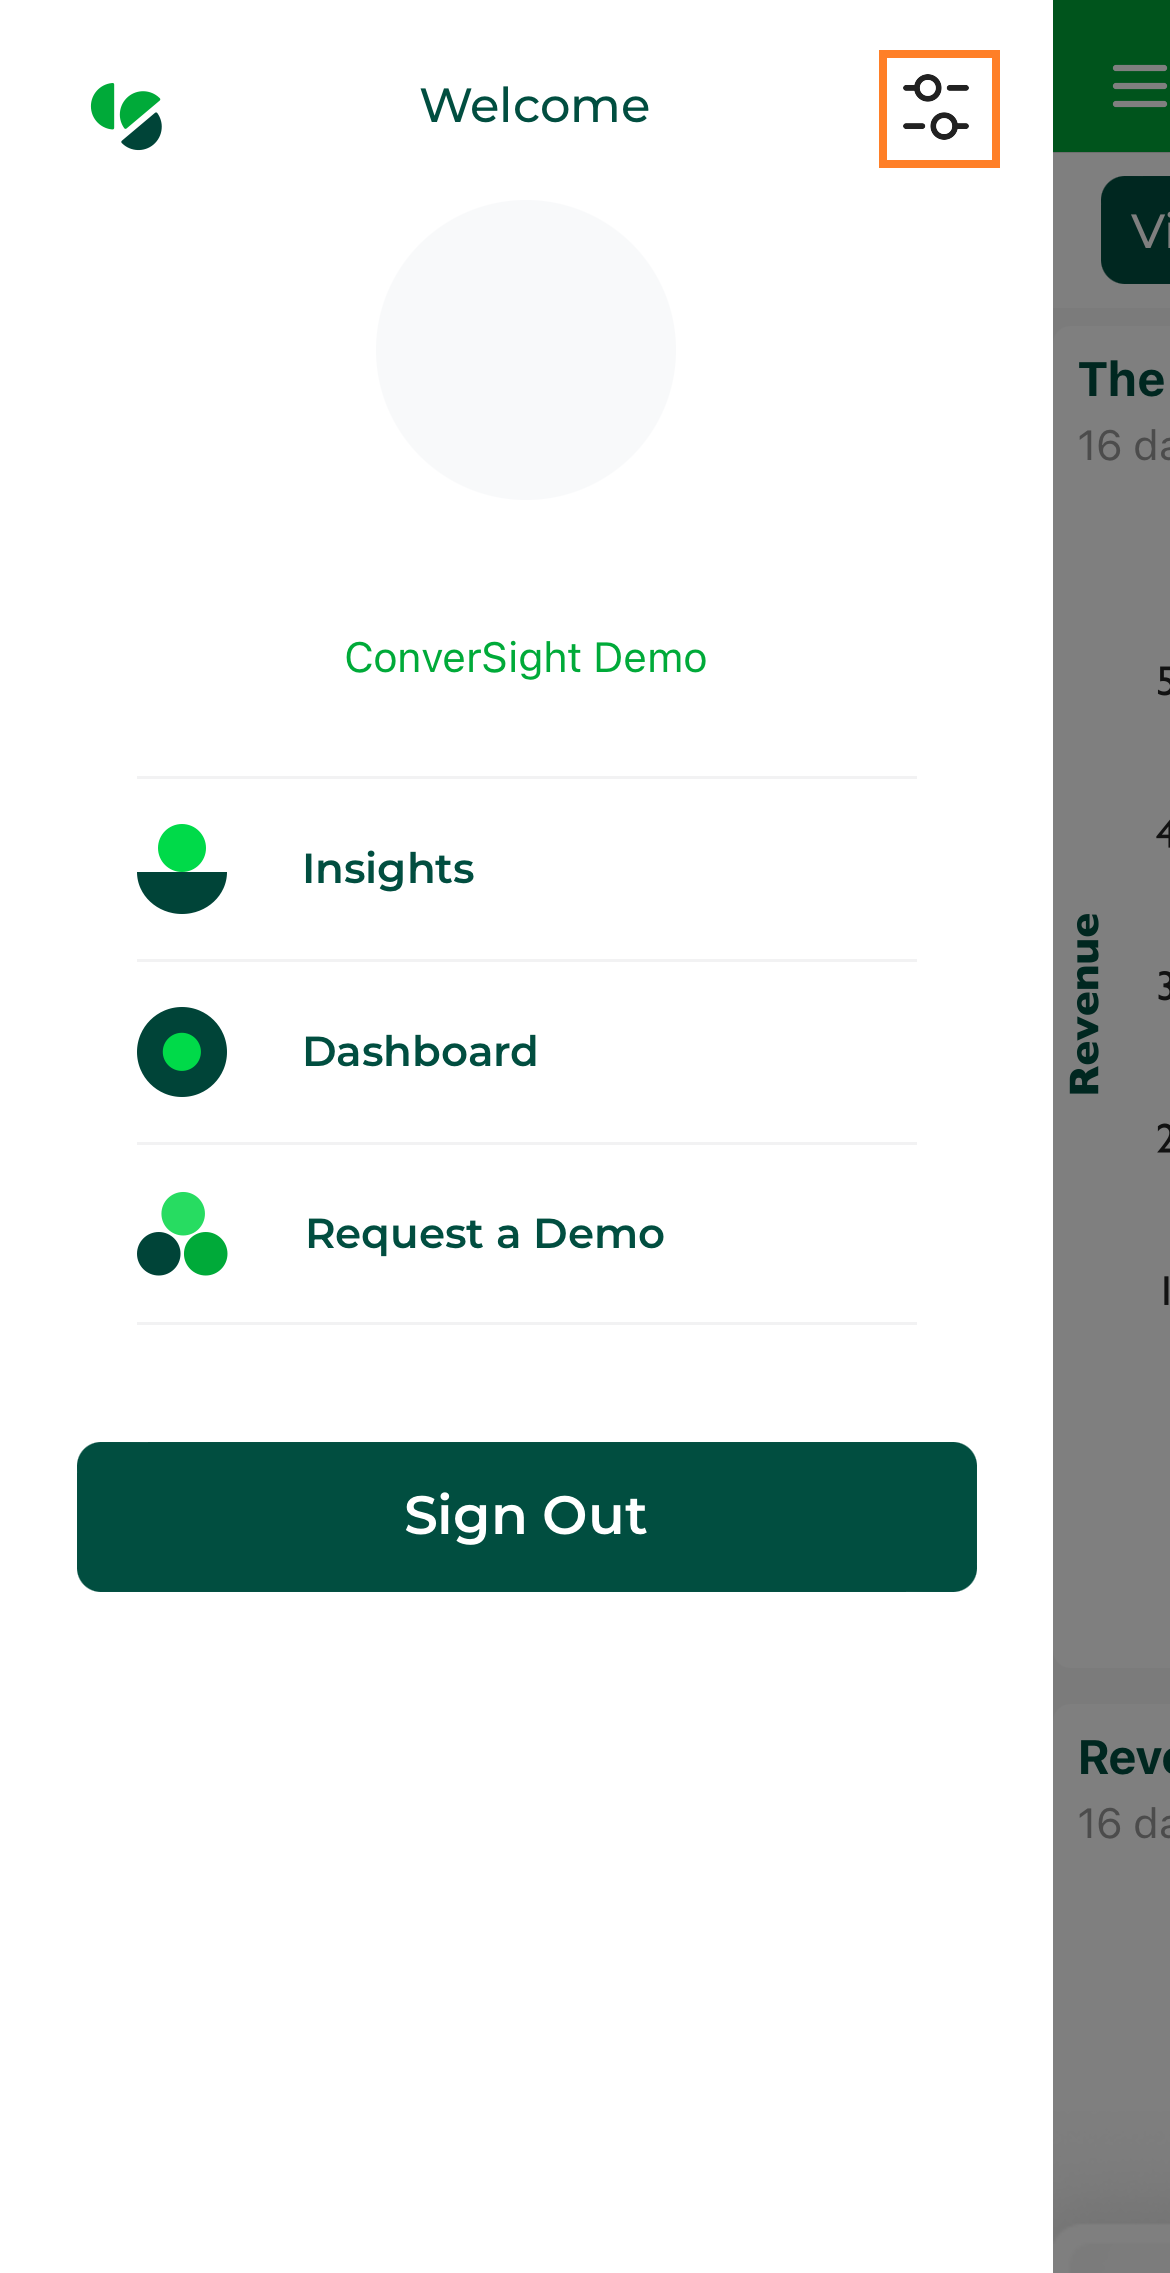
Profile Settings#
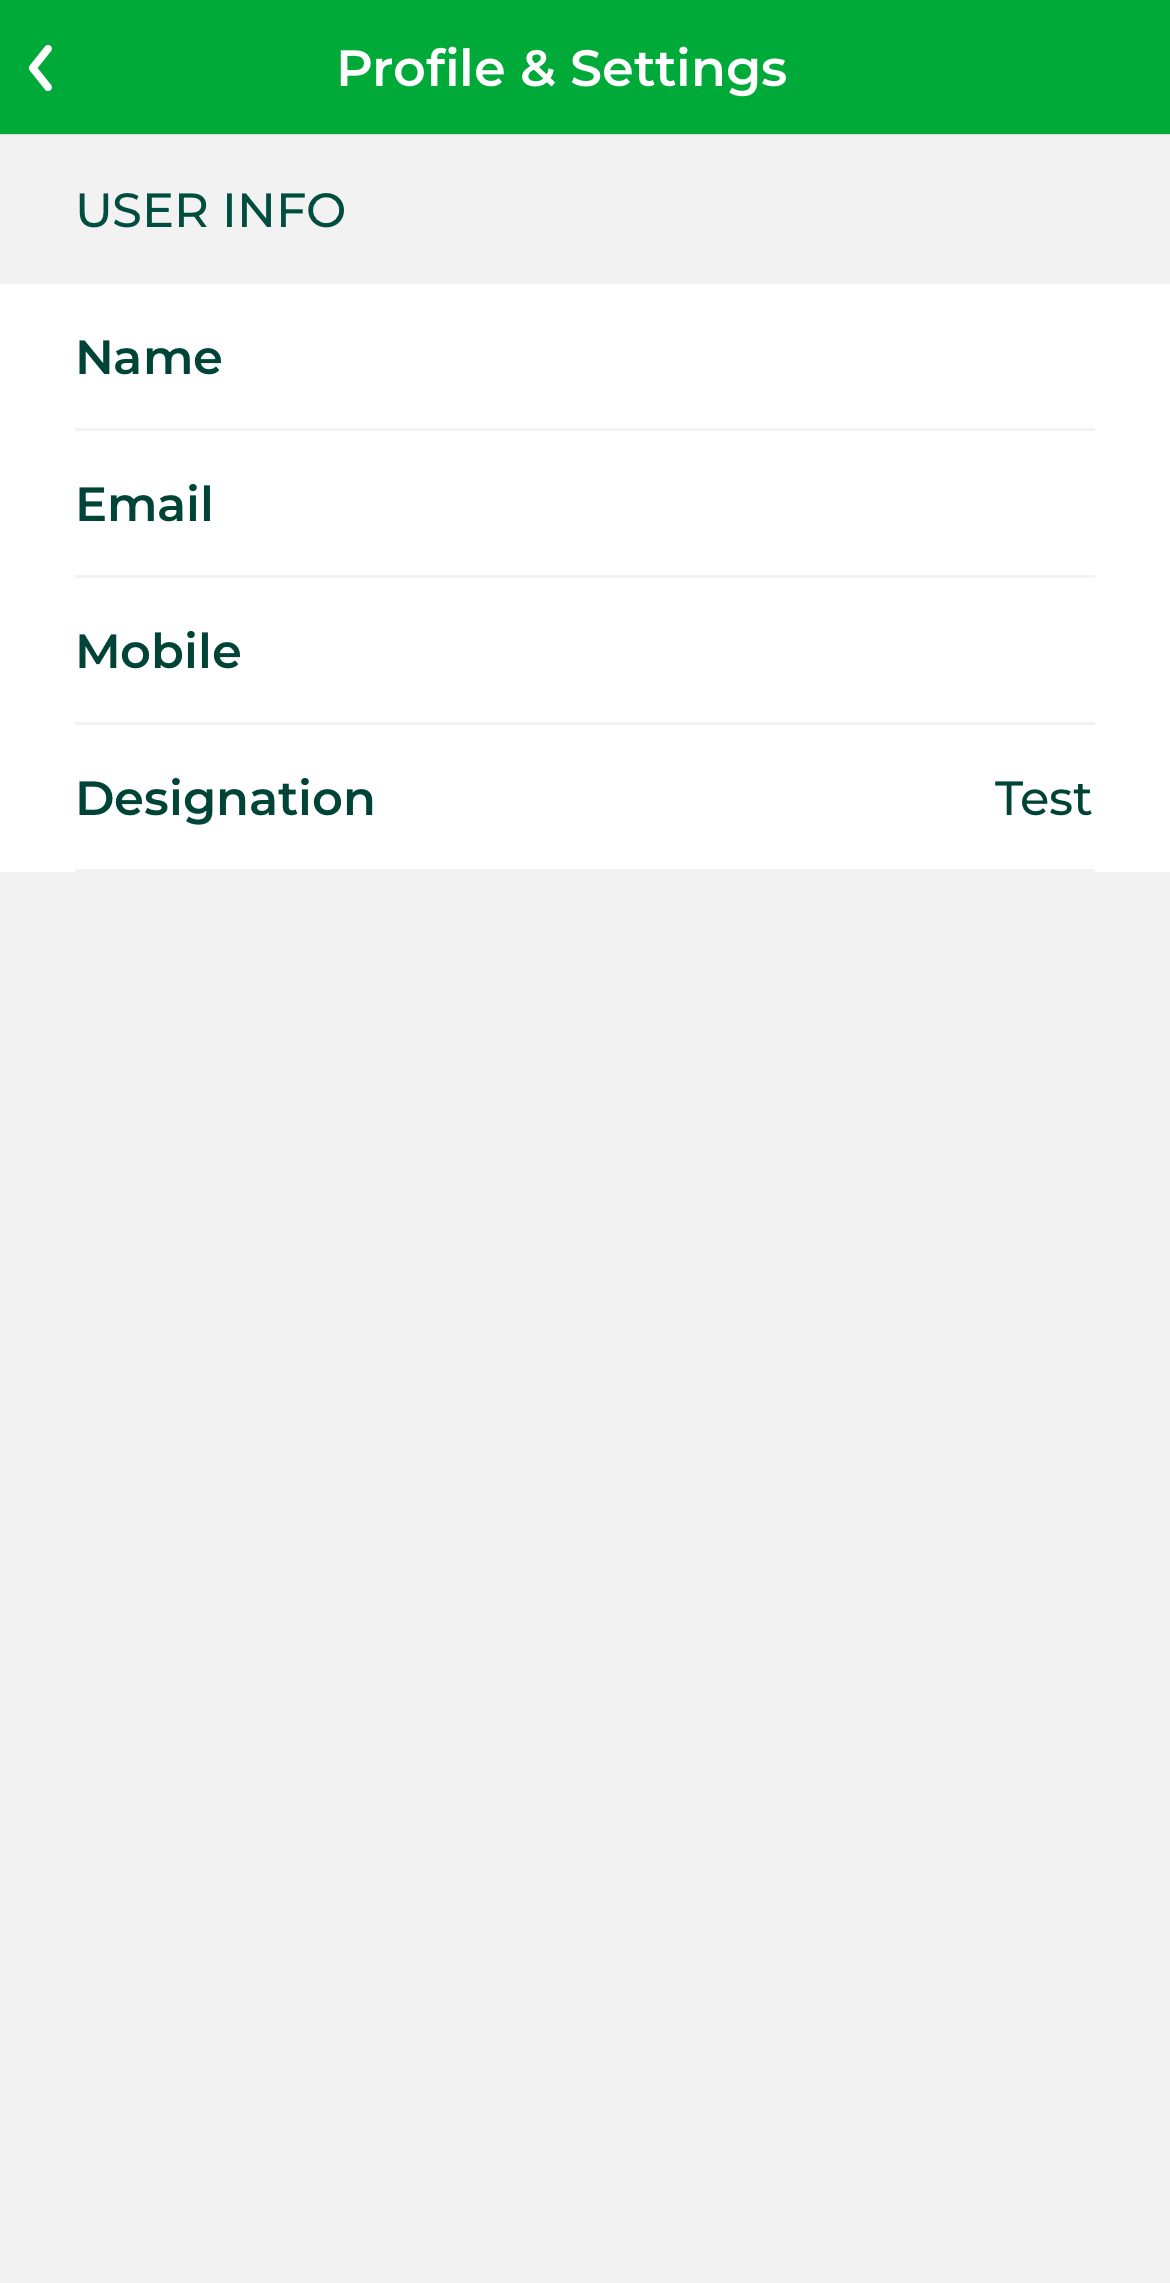
User Profile#
Insights#
The Insights section provides a comprehensive view of key data points, offering users the ability to explore and analyze insights in various formats, tailored to their preferences and needs. The following are the steps in insights:
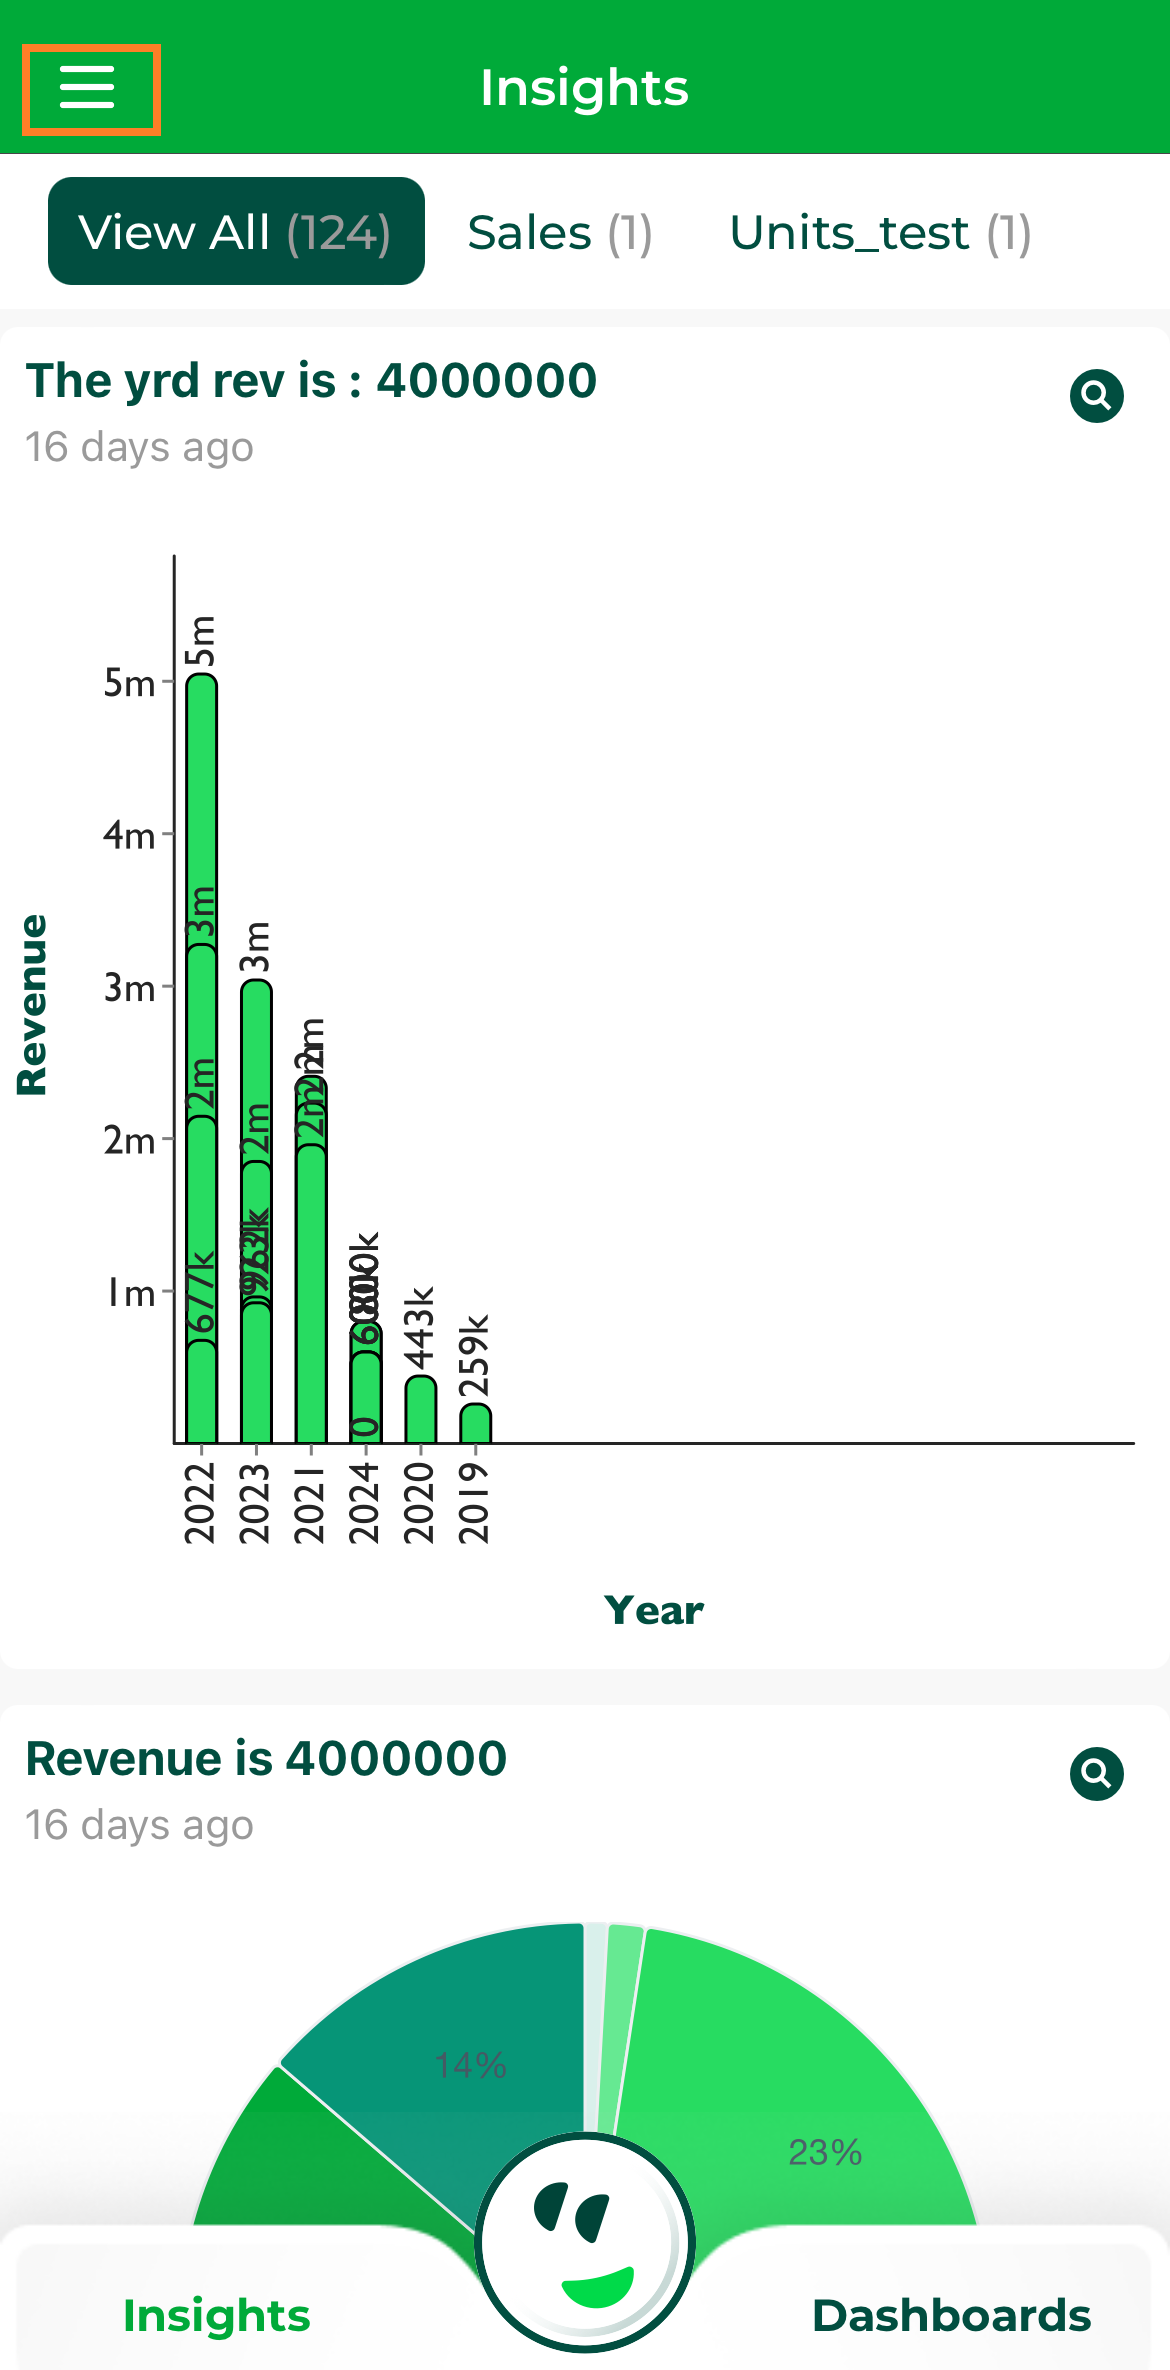
Step 1: Navigate to the Insights section.
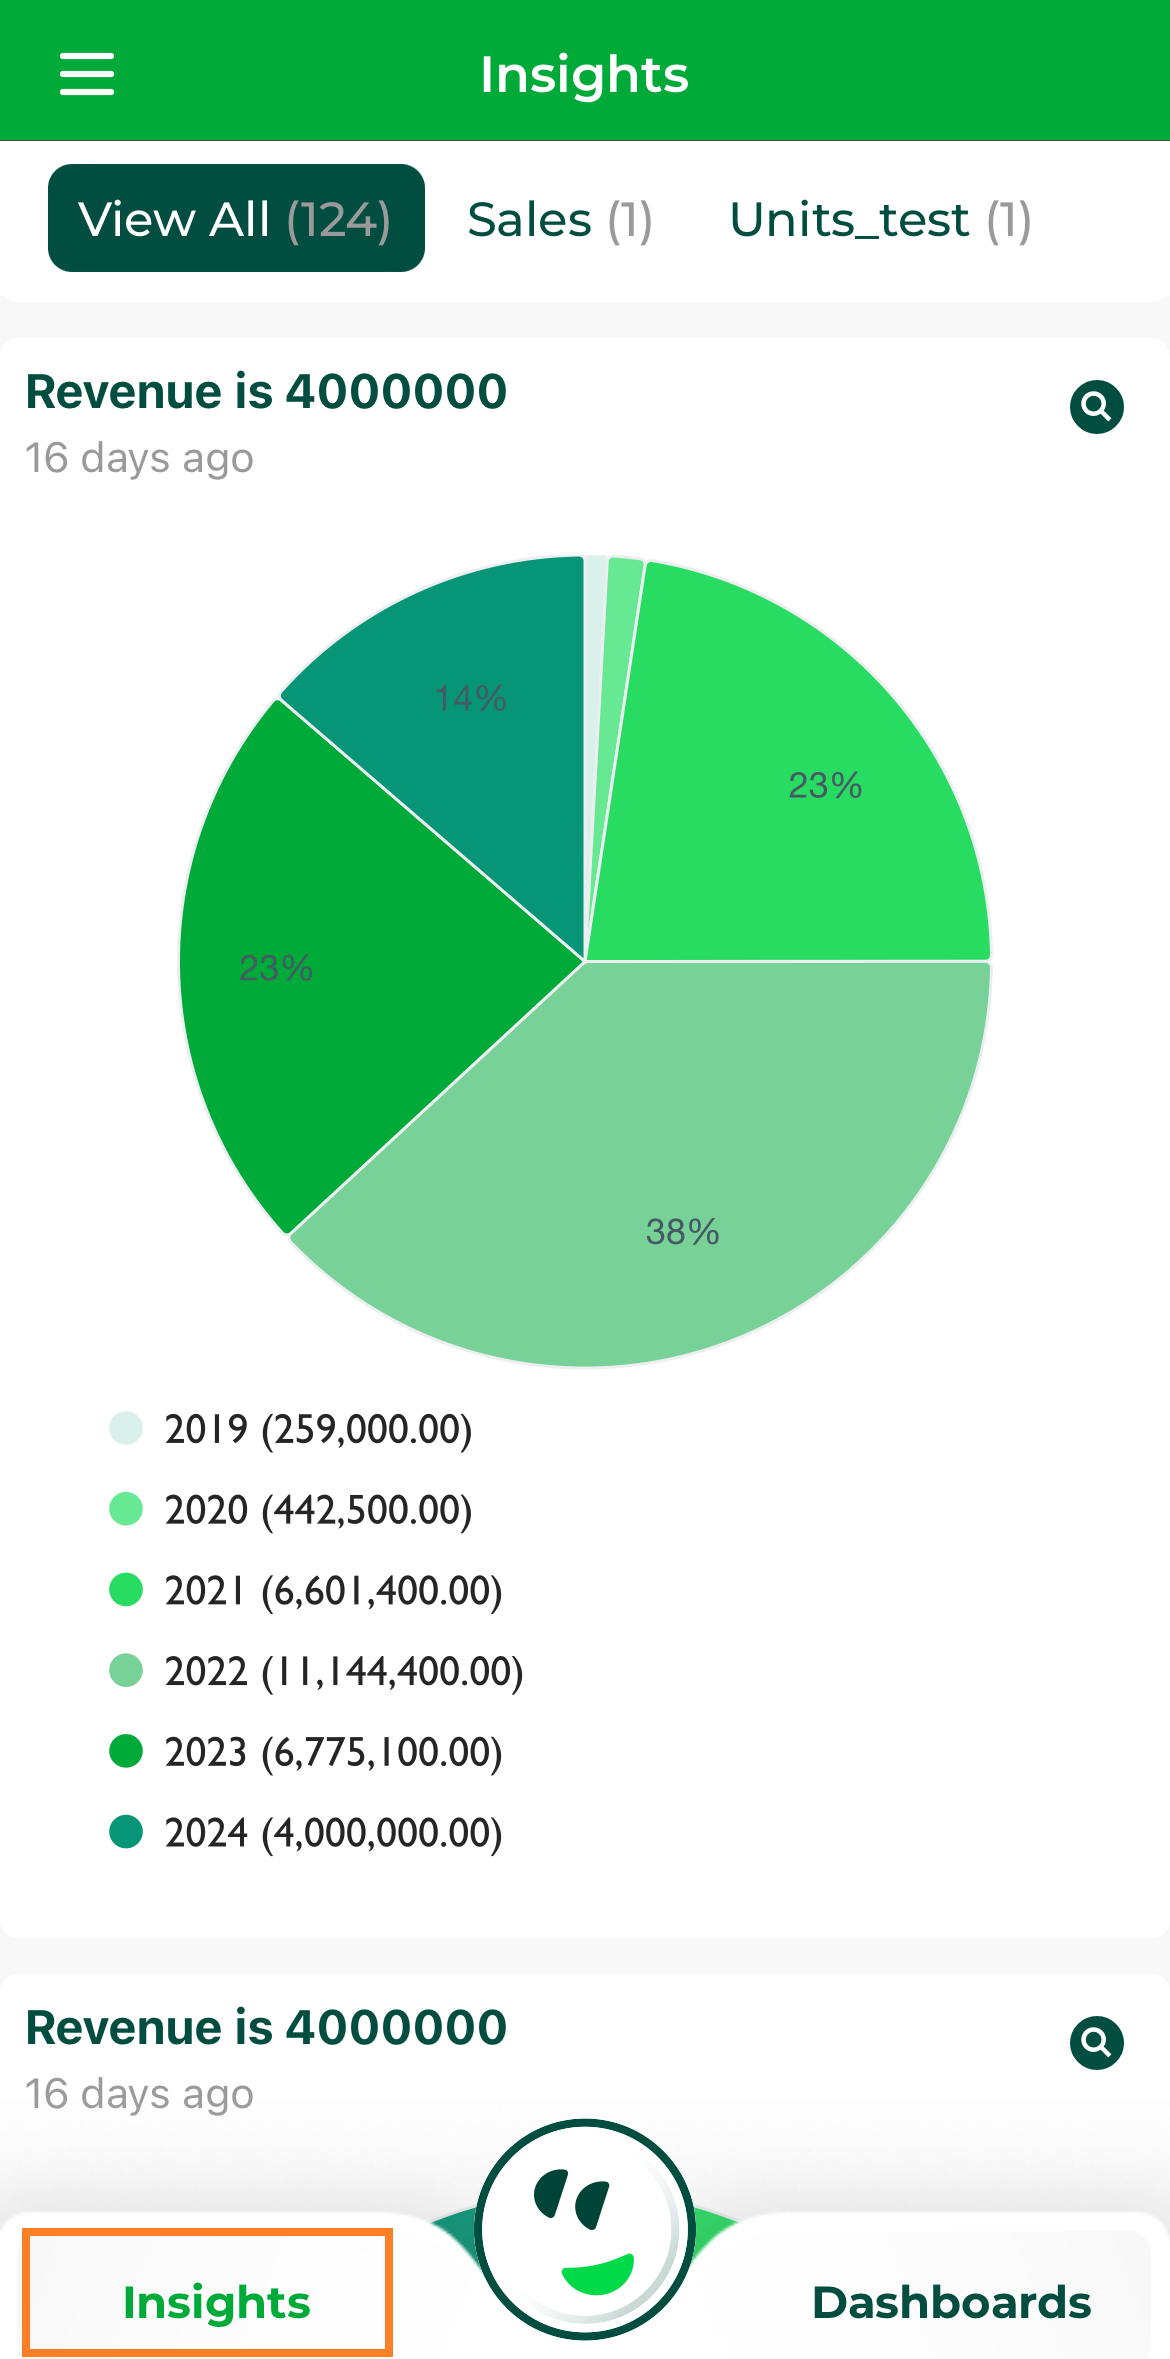
Insights#
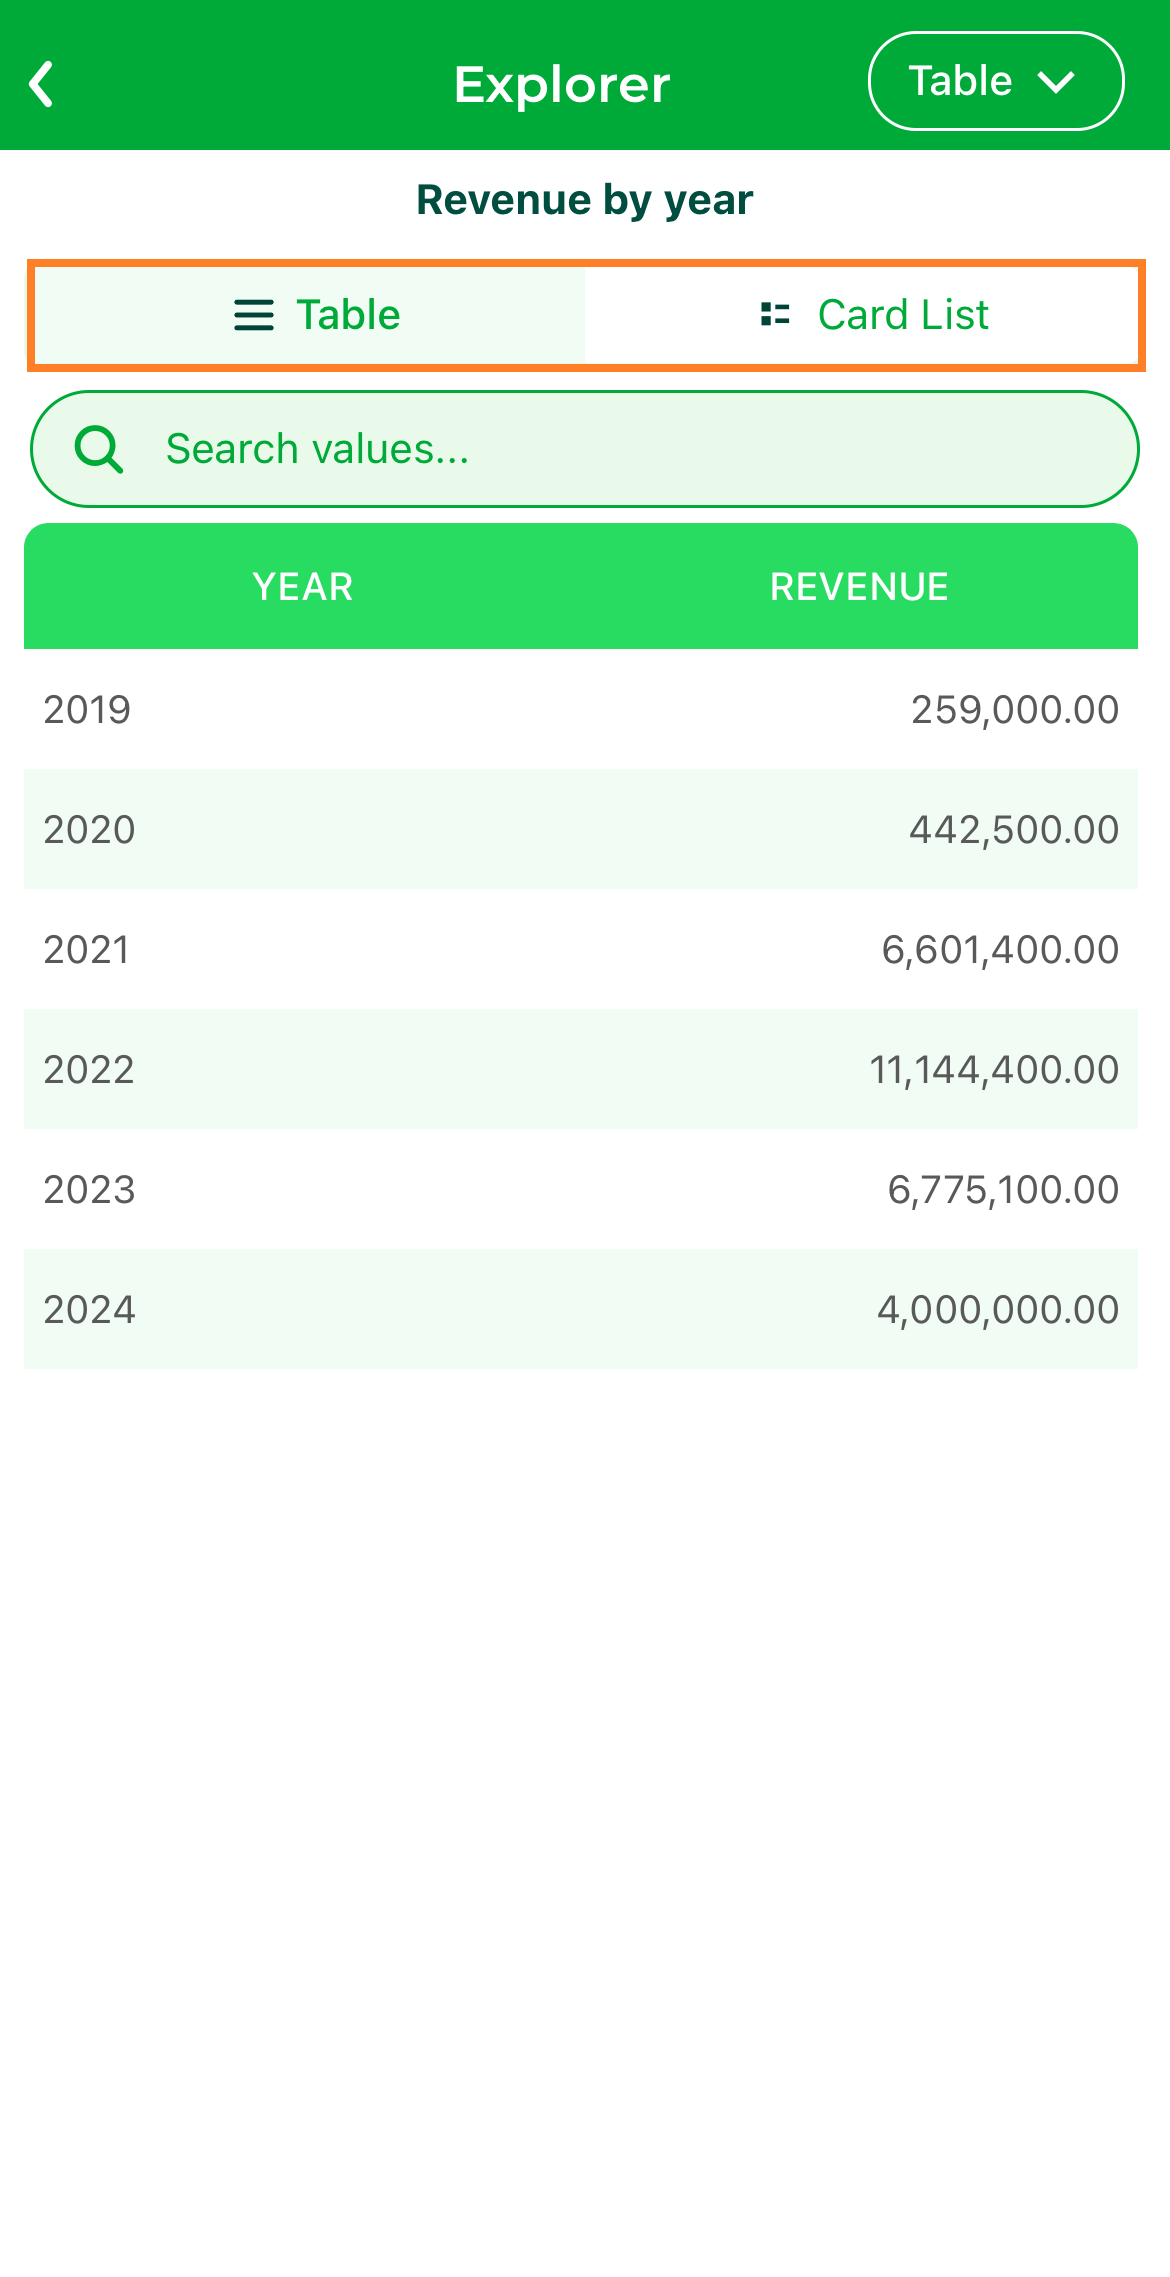
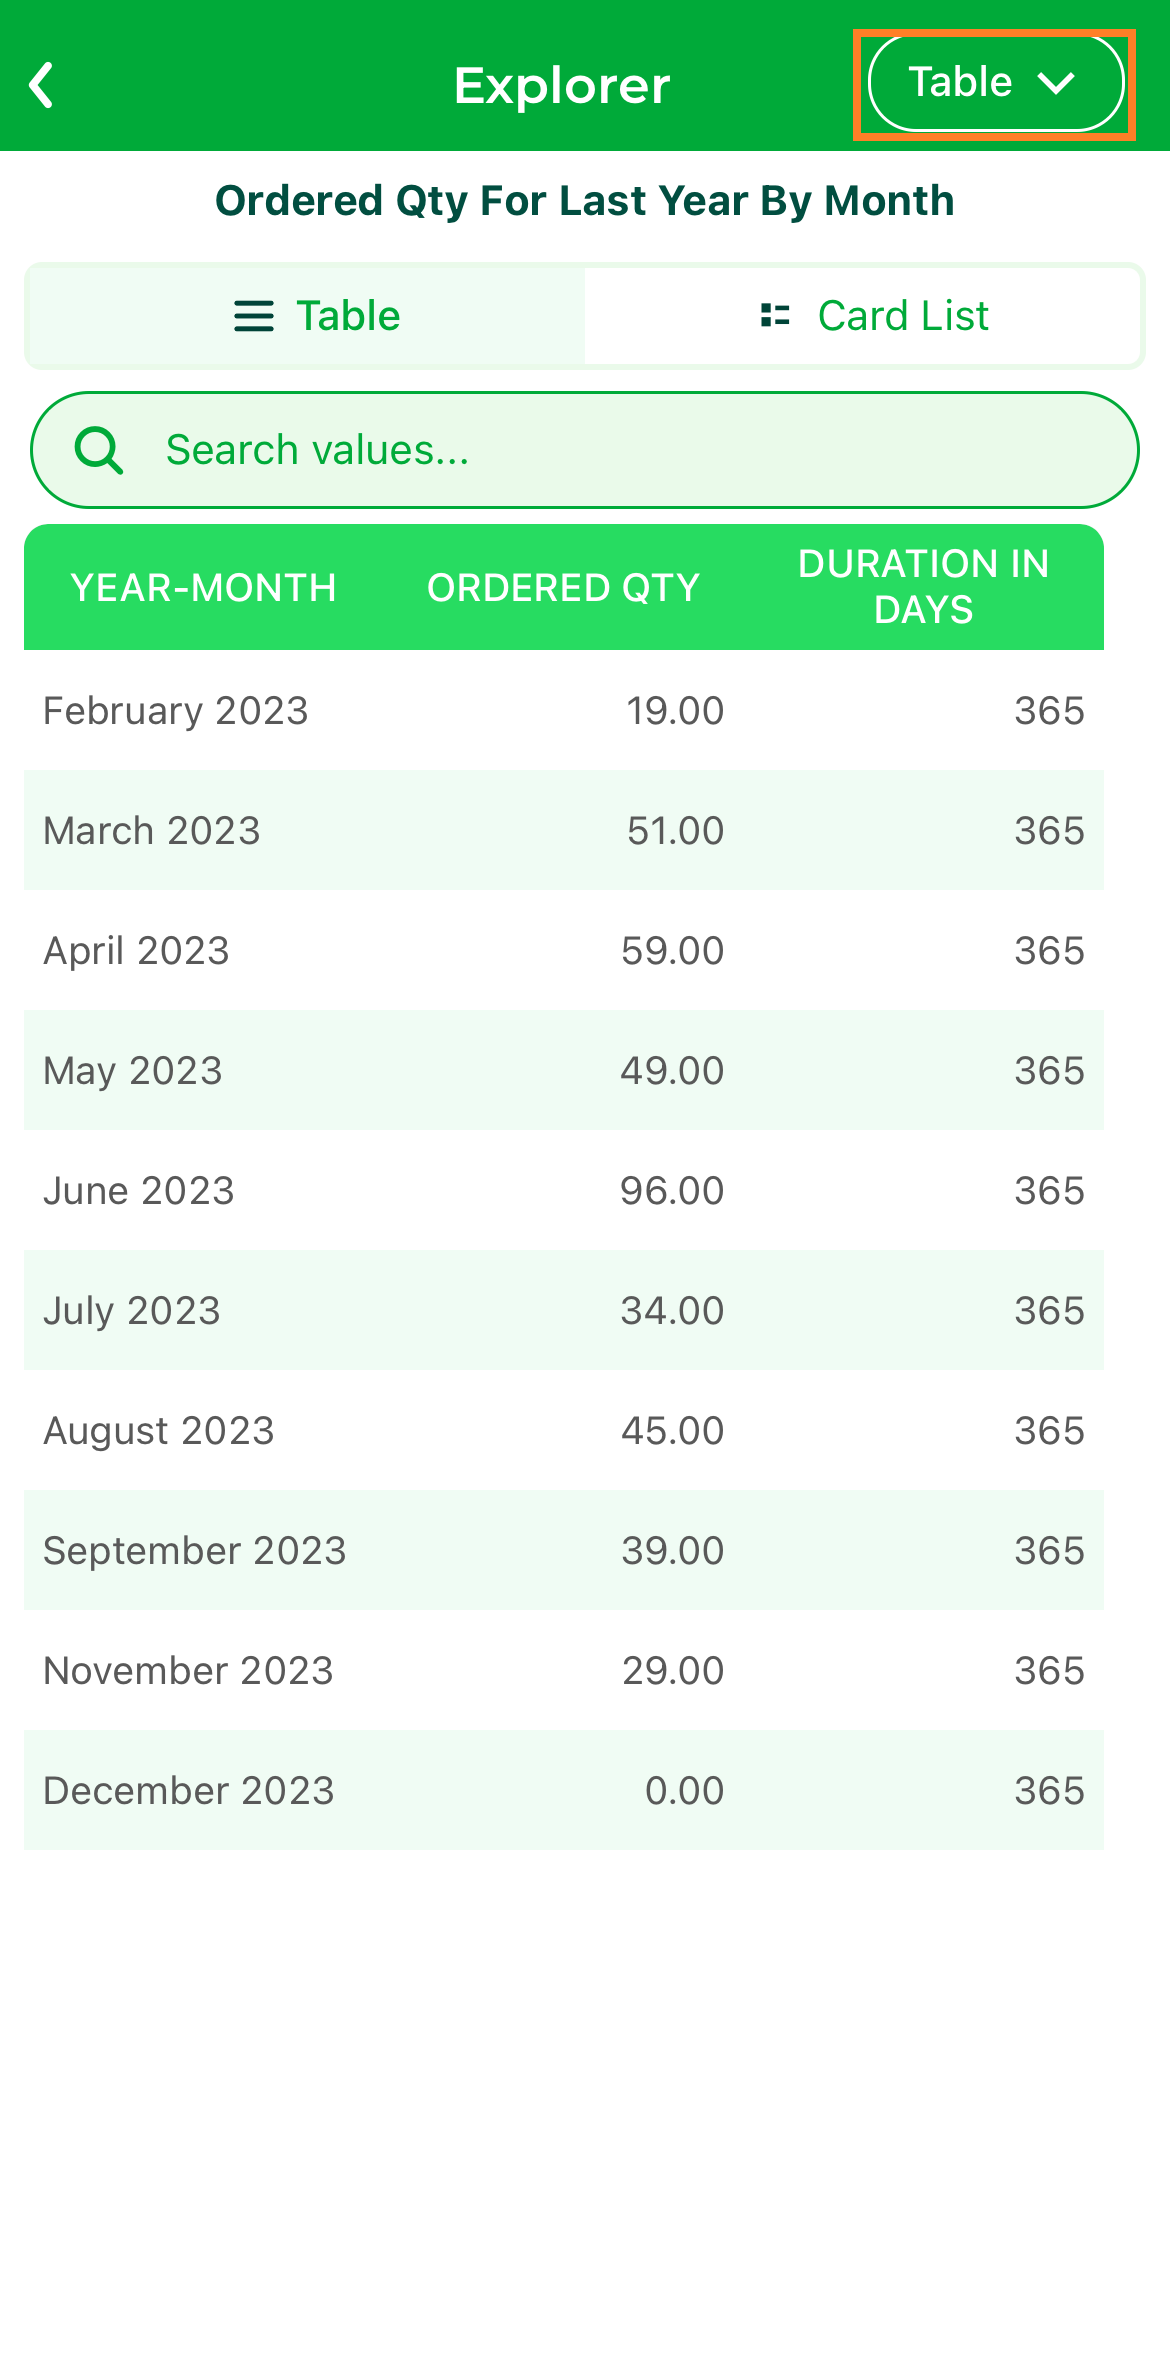
Step 2: Users can click on the Explore button to display the data in a table view by default. If preferred, switch to a card list view for a different format.
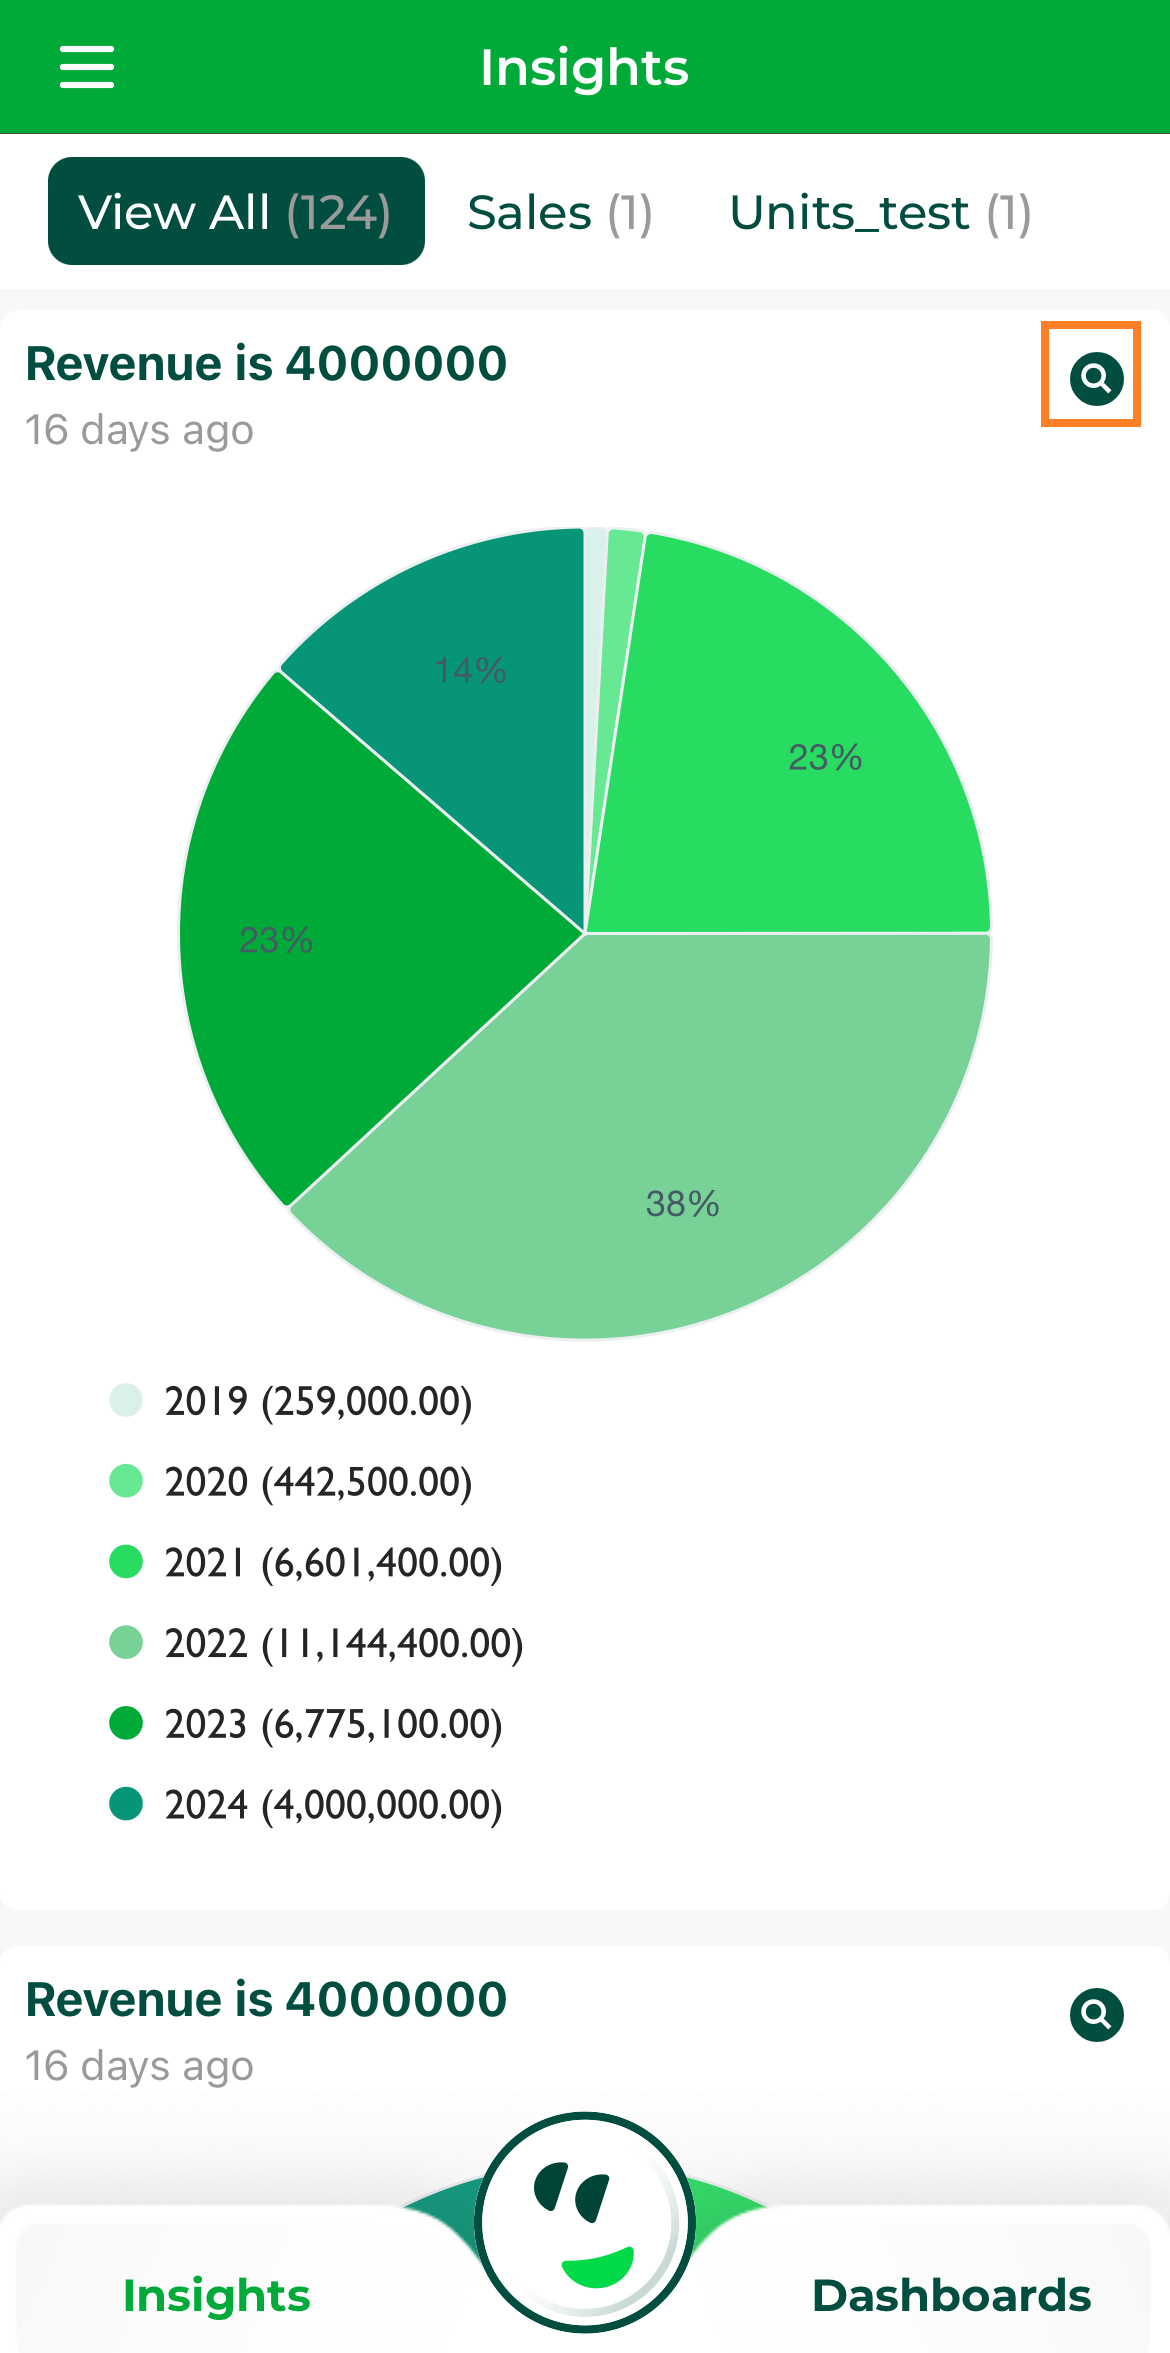
Explore Button#
Explore Insights#
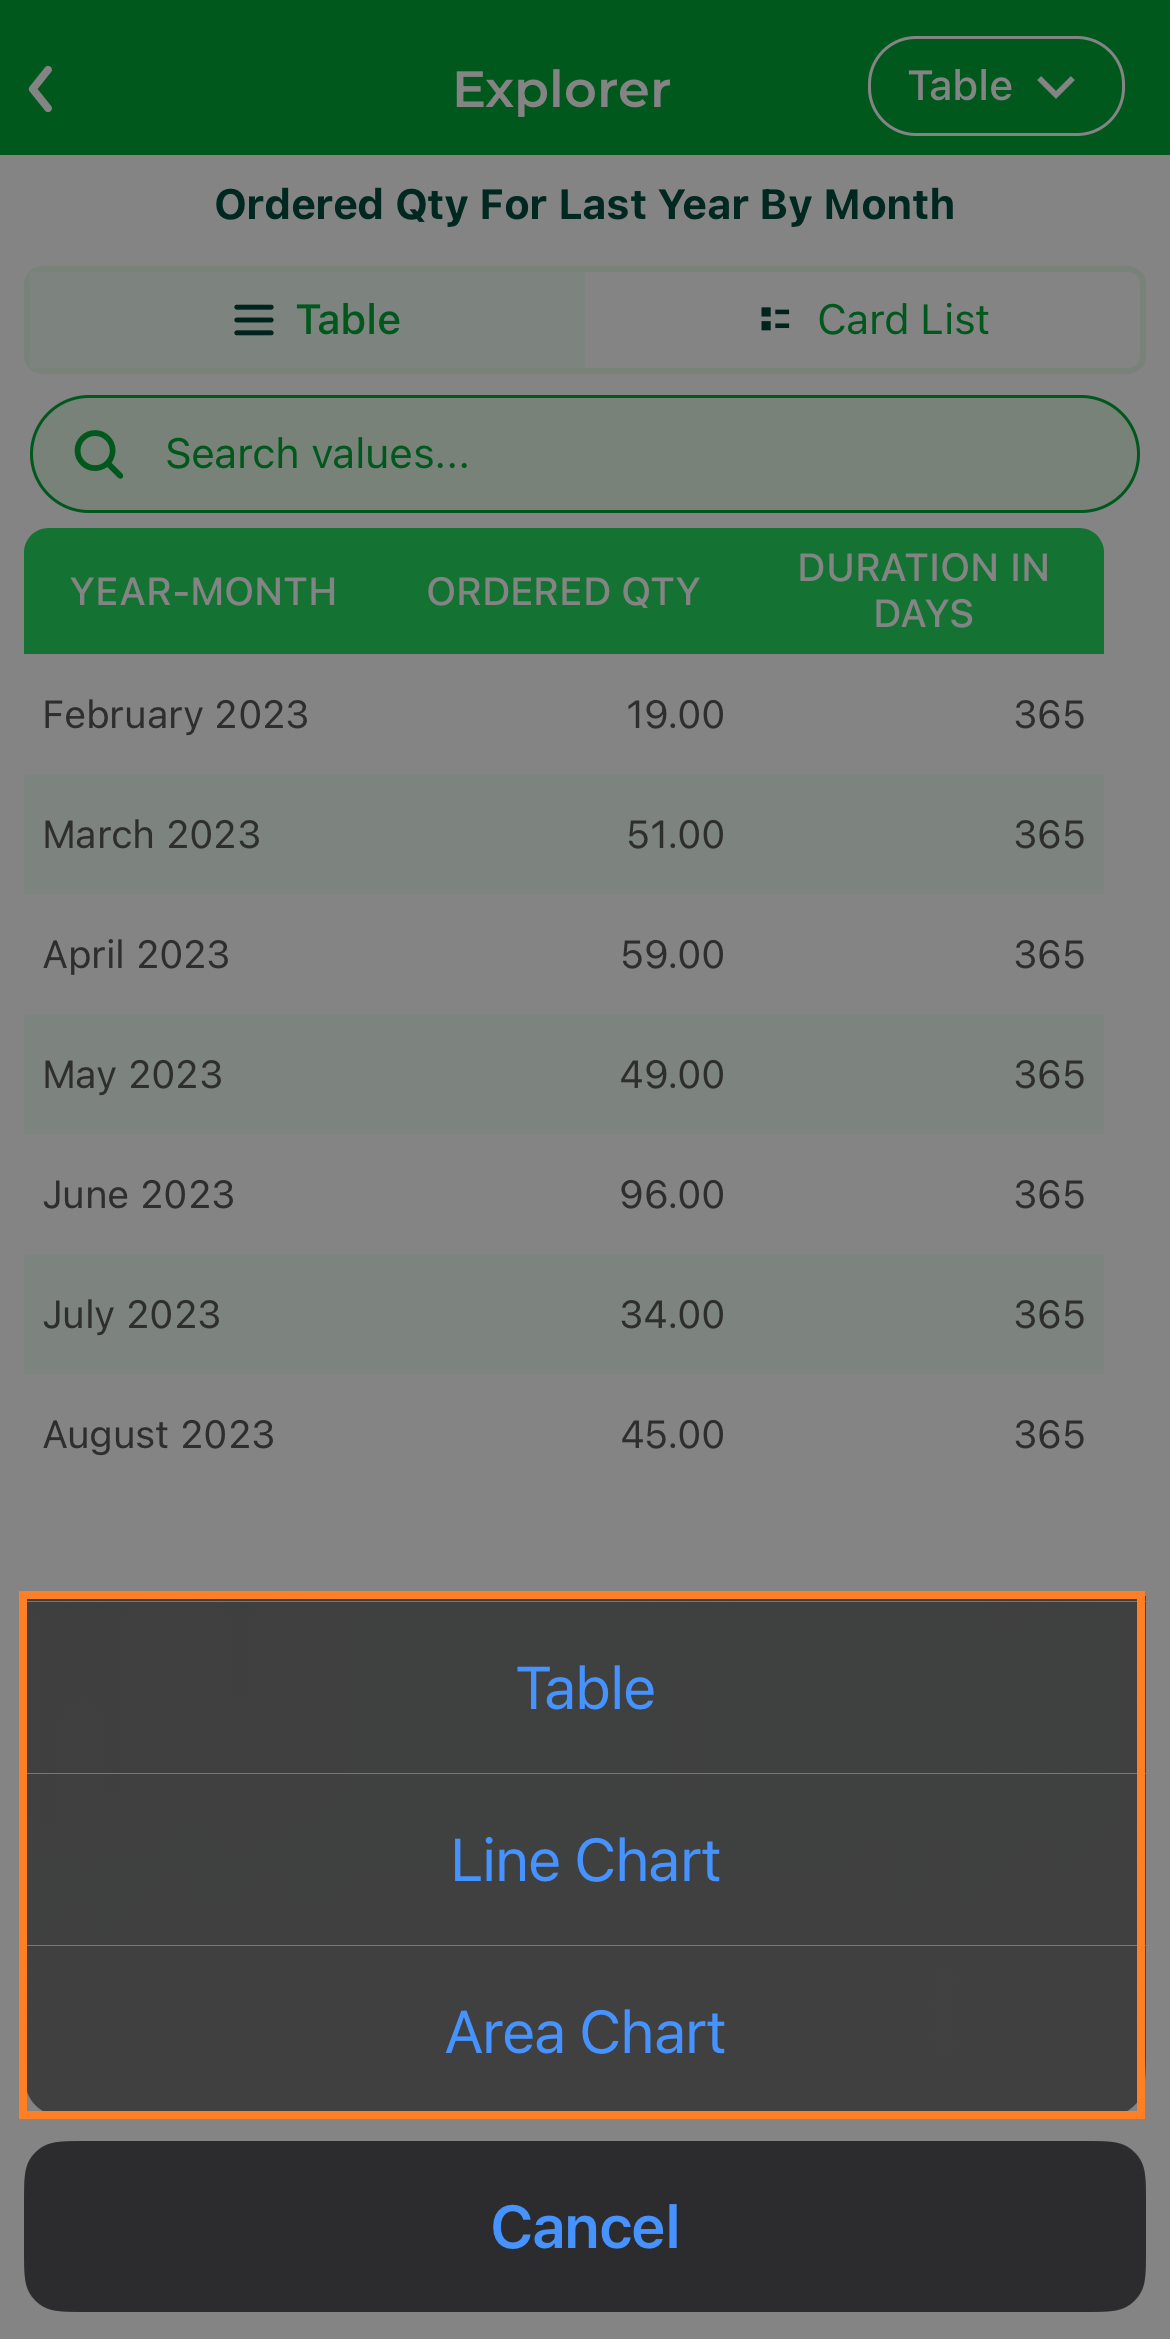
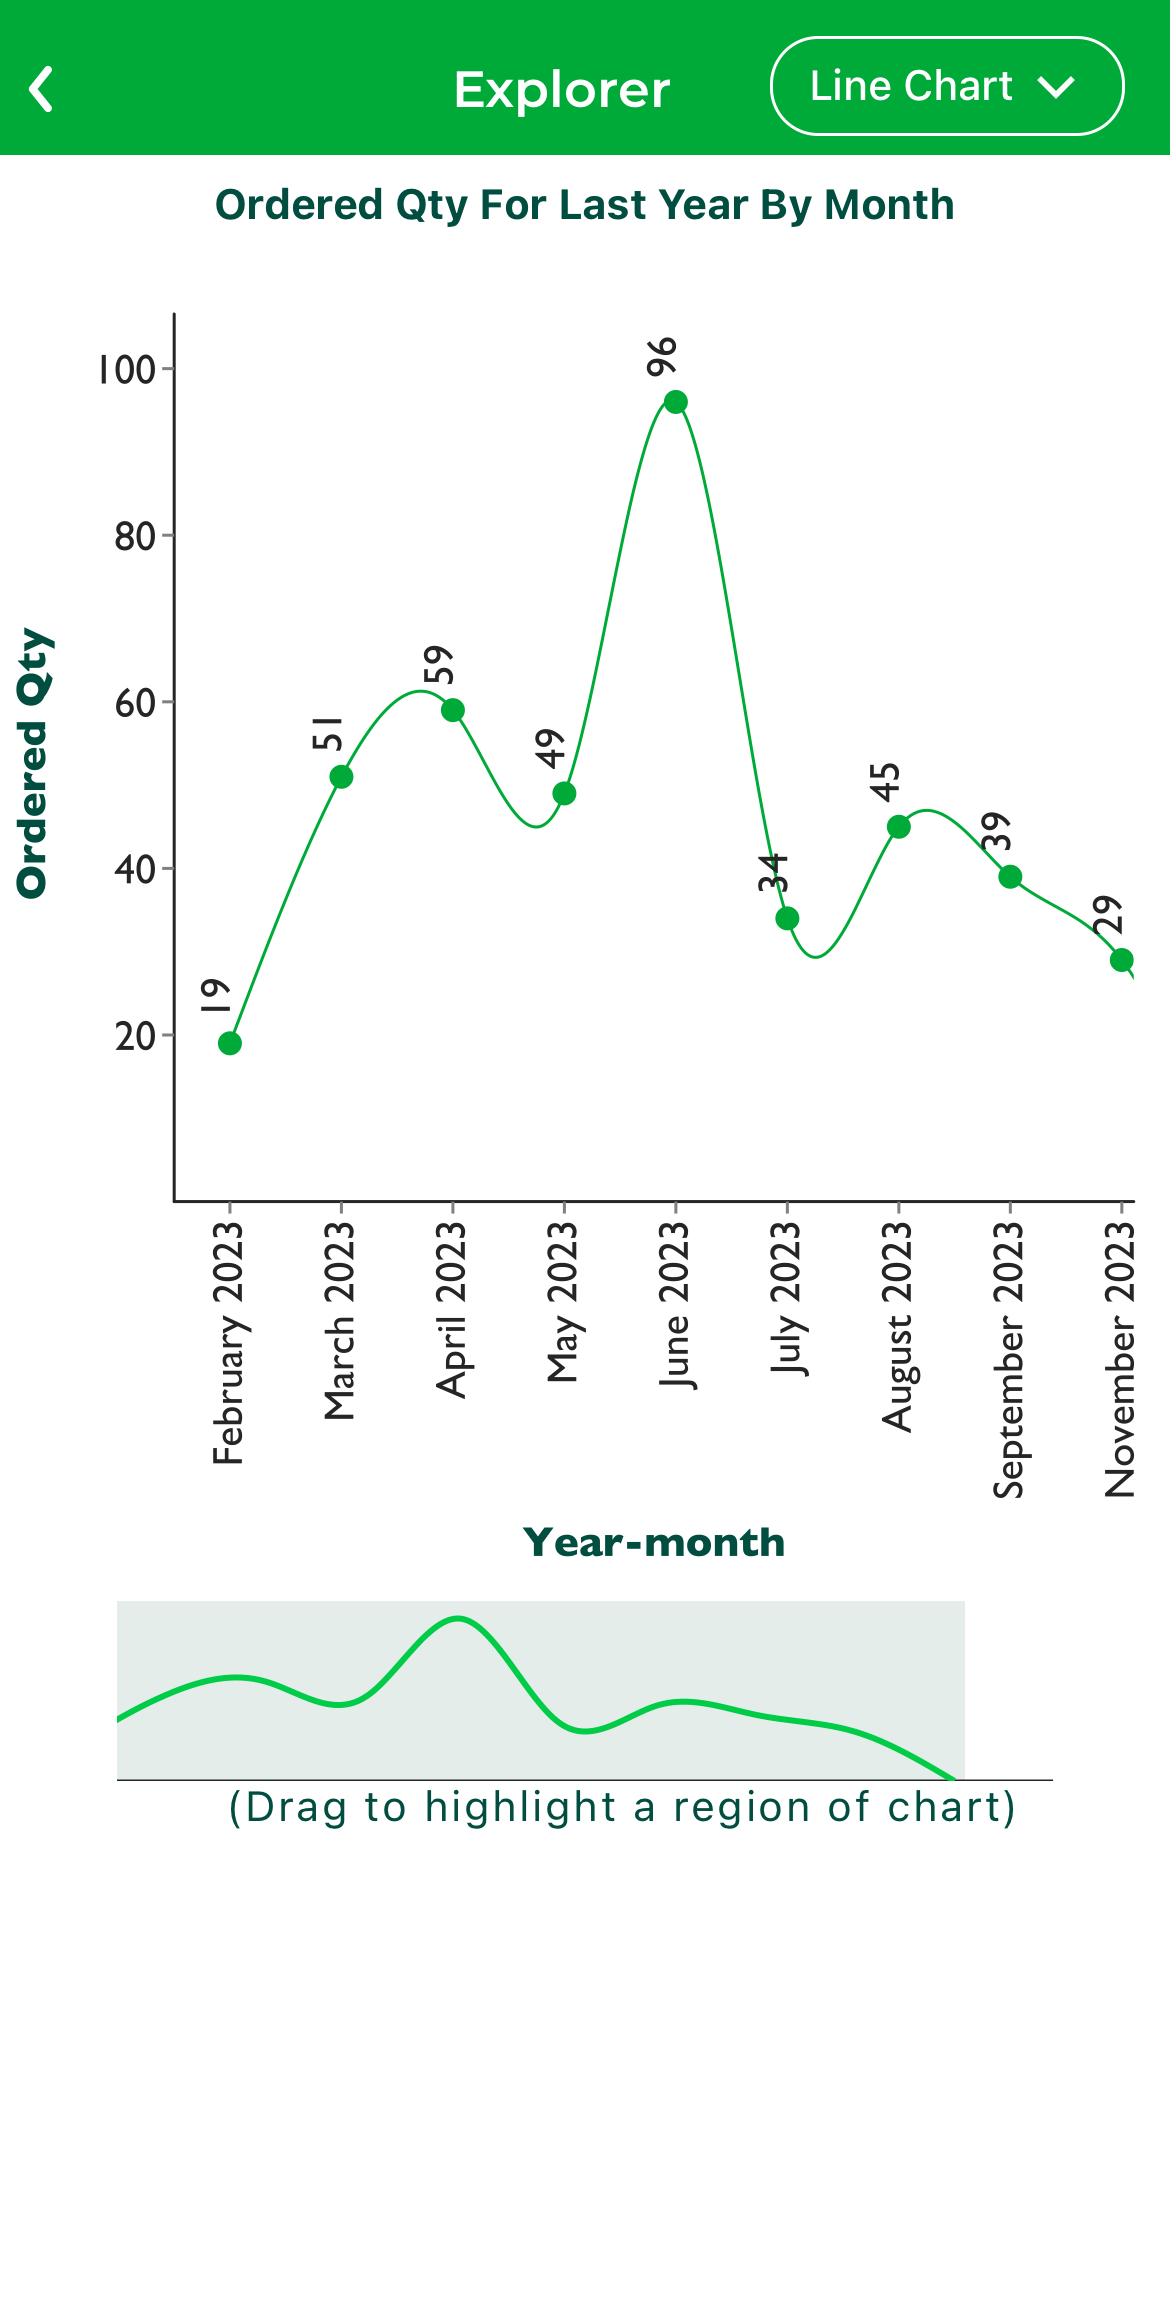
Step 3: By clicking on the  icon, select from various chart types to visualize the data, providing a versatile analysis experience.

Table View#
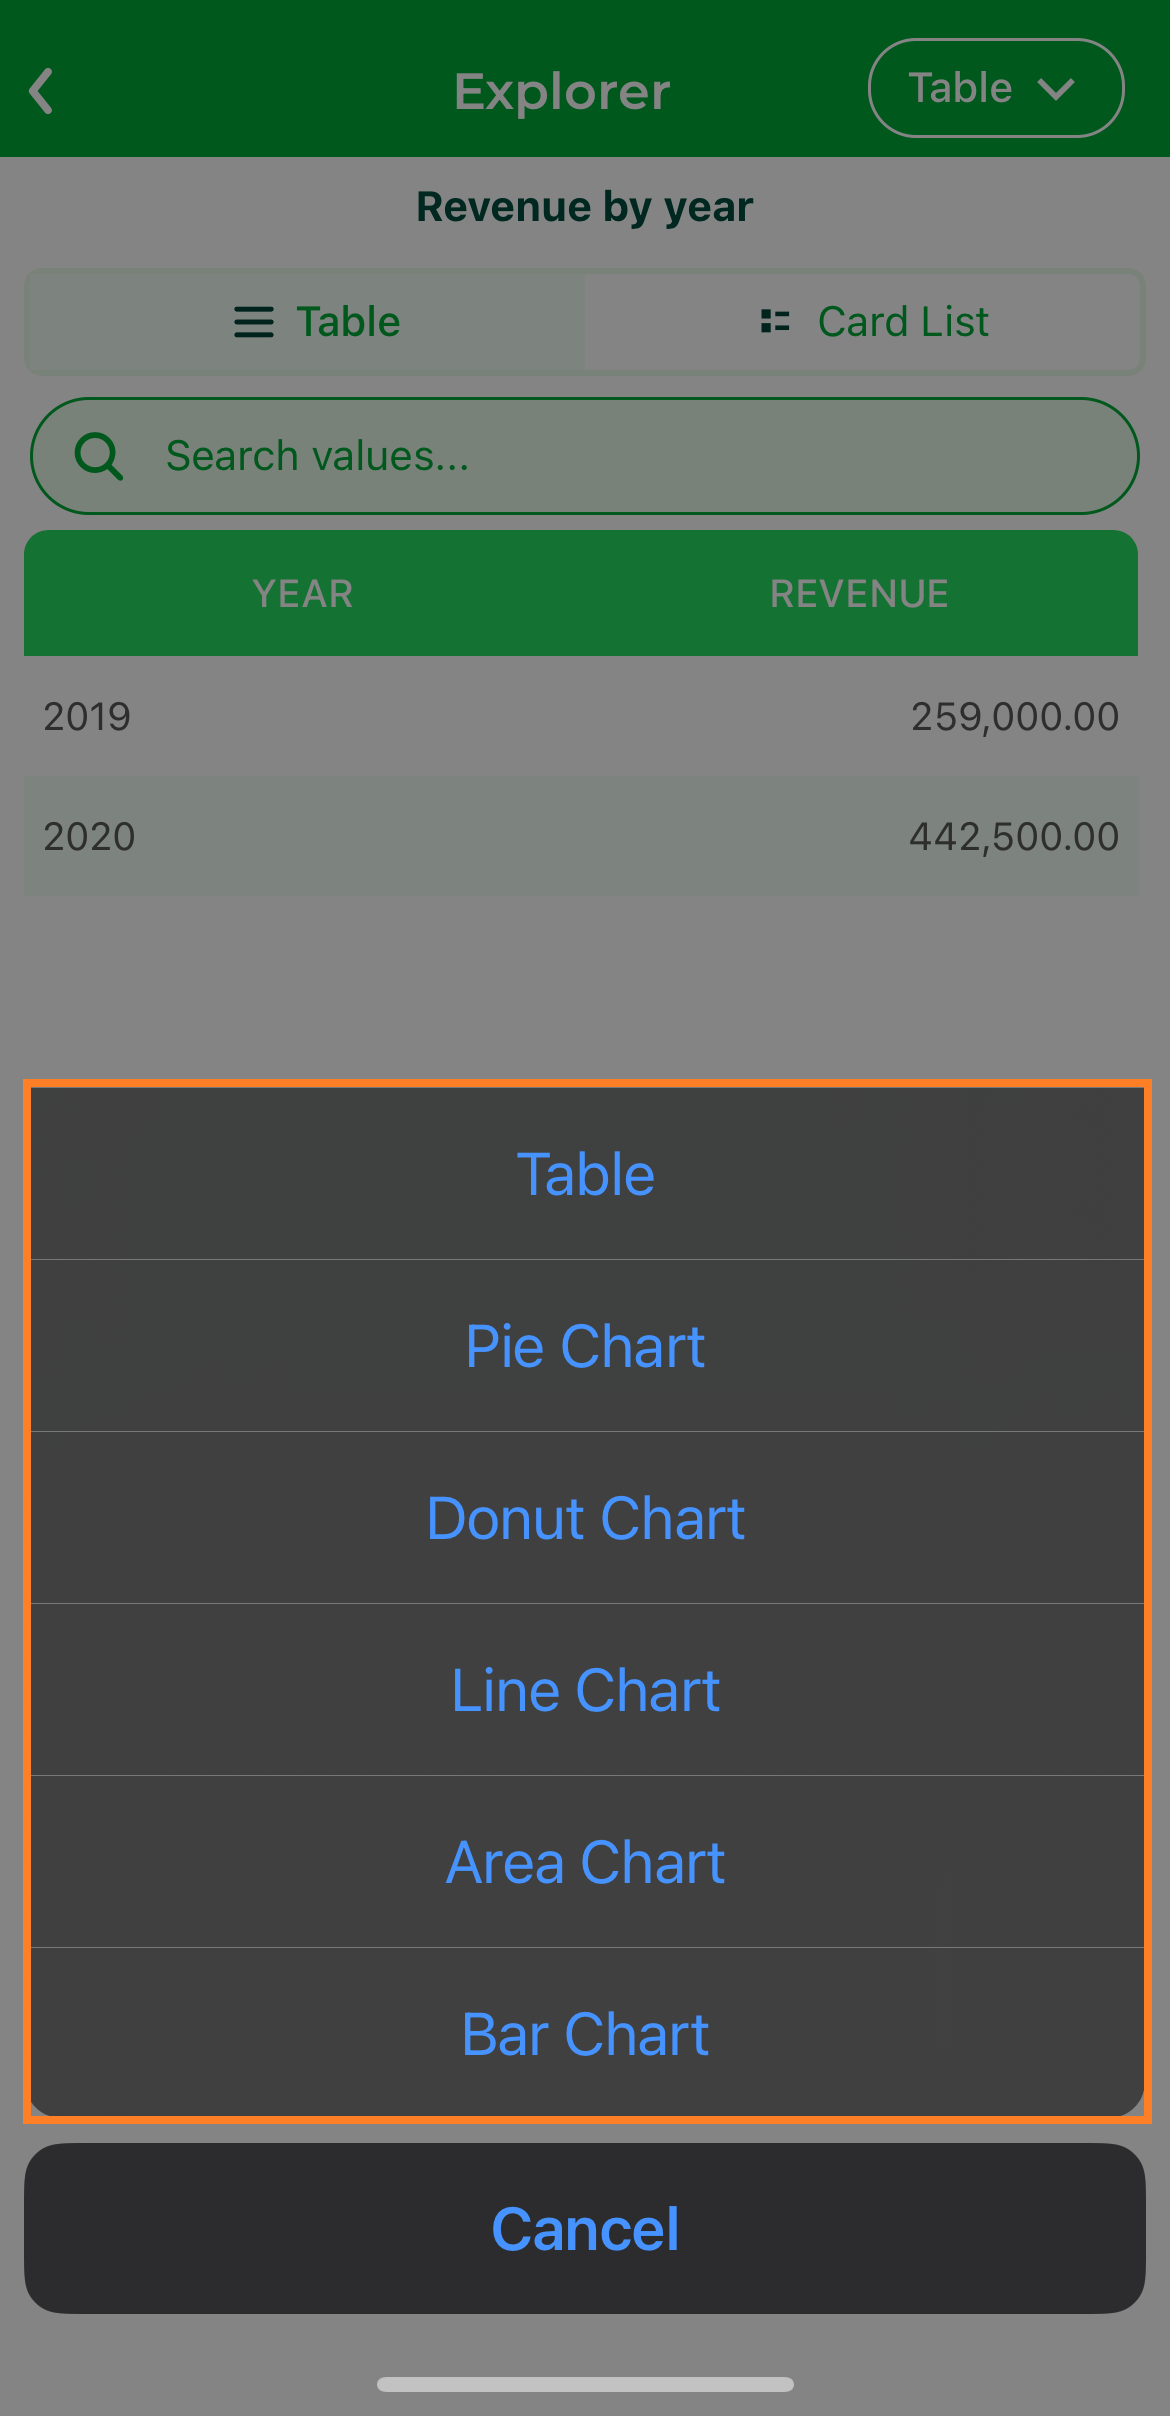
Charts Selection#
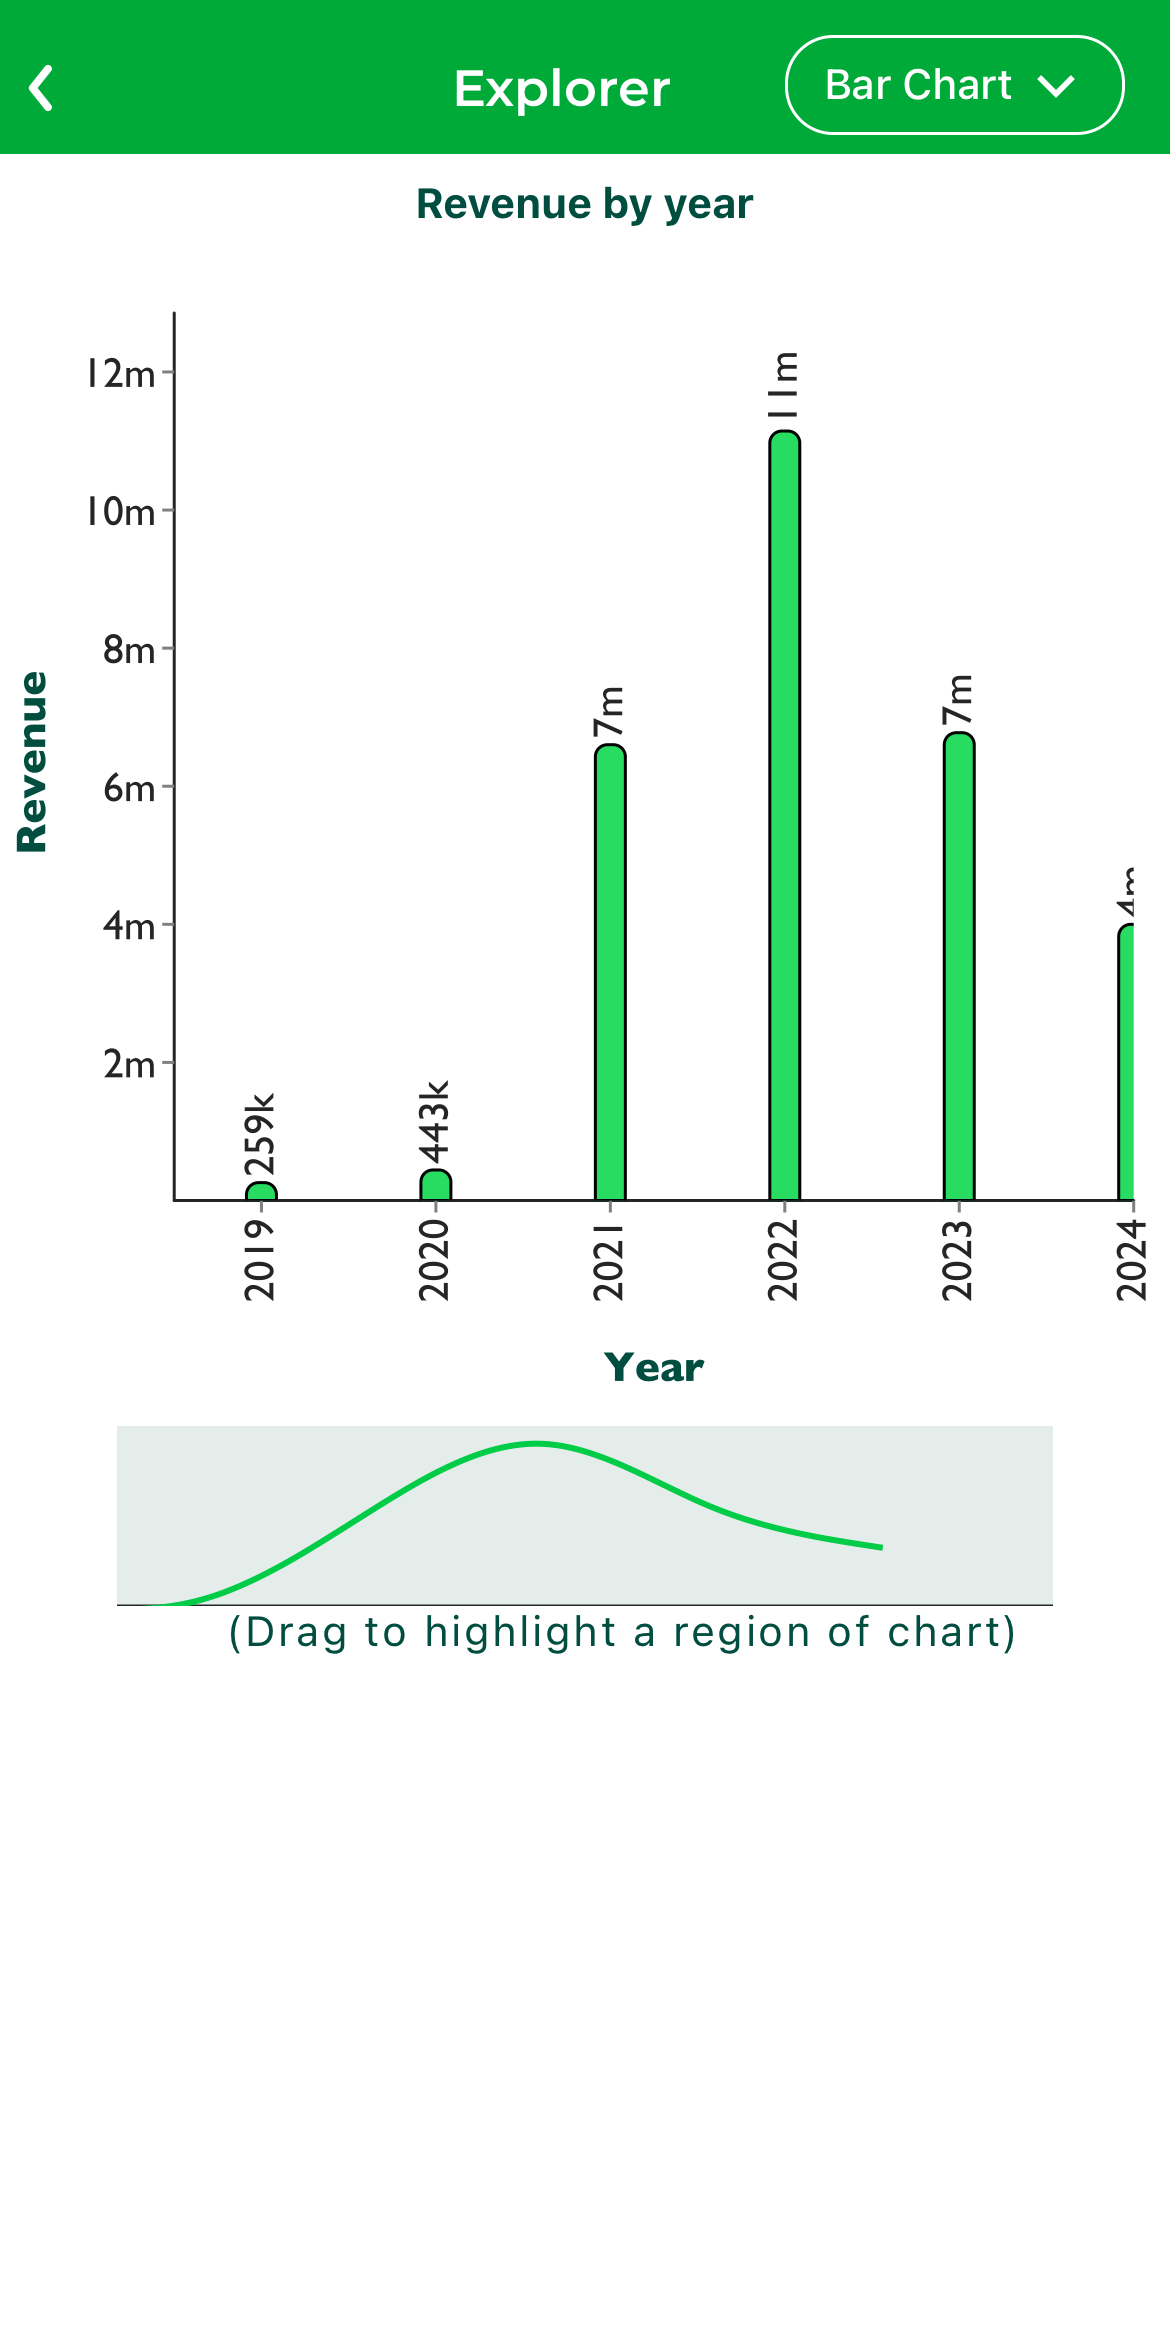
Charts Selection#
Dashboards#
The Dashboards section gives users access to all their dashboards, organized by business areas, enabling easy exploration and visualization of data for informed decision-making.
Step 1: Navigate to the Dashboards section to view all available dashboards.
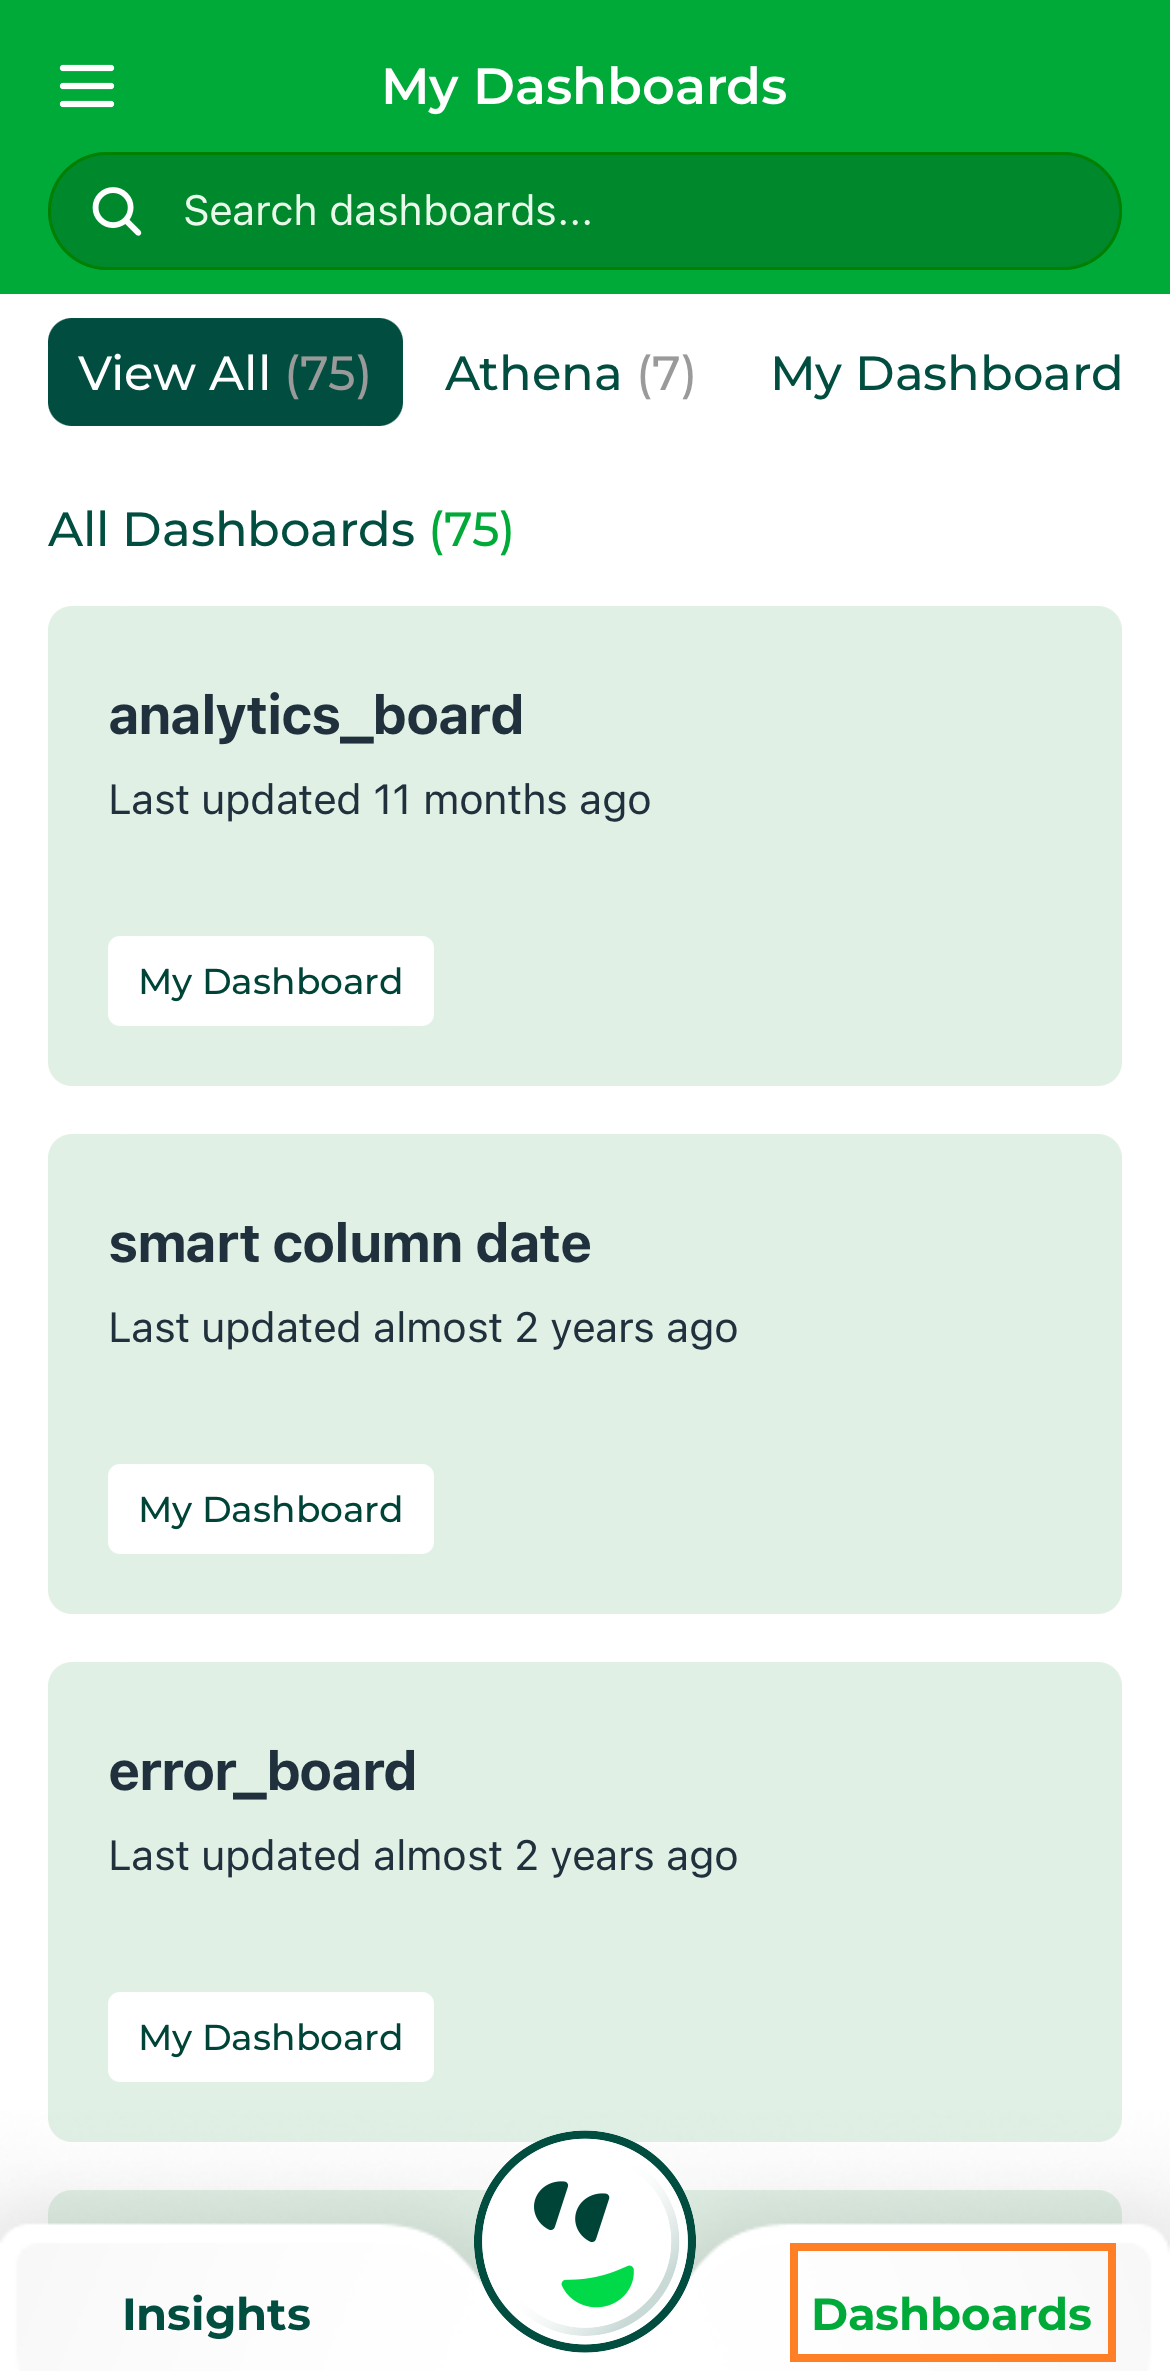
Dashboard#
Step 2: Select a business area to filter dashboards by category, or use the search feature to quickly locate your dashboards, or directly access a specific dashboard from the list.
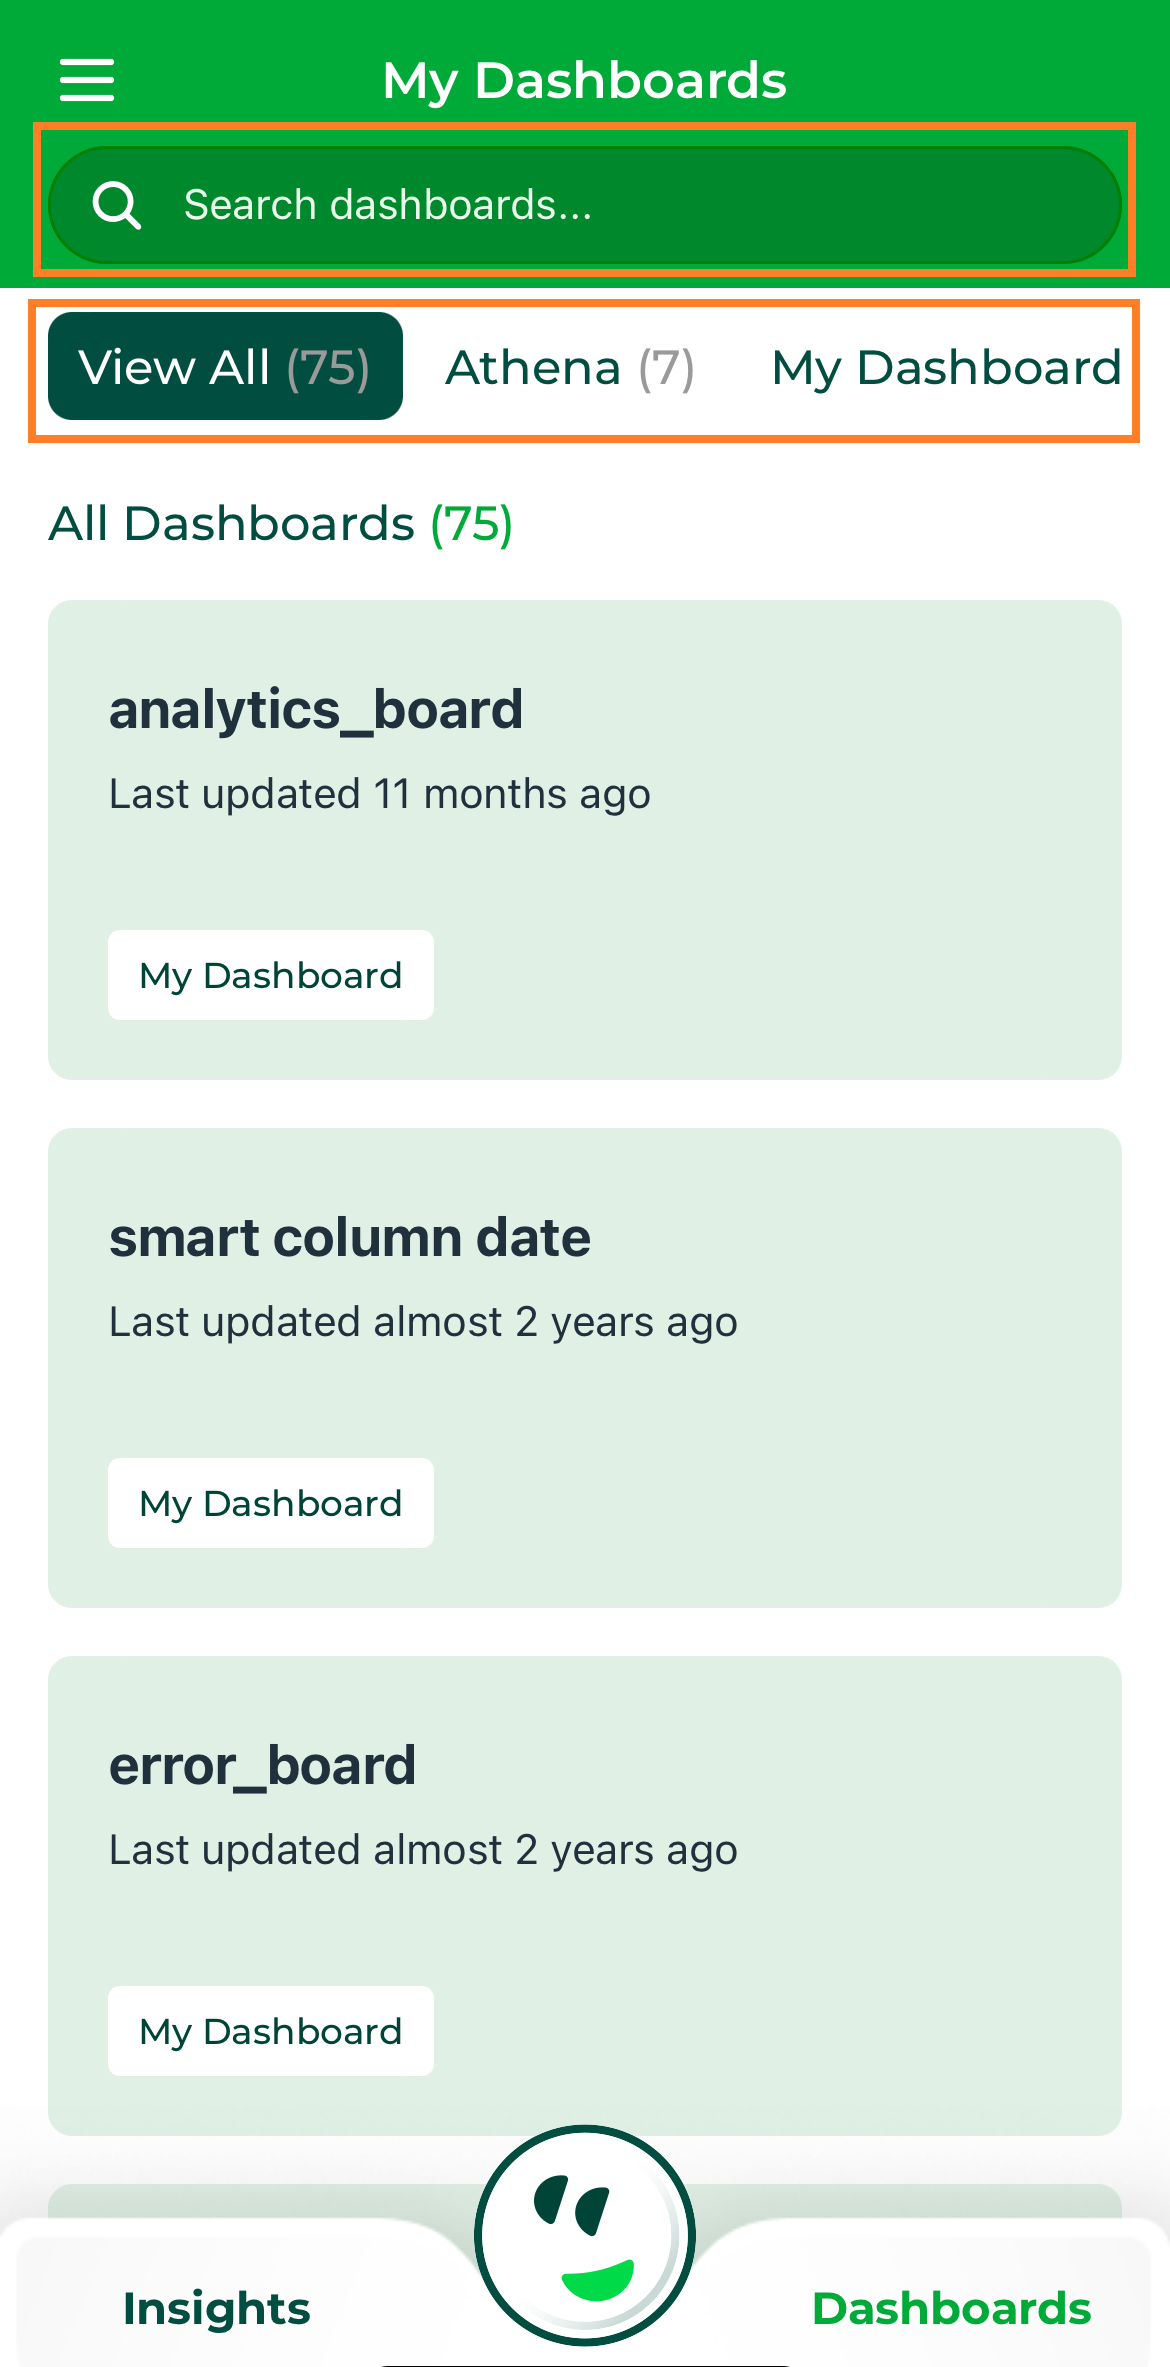
Dashboard Field#
Dashboard#
Step 3: After selecting a dashboard, click on it to explore the data. By default, the data will be displayed in a table view. If preferred, you can switch to a card list view for a different format.

Table View#
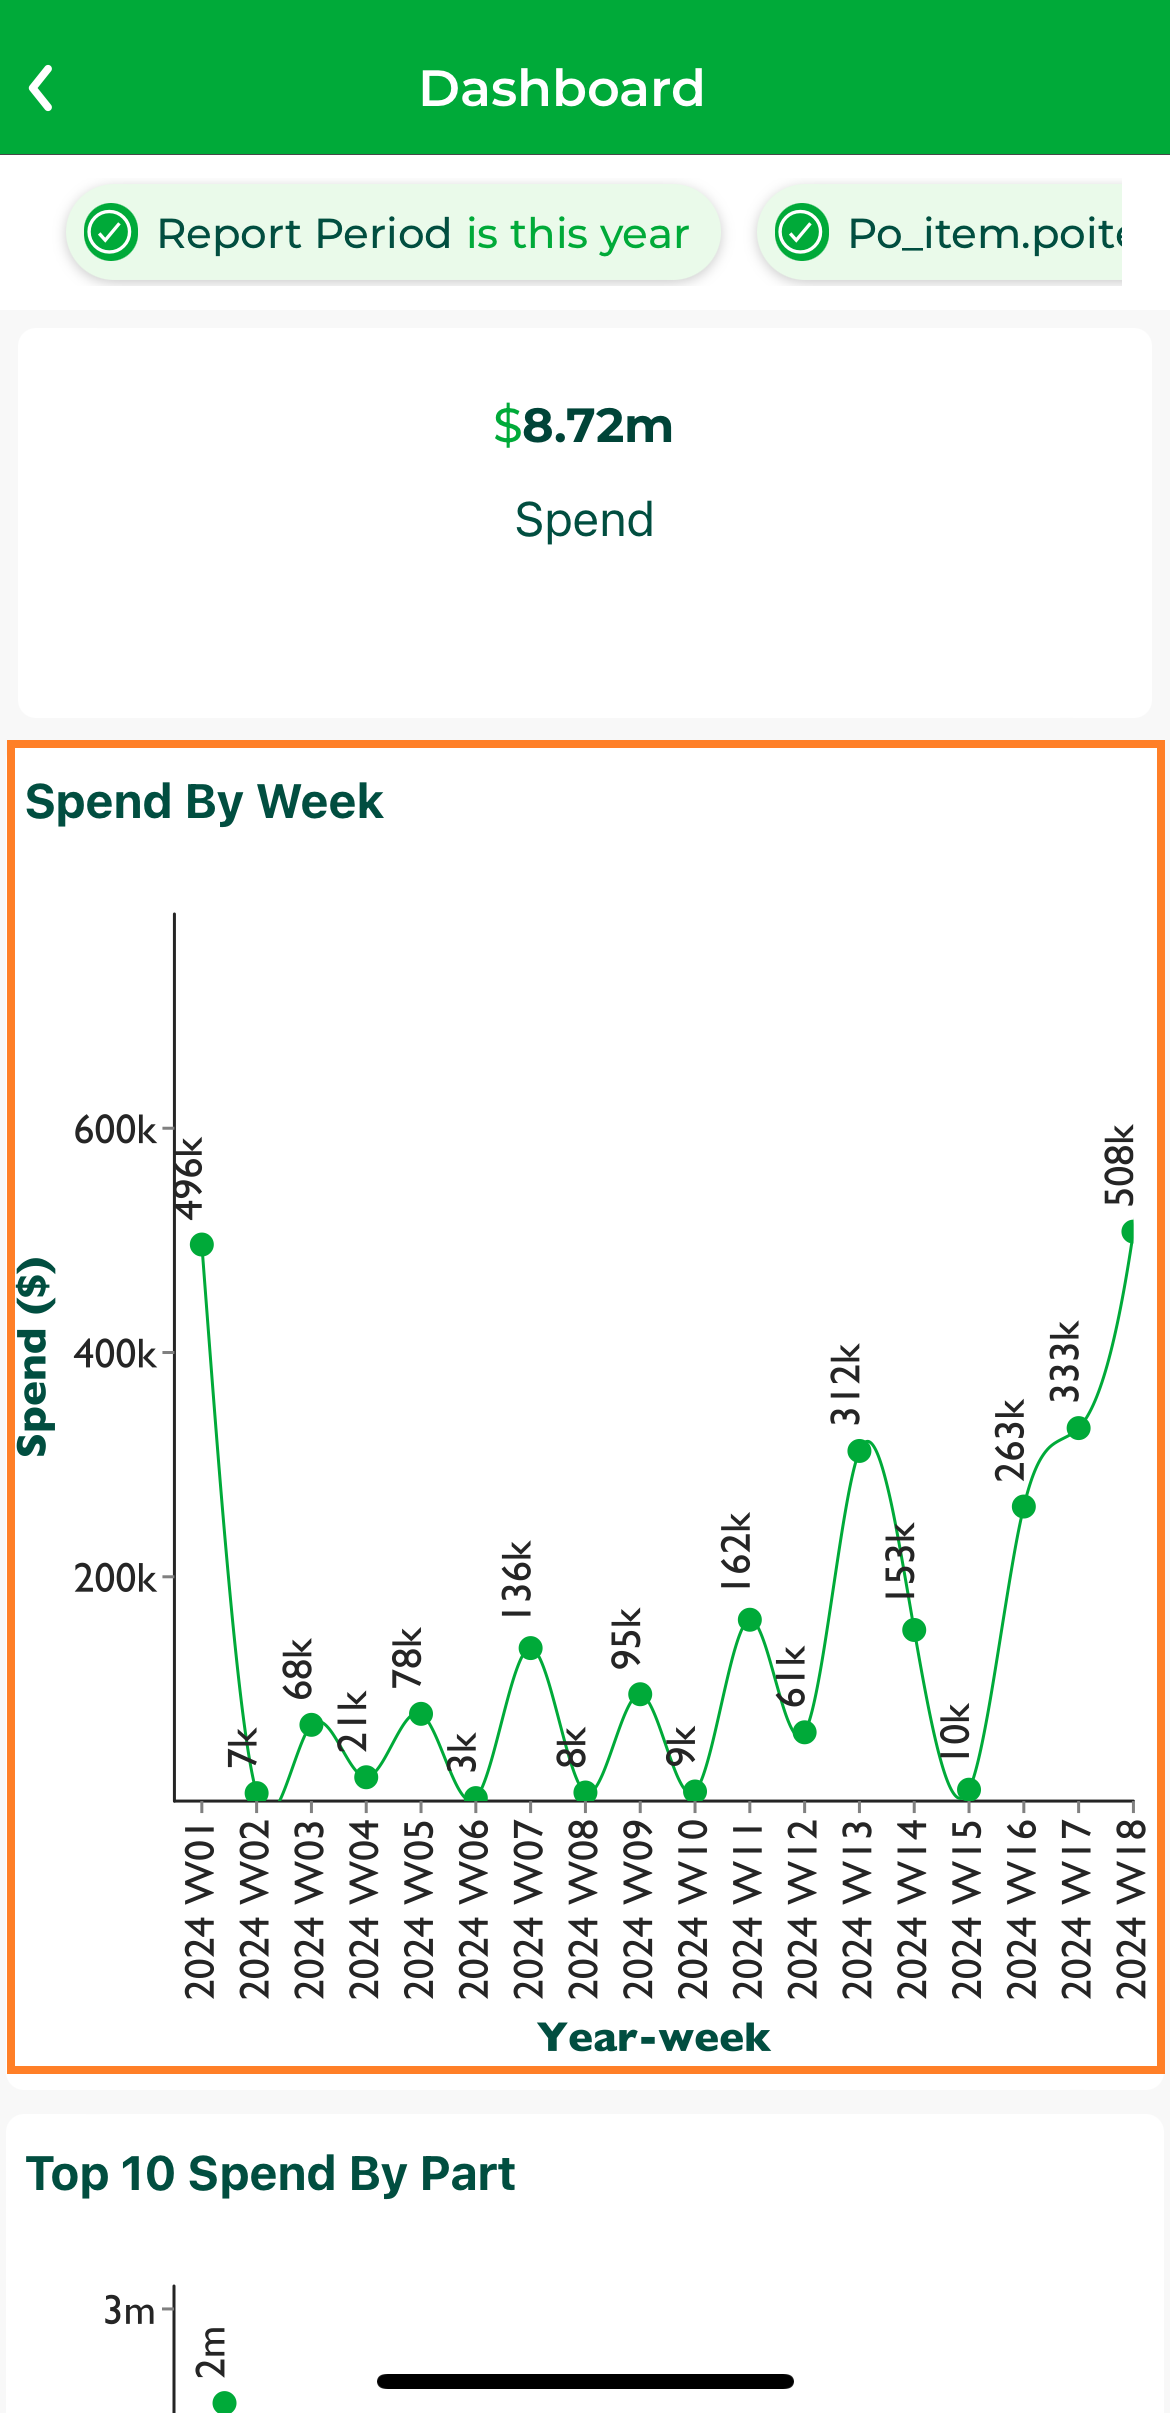
Step 4: By clicking on the icon, you can choose from different chart types (e.g., pie charts, line charts) to visualize the data, offering flexibility in how you analyze and interpret the information.
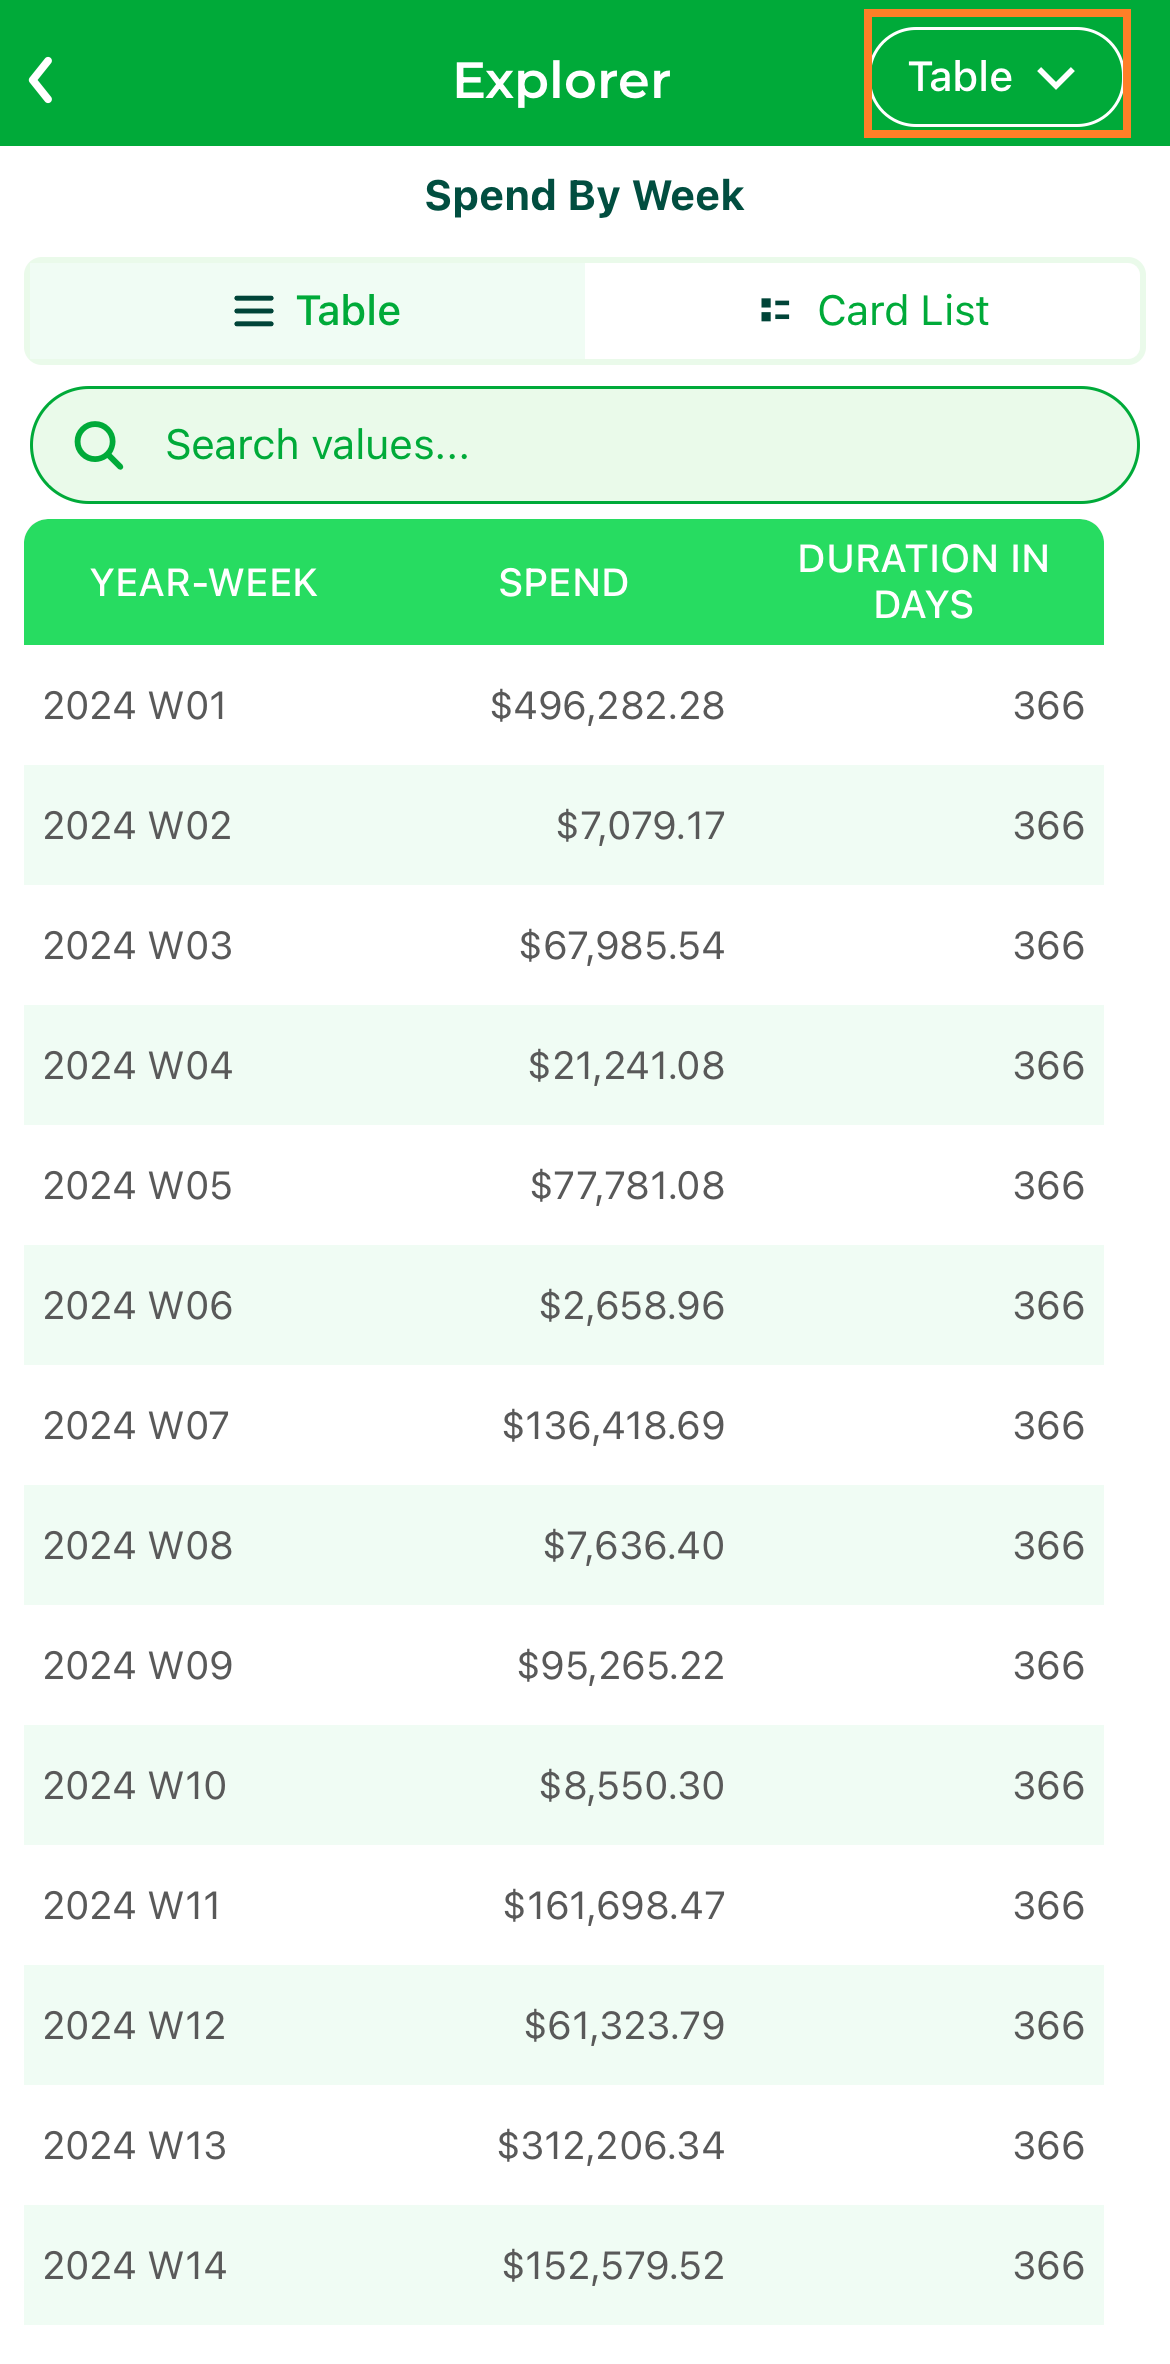
Chart Selection#
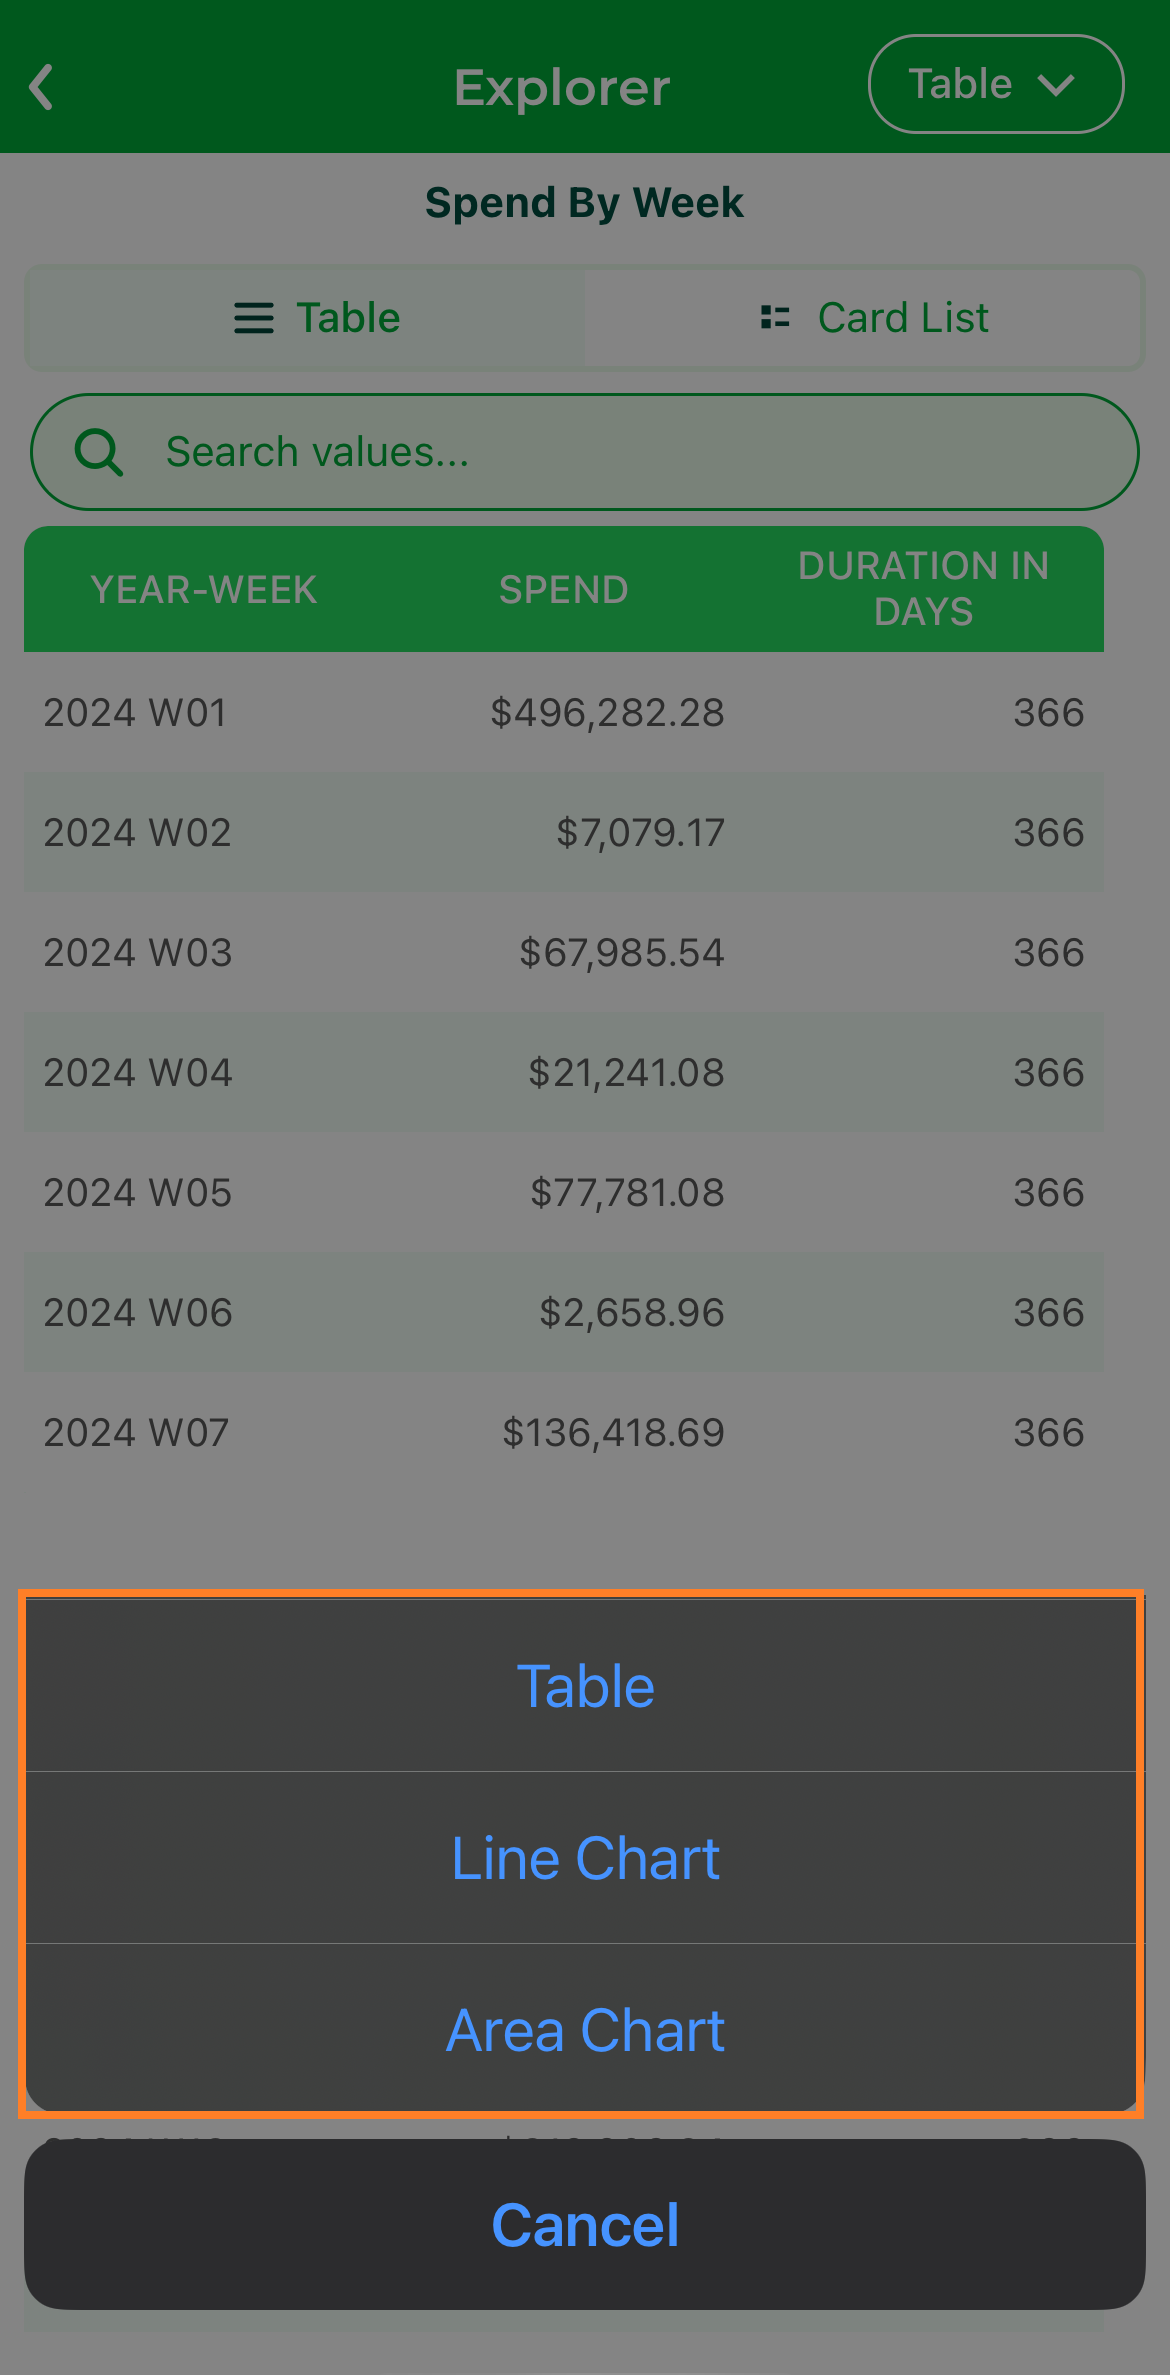
Chart Selection#
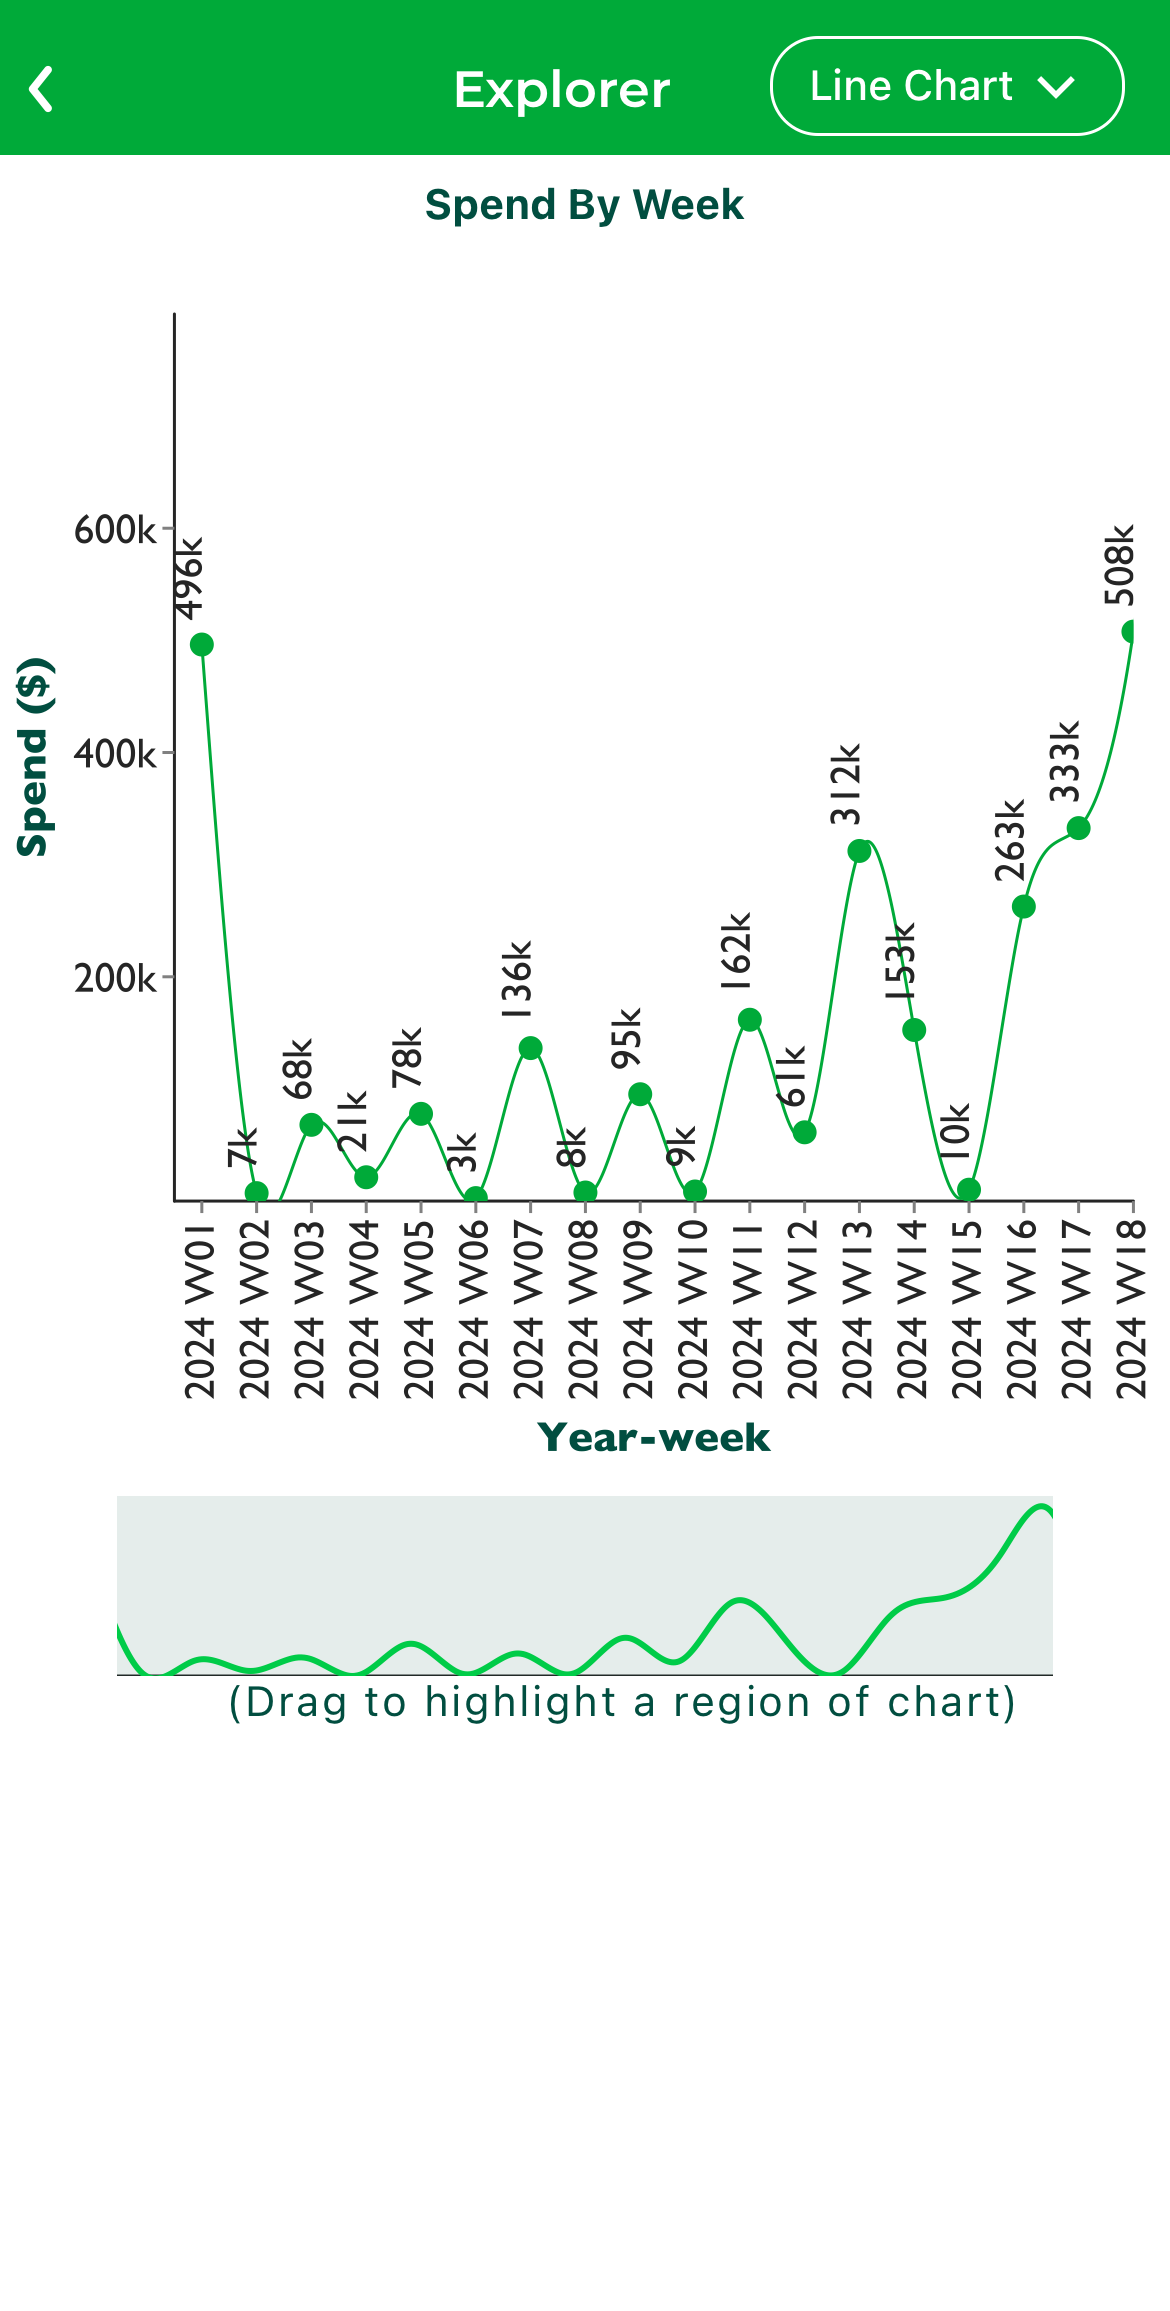
Chart Selection#
Athena Chat#
To interact with Athena, the AI-powered virtual assistant, tap on the Athena icon within the app. The following are the steps to interact with Athena:
Step 1: Tap on the Athena icon in the mobile app to start interacting with the virtual assistant.
Athena Icon#
Step 2: Click on the  icon to select the dataset you want to query.
Dataset Button#
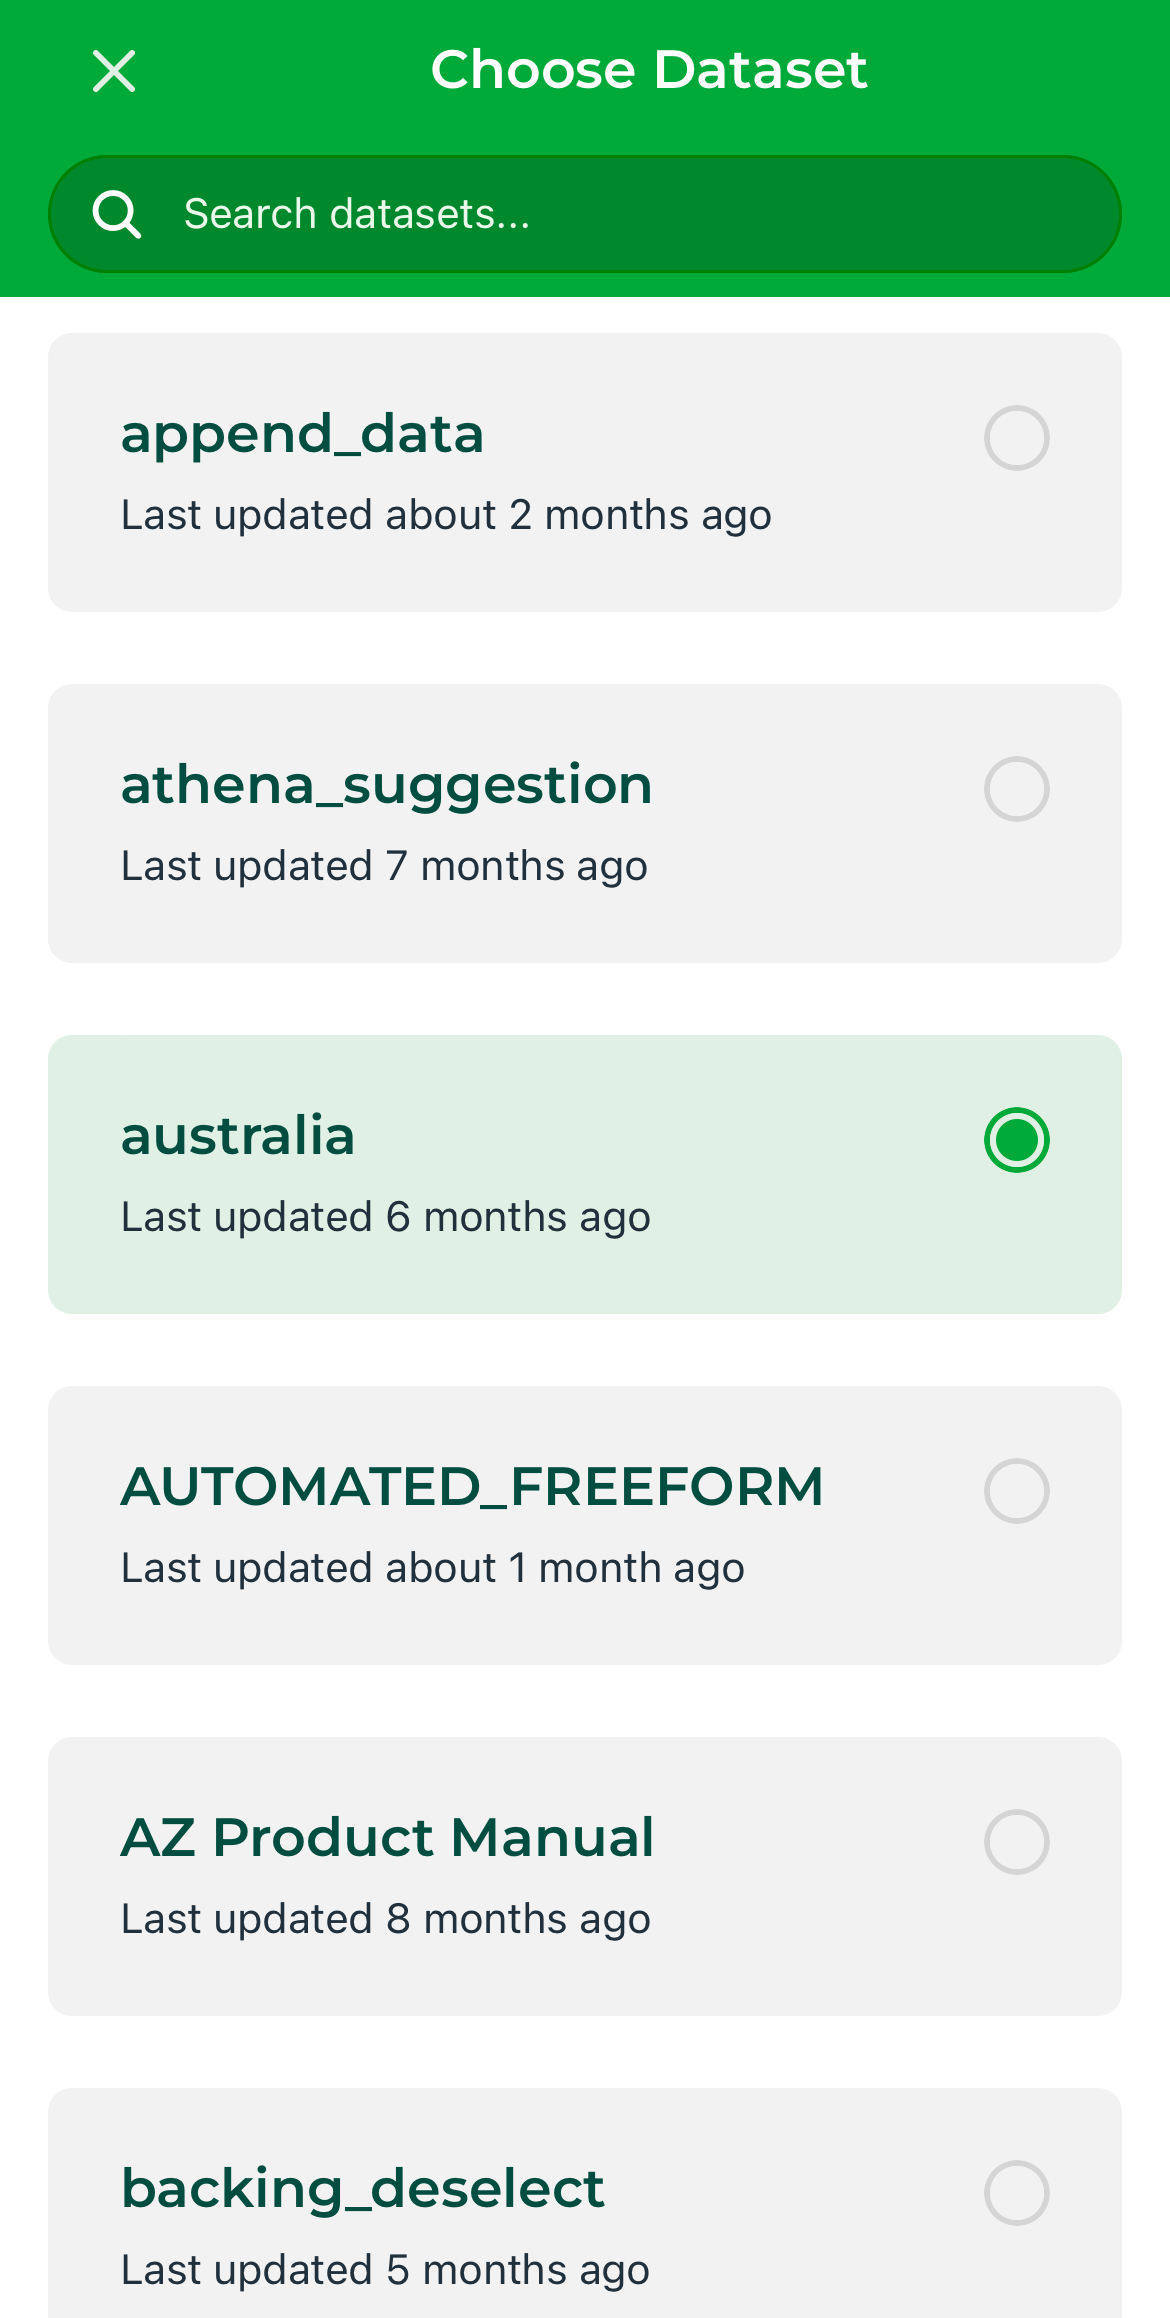
Dataset Select#
Step 3: You can either type your query in the text box or use the voice input feature to ask your question.
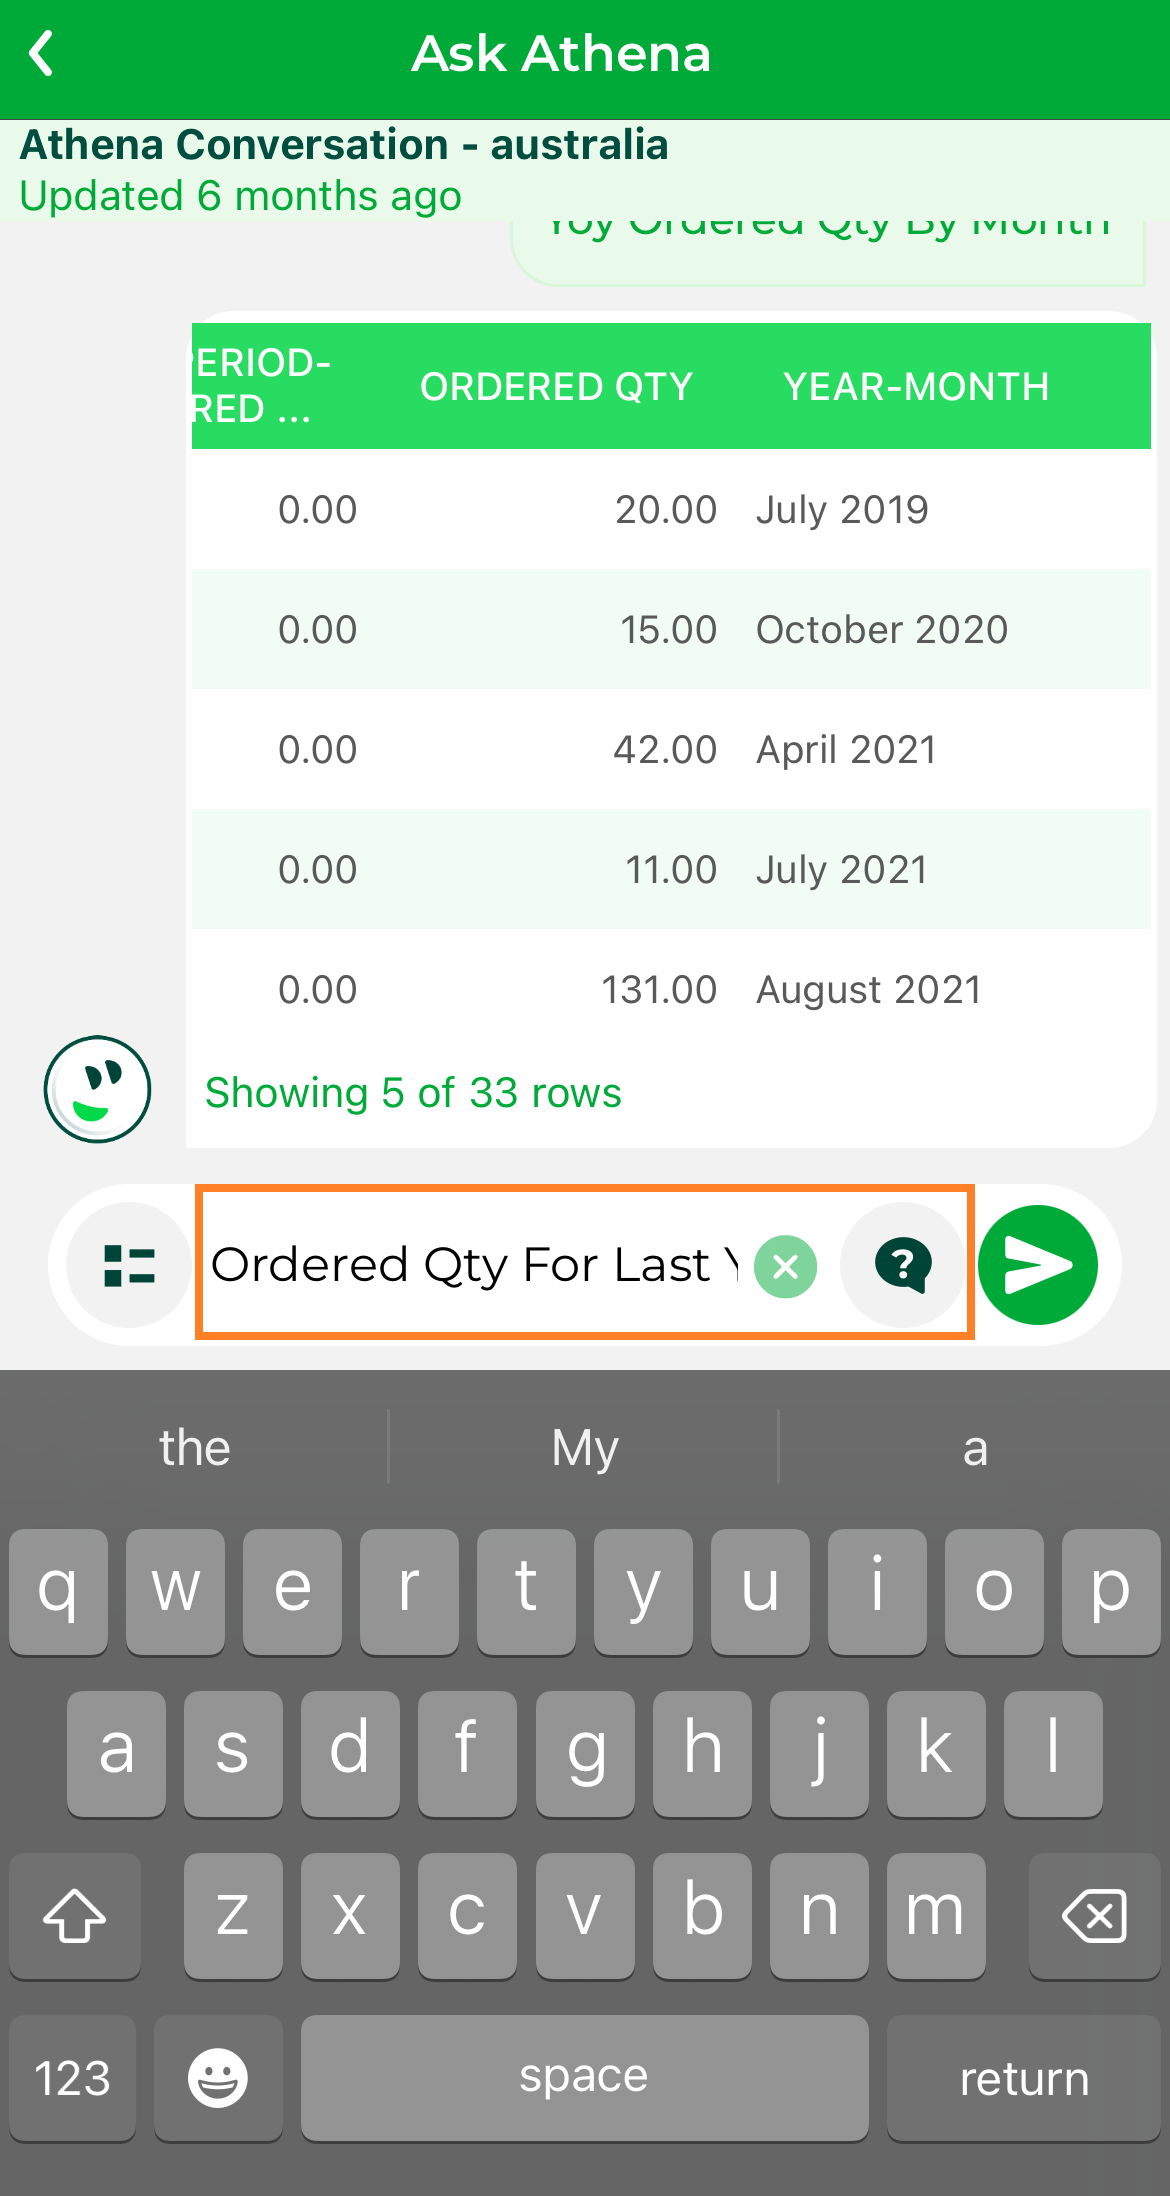
Query#
Step 4: After typing or speaking your query, tap the Submit button to send it to Athena.
Query Submit#
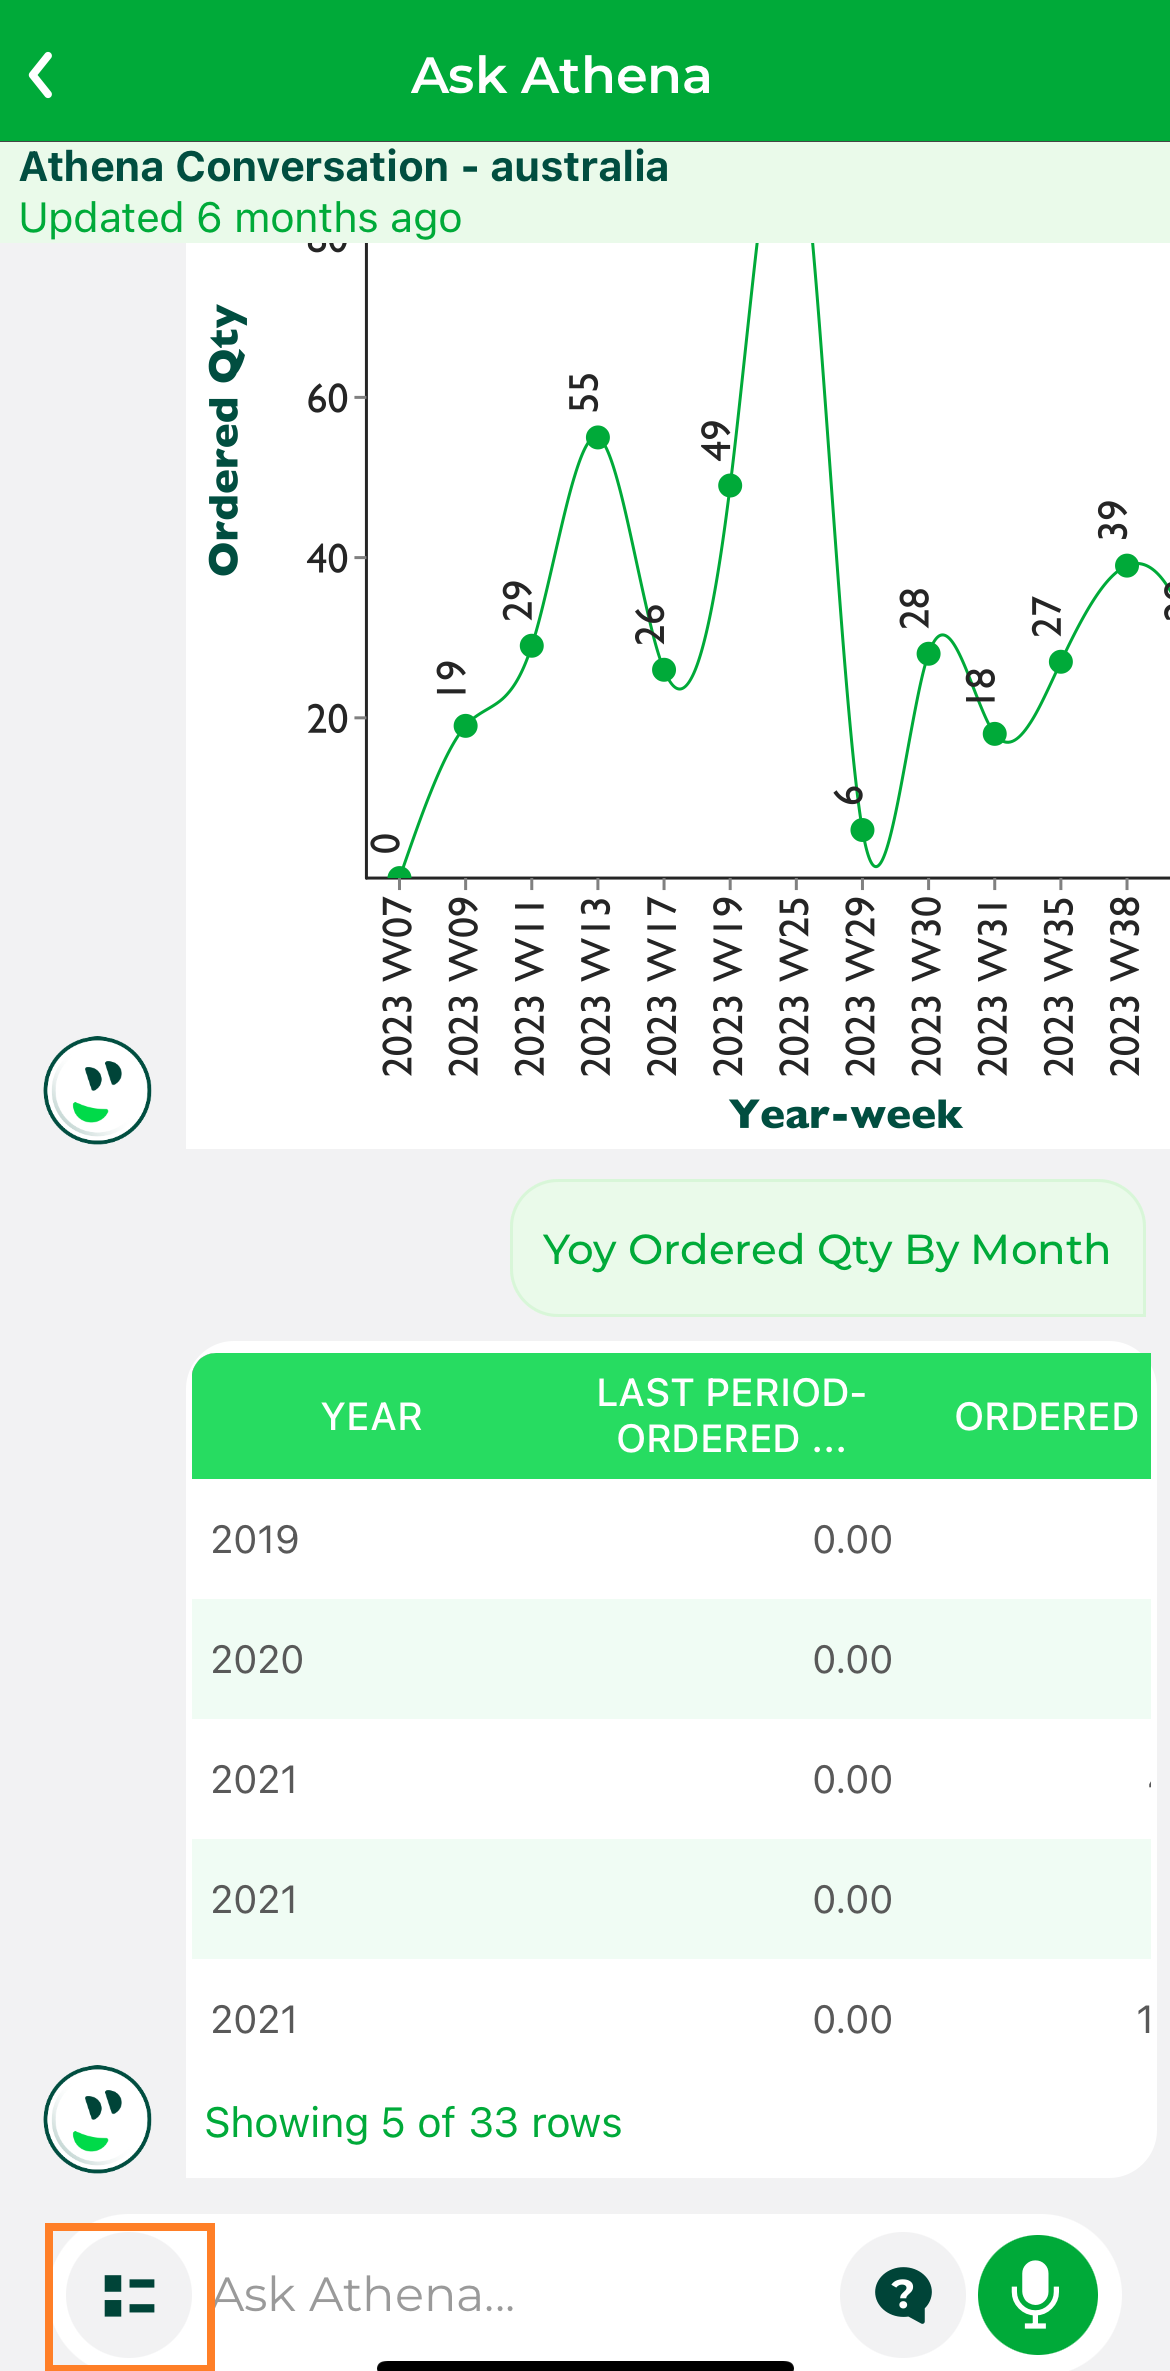
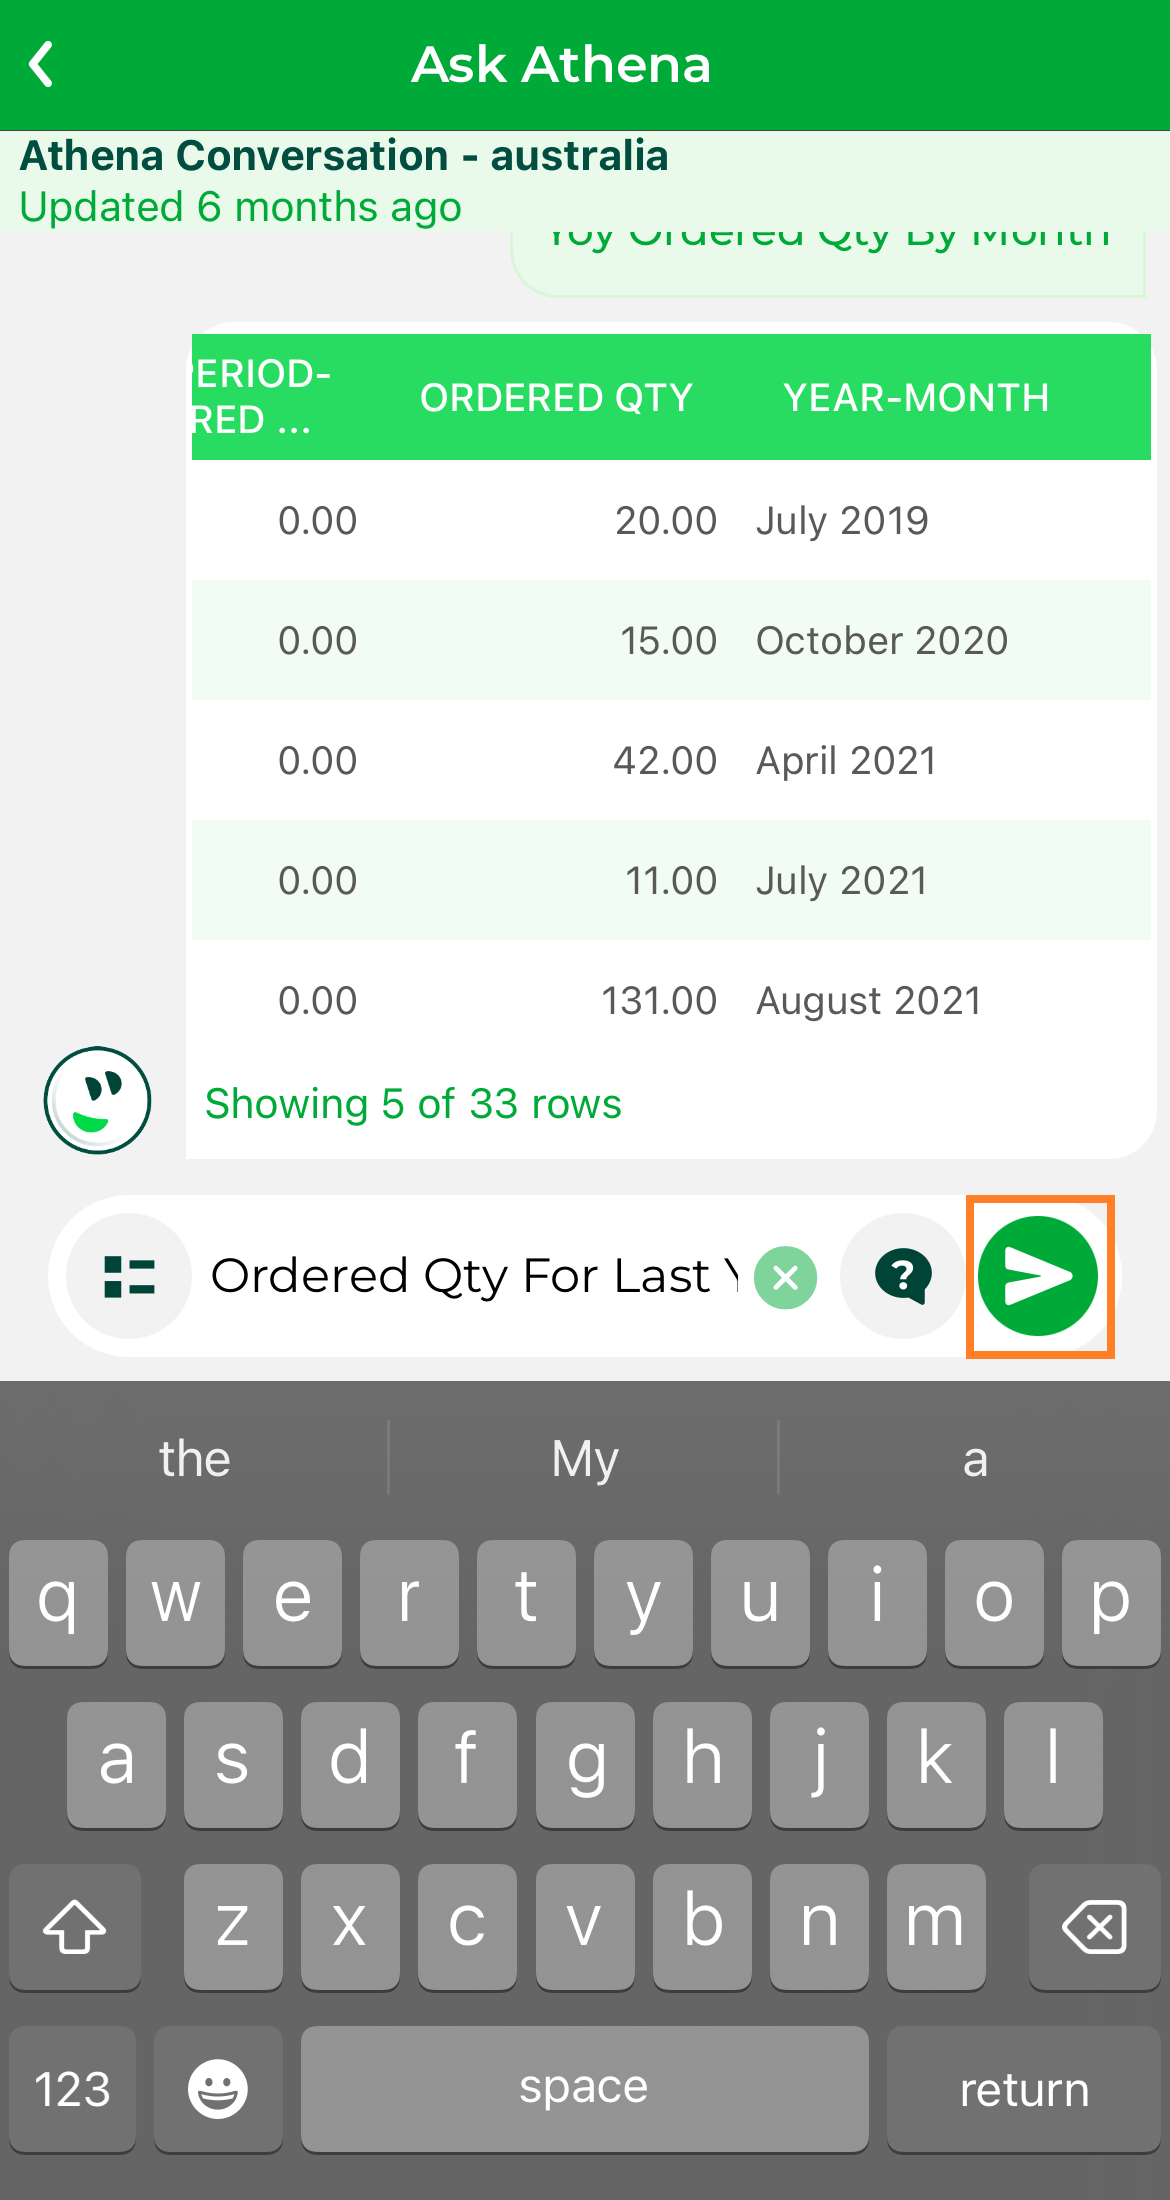
Step 5: Athena will generate a response based on your query. You can read the result directly within the chat interface. Users can click on the response provided by Athena to explore the data in more depth and continue analyzing the insights.
Response#
Step 6: The data is initially displayed in a table view by default, but you can switch to a card list view if you prefer a different format.

Table View#
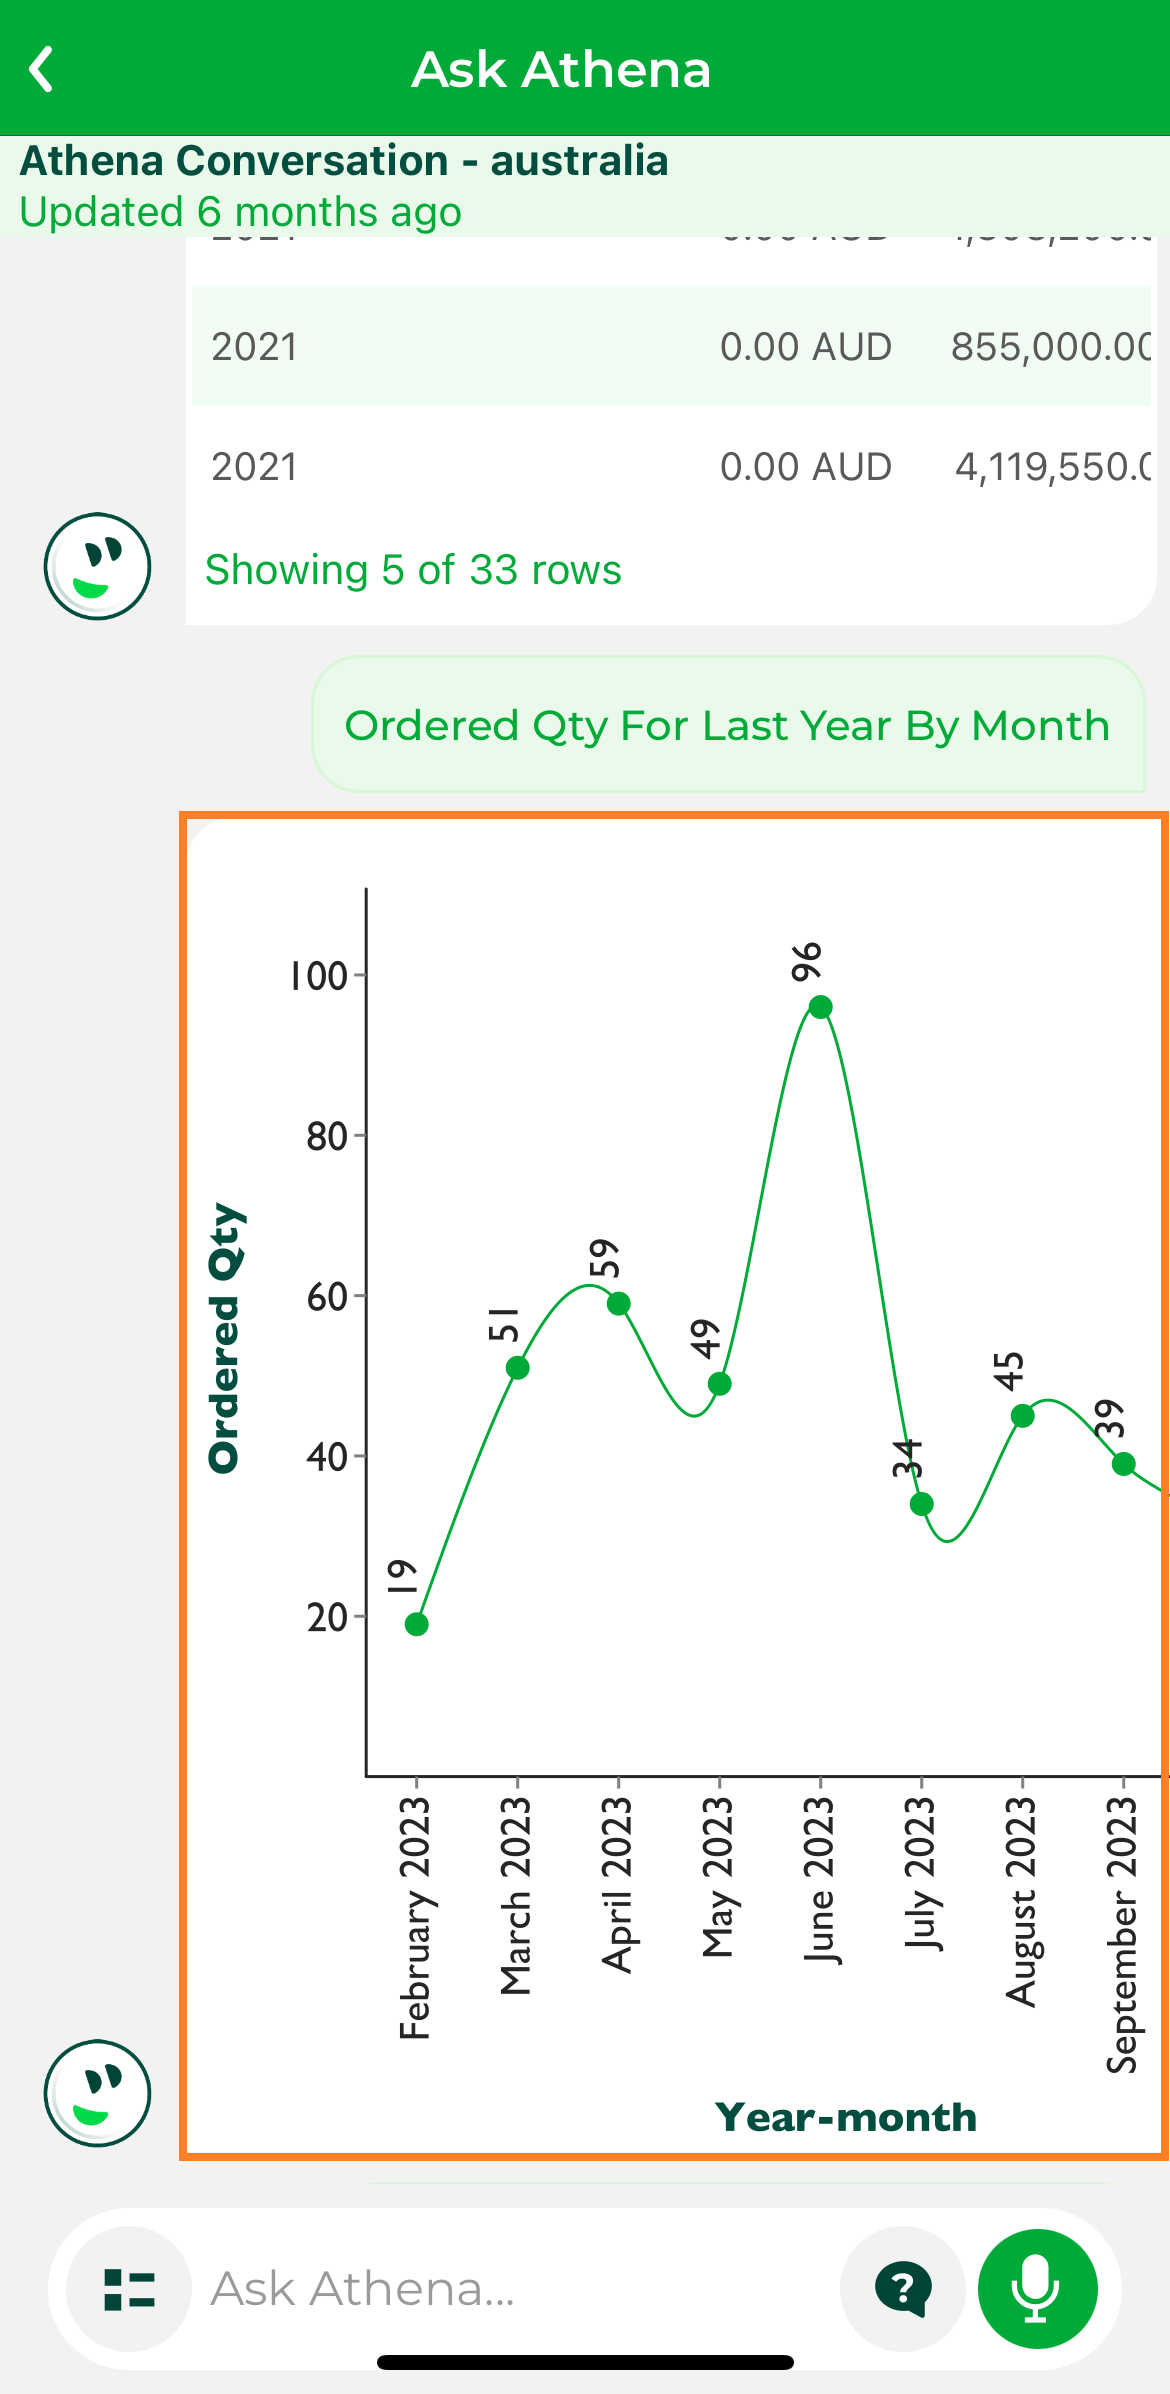
Additionally, by clicking , you can choose from a variety of chart types, giving you the flexibility to visualize and analyze the data in a way that suits your needs.
Select Charts#
Select Charts#
Save Chart#