Usage Monitoring#
In ConverSight’s ML Ops feature, Usage Monitoring simplifies the process for users, enabling them to conveniently observe and monitor the ongoing activities and real-time status of all clusters. With this tool, users can gain immediate insights into the operational performance of their clusters, aiding in swift decision-making and timely interventions when needed. Usage Monitoring fosters a transparent environment that supports users in understanding their cluster dynamics, facilitating efficient management and optimization.
To watch the video, click on Usage Monitoring.
Accessing Usage Monitoring#
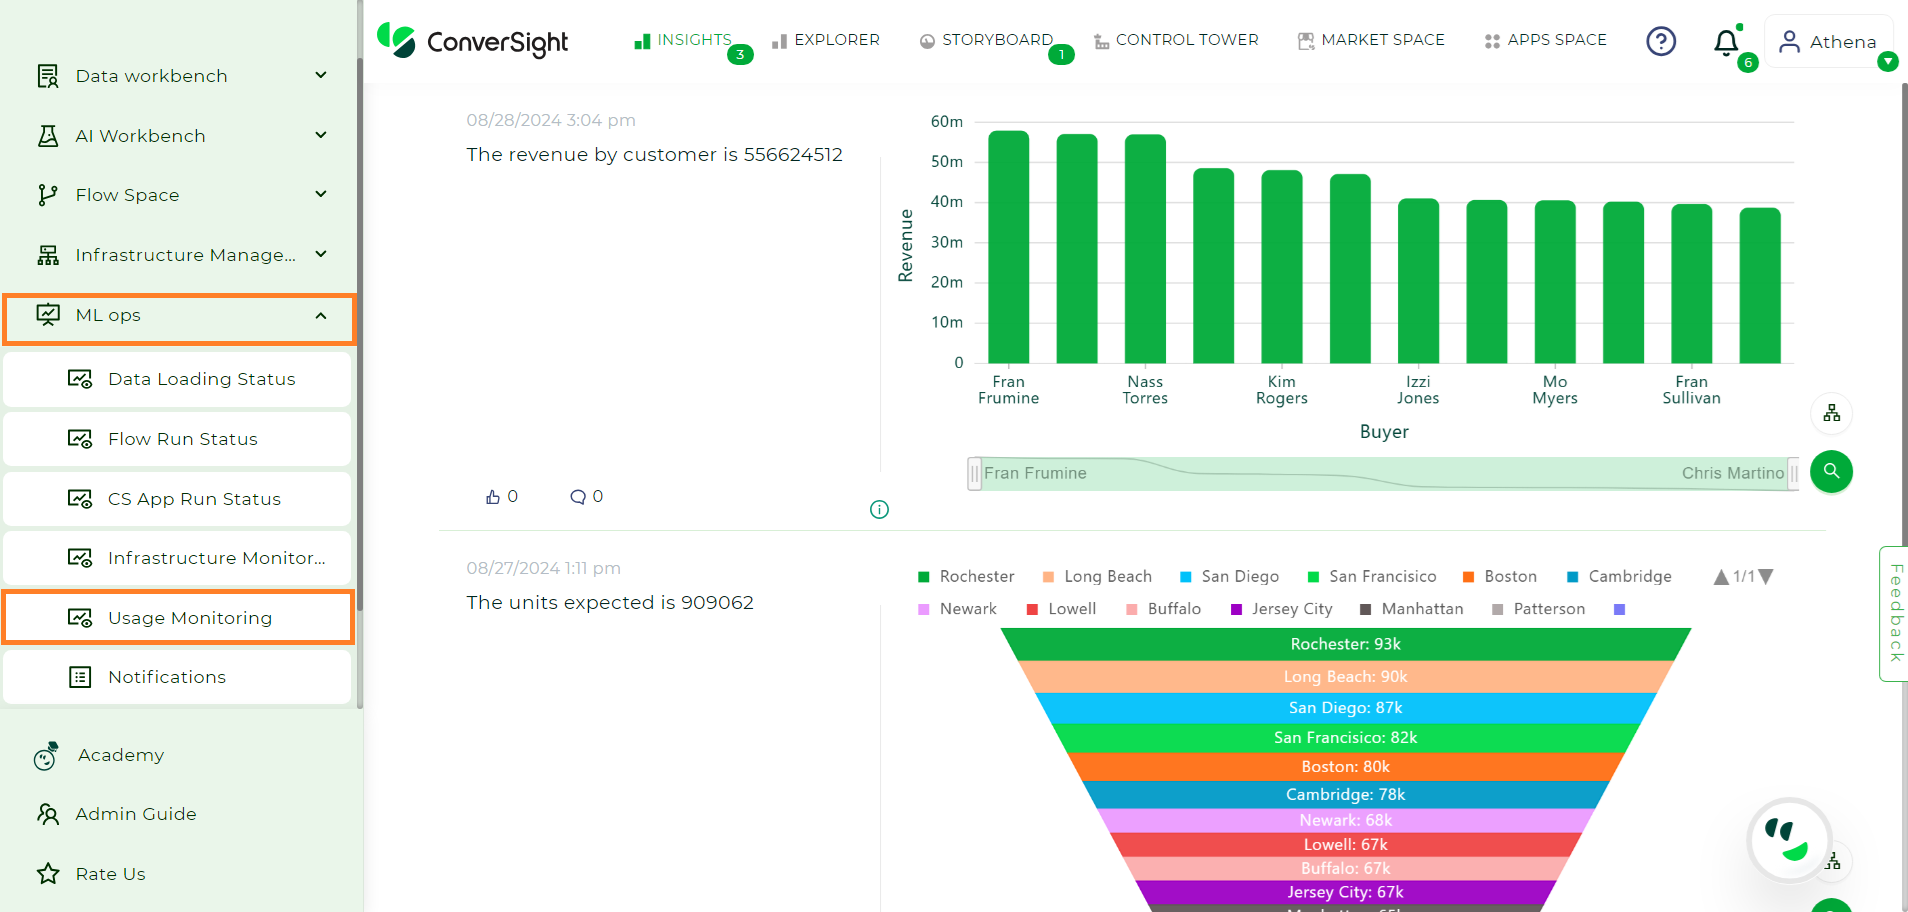
To access the Usage Monitoring feature in the ConverSight Platform, navigate to the configuration section and select Usage Monitoring under ML Ops.
Accessing Usage Monitoring#
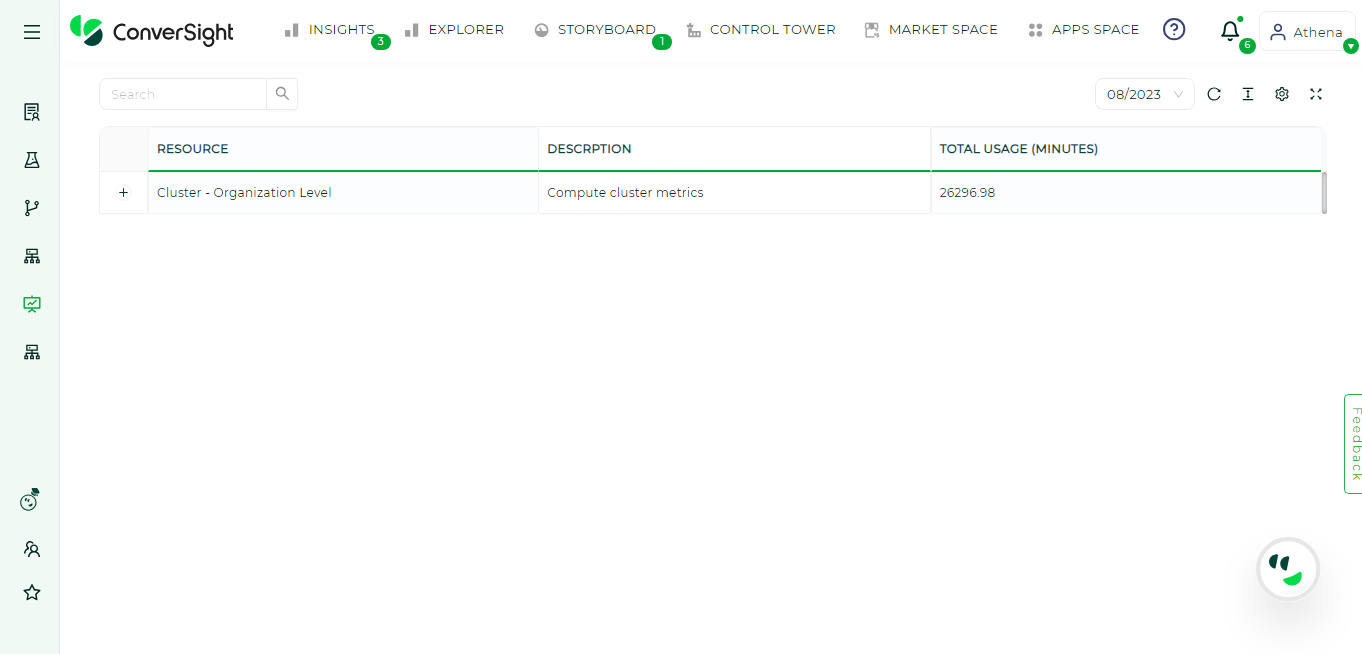
Initially, Usage Monitoring page displays resource names, descriptions and total usage.
Usage Monitoring Page#
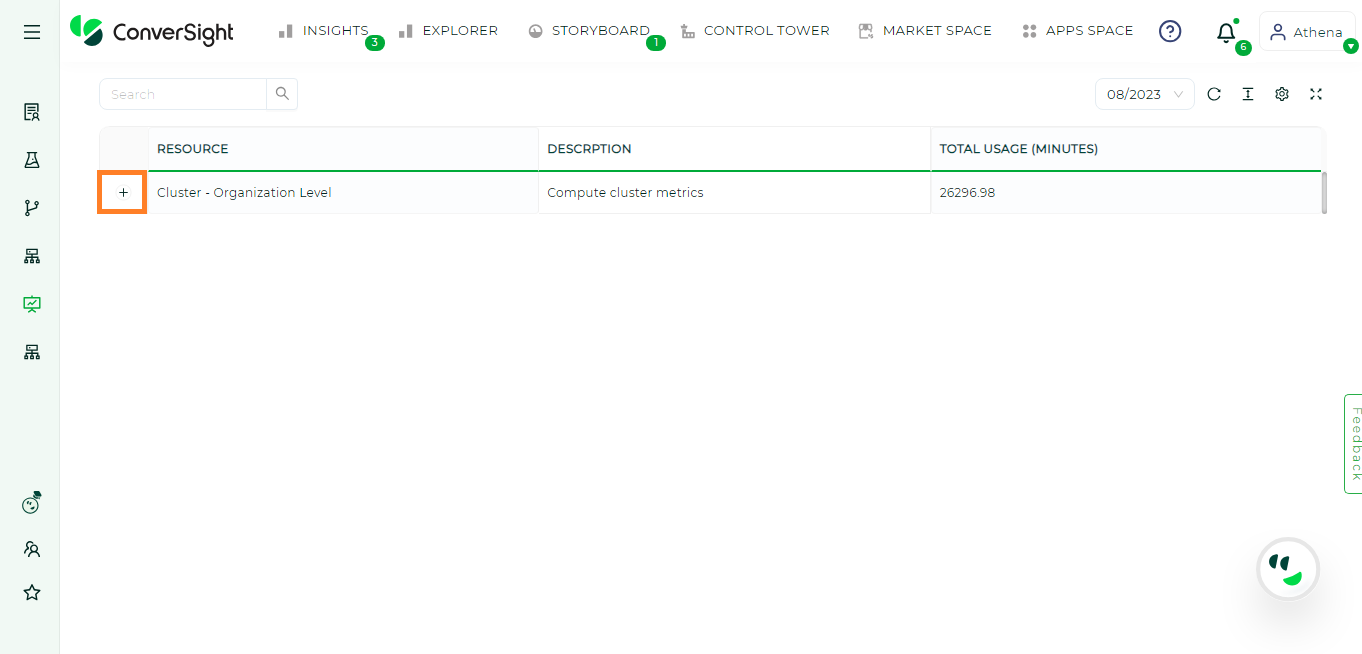
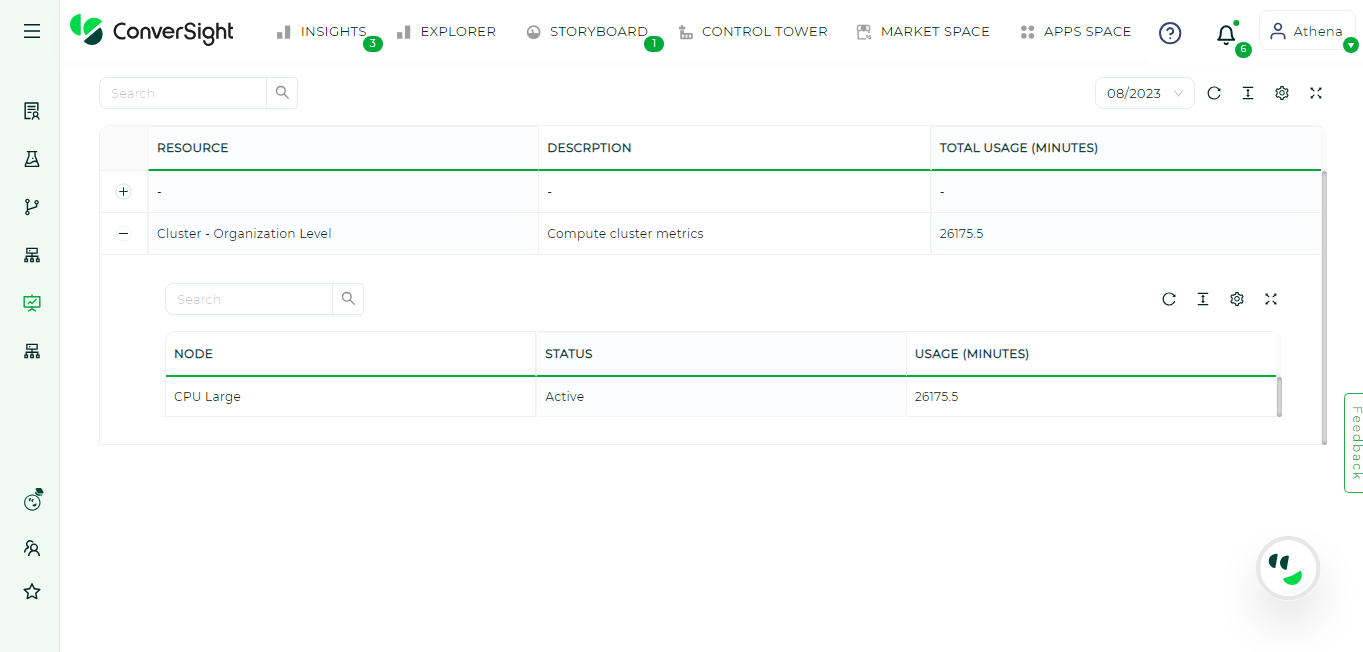
When you click the “+” symbol, the Usage Monitoring page unfolds in an orderly tabular design, furnishing in-depth insights into individual clusters.
Additional Information#
Additional Information#
Here is a comprehensive breakdown of the content present within the Usage Monitoring table.
Name |
Specification |
|---|---|
Resource |
Displays a comprehensive list of currently operational clusters, along with their respective levels of accessibility. |
Description |
Provides a better understanding. |
Total Usage |
Displays the total usage of the resource in minutes providing insights into its performance. |
Node |
Nodes are associated with compute resources like CPU, memory and storage capacity. A node is a single system responsible for storing and processing data. |
Status |
The status column shows the current state of the cluster, such as running, completed or failed. |
In ML Ops, ConverSight’s Usage Monitoring simplifies cluster oversight. It offers real-time insights, aiding quick decisions and efficient management for optimal performance.