Train Athena#
Train Athena is a feature designed to enhance Athena by allowing users to customize the data Athena uses for generating insights. Through this functionality, users can train or re-train Athena with data specific to their business needs, improving the relevance and accuracy of its responses. This training process enables Athena to adapt by learning from Subject Matter Expert (SME) guidance, custom synonyms, specific phrases and additional data fields introduced in ConverSight. By integrating this information, Athena becomes better equipped to generate accurate, context-specific insights and improve natural language query responses.
Accessing Train Athena#
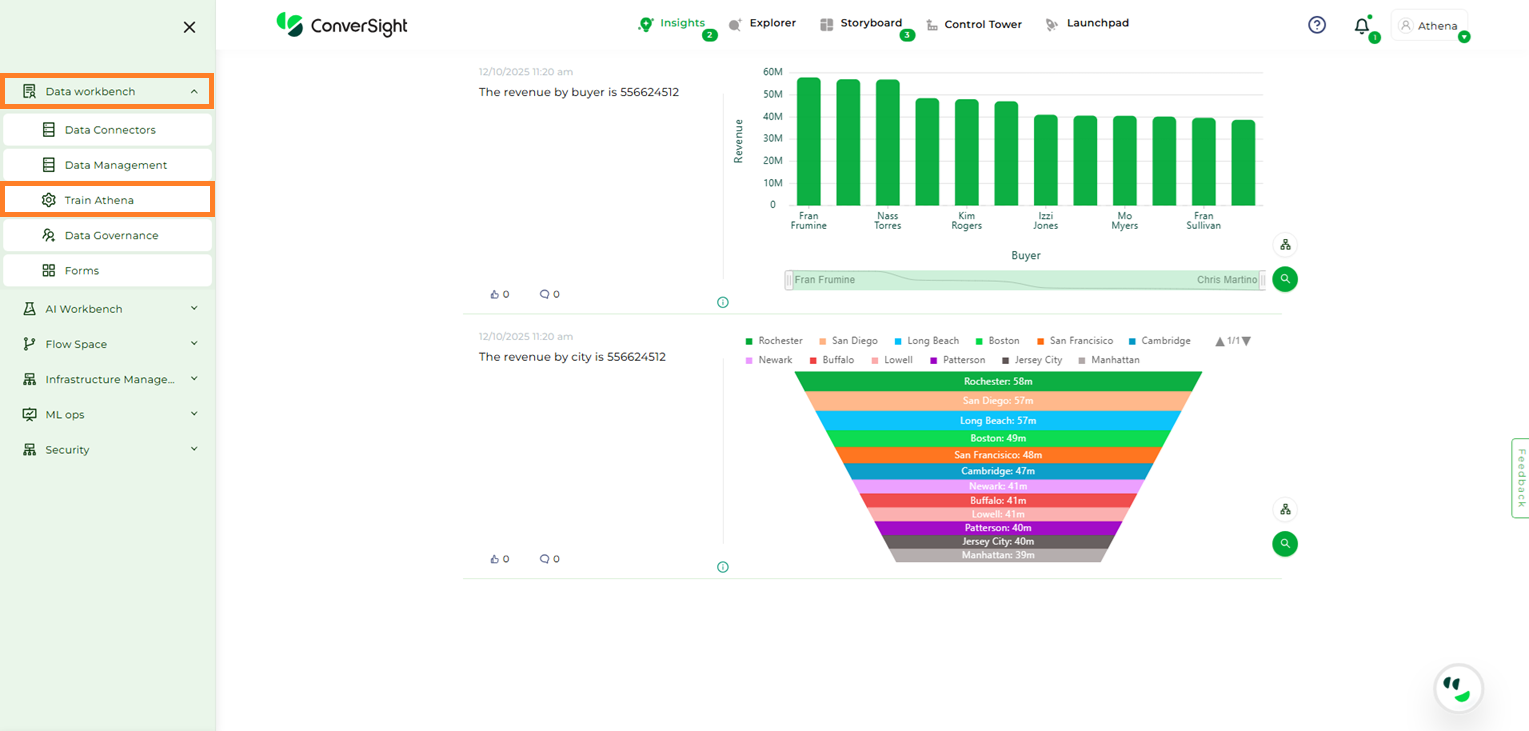
To access Train Athena, navigate to the Configuration panel and select Train Athena from the Data Workbench menu.
Train Athena Option#
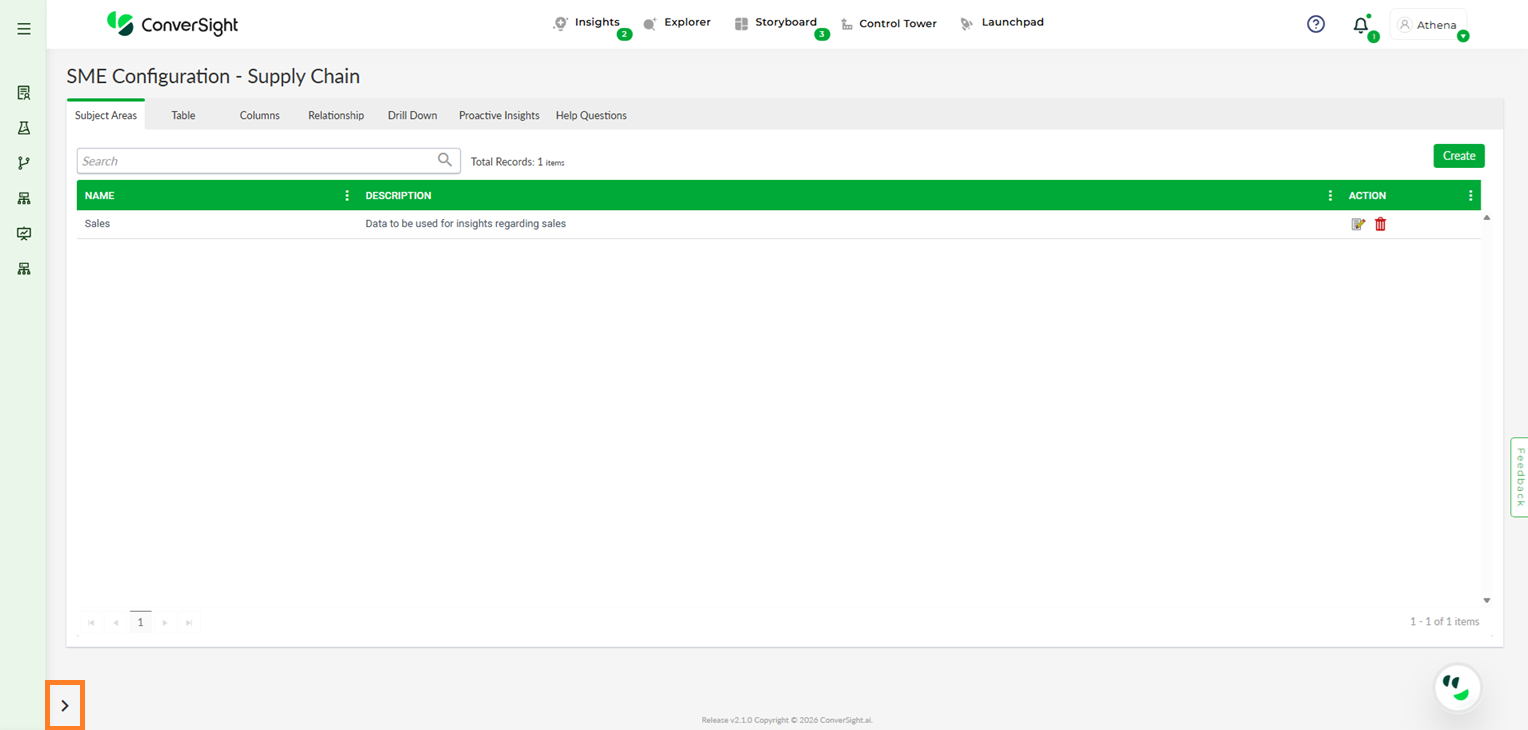
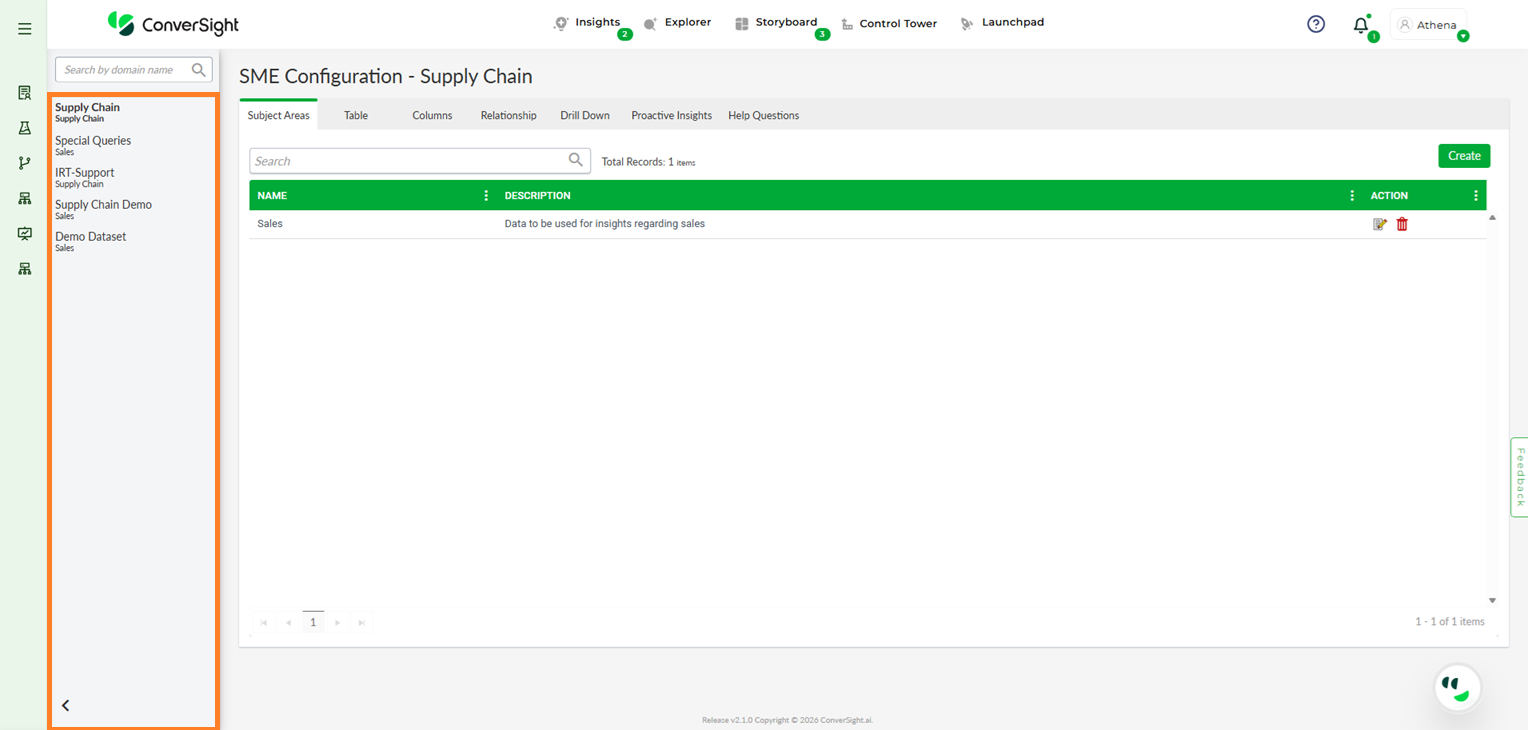
To switch to a different dataset, click the Expand icon in the bottom-left corner. This displays a list of all available datasets, allowing you to select the required one.
Expand#
Expand#
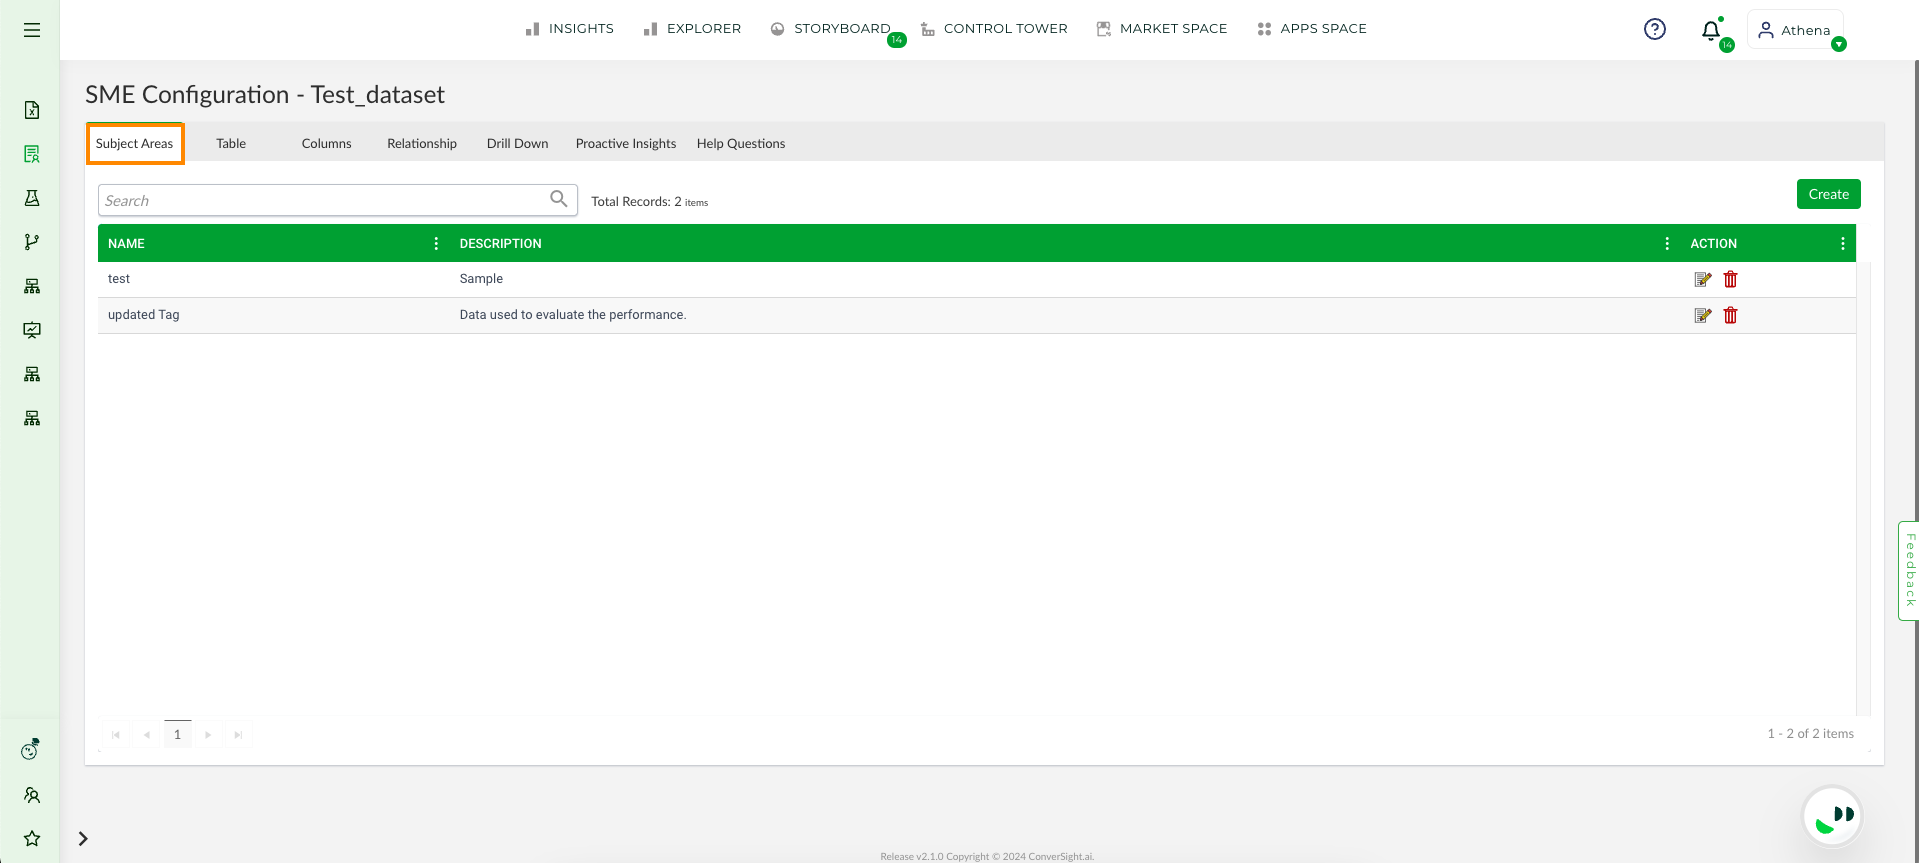
The tabs on the SME Coaching page are crucial in teaching our Athena, they are:
Subject Areas
Tables
Columns
Drill Down
Proactive Insights
Help Questions
Relationship
Subject Area#
The Subject Area serves as a classification system for organizing dataset tables into distinct categories, such as sales, finance or other relevant groups. Grouping tables according to their subject area provides clear and immediate insight into the content and context of the data within each table. This organization not only enhances understanding but also streamlines various processes. For example, when generating reports, having tables categorized by subject area simplifies the process, as it ensures that all relevant data is easily accessible within the same group. This systematic approach reduces the complexity of data handling and improves efficiency in data management and reporting tasks.
Subject Area#
The following are the steps to create a Subject Area:
Step 1: Click on the Create button.
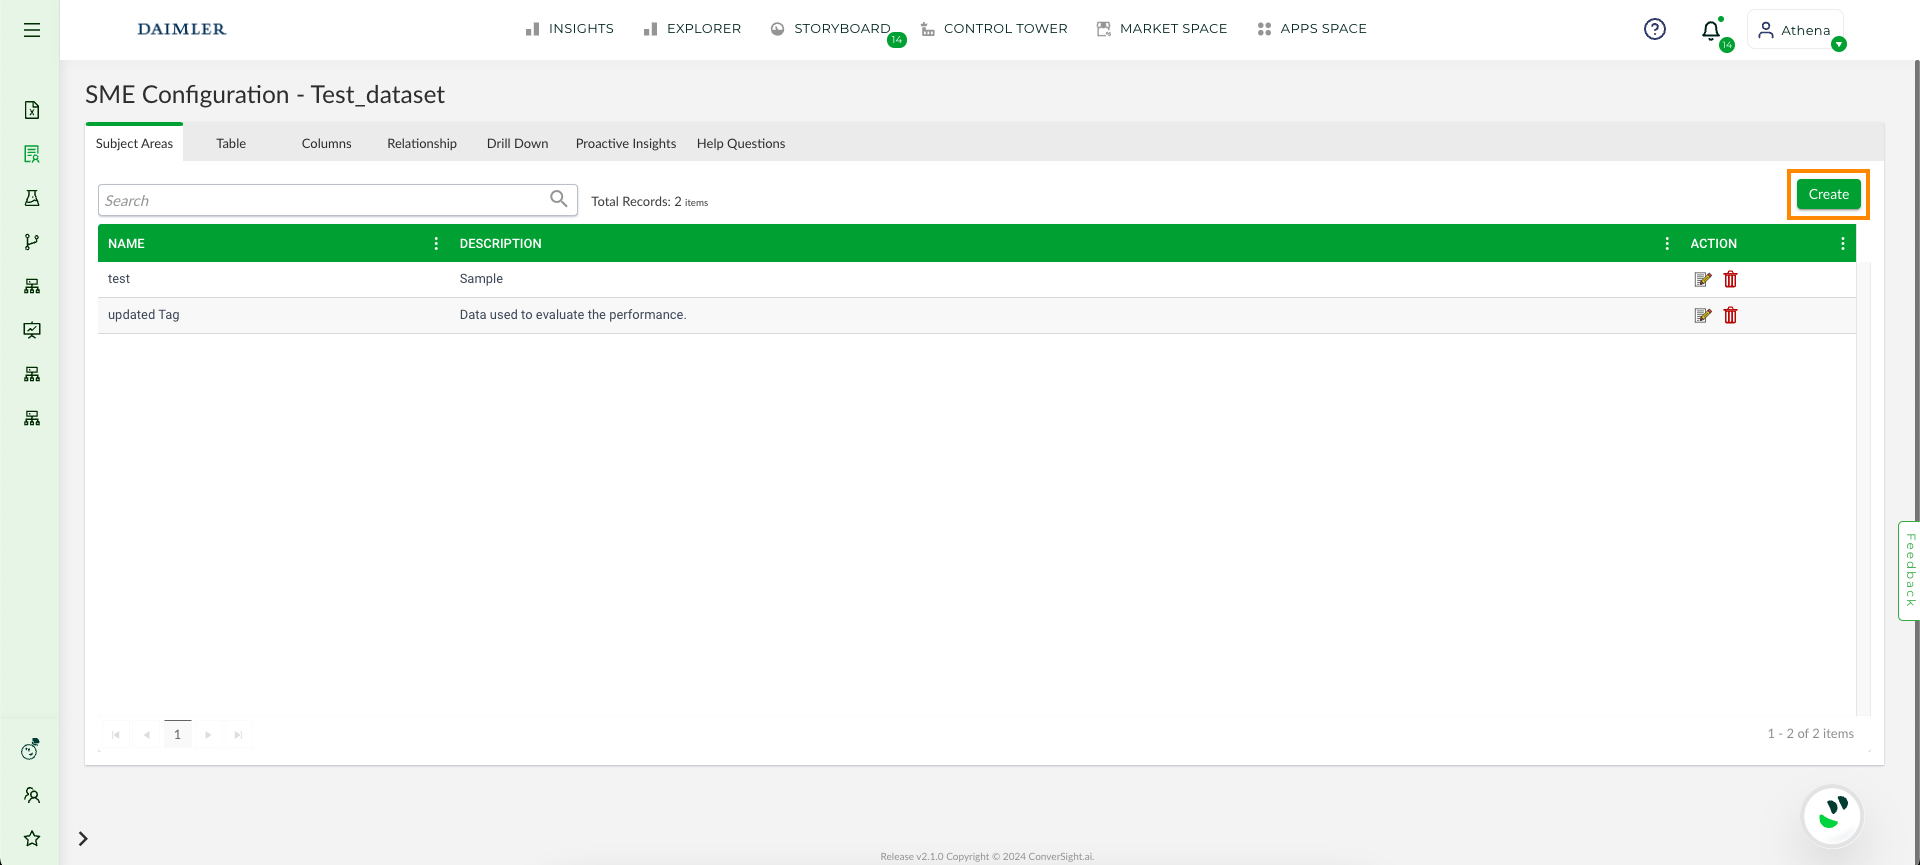
Create Button#
Step 2: Provide a Name and Description for your subject area to enhance clarity and understanding.
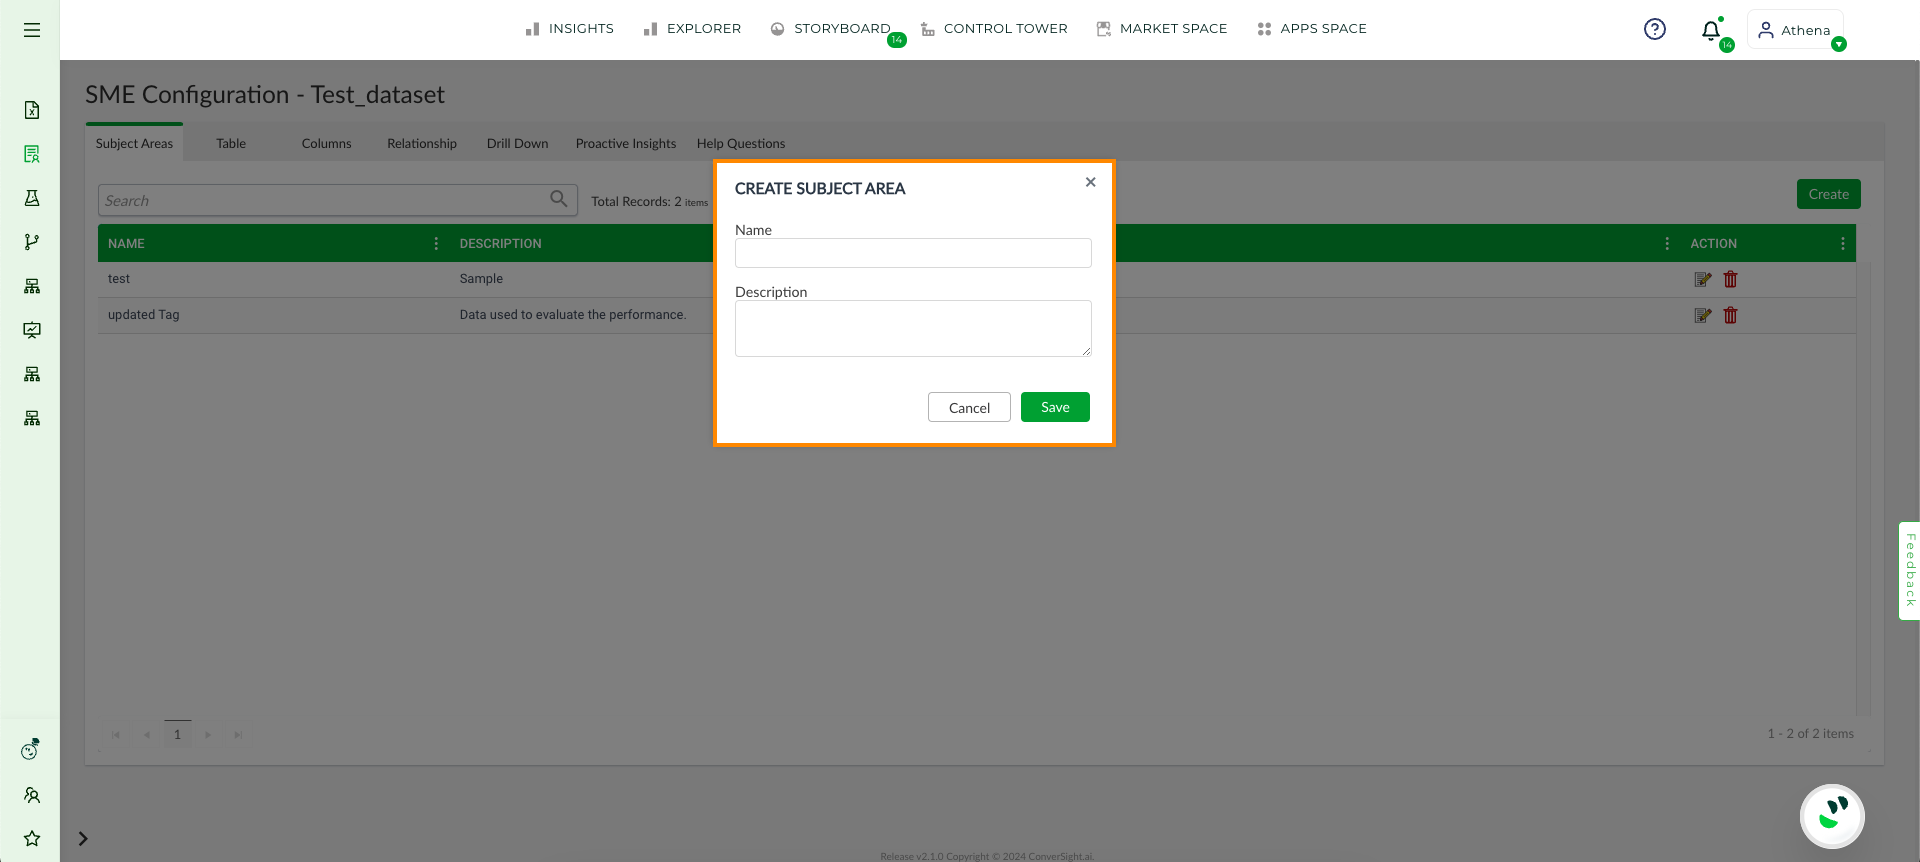
Create Subject Area#
Step 3: After completing the process, click on the Save button to successfully add the subject area.
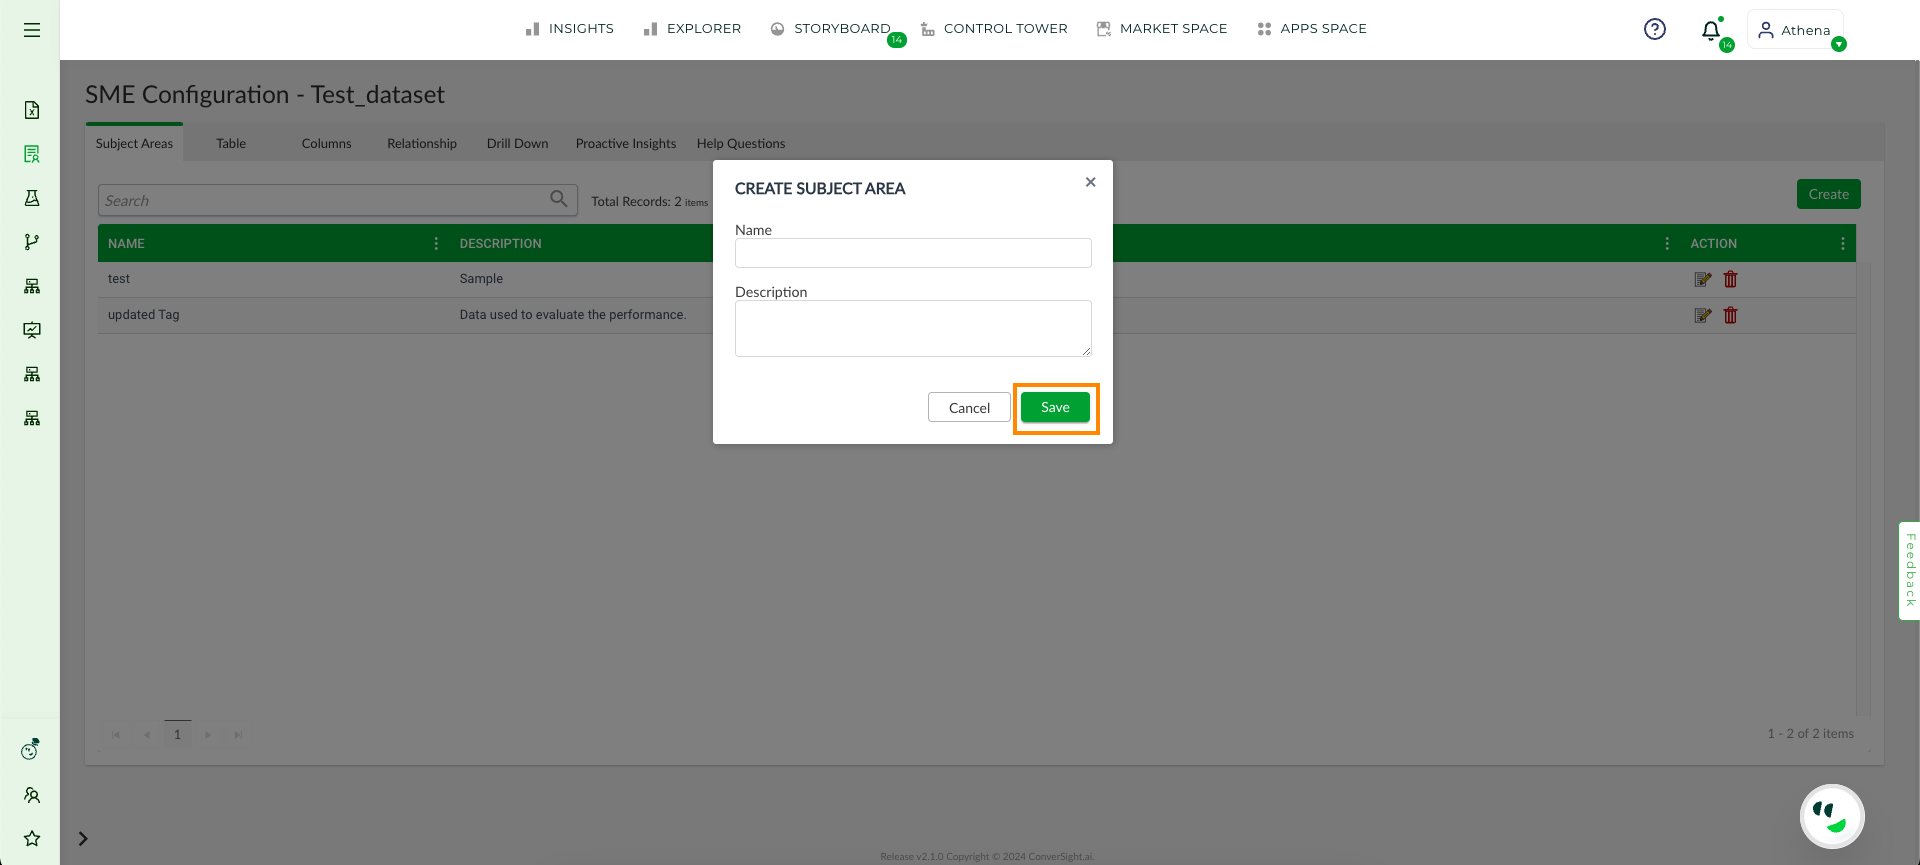
Save Button#
In the Action column for each Subject Area, users have the options to Edit or Delete these groupings. The Edit function enables users to modify the name and description, ensuring that the Subject Area accurately represents its contents.
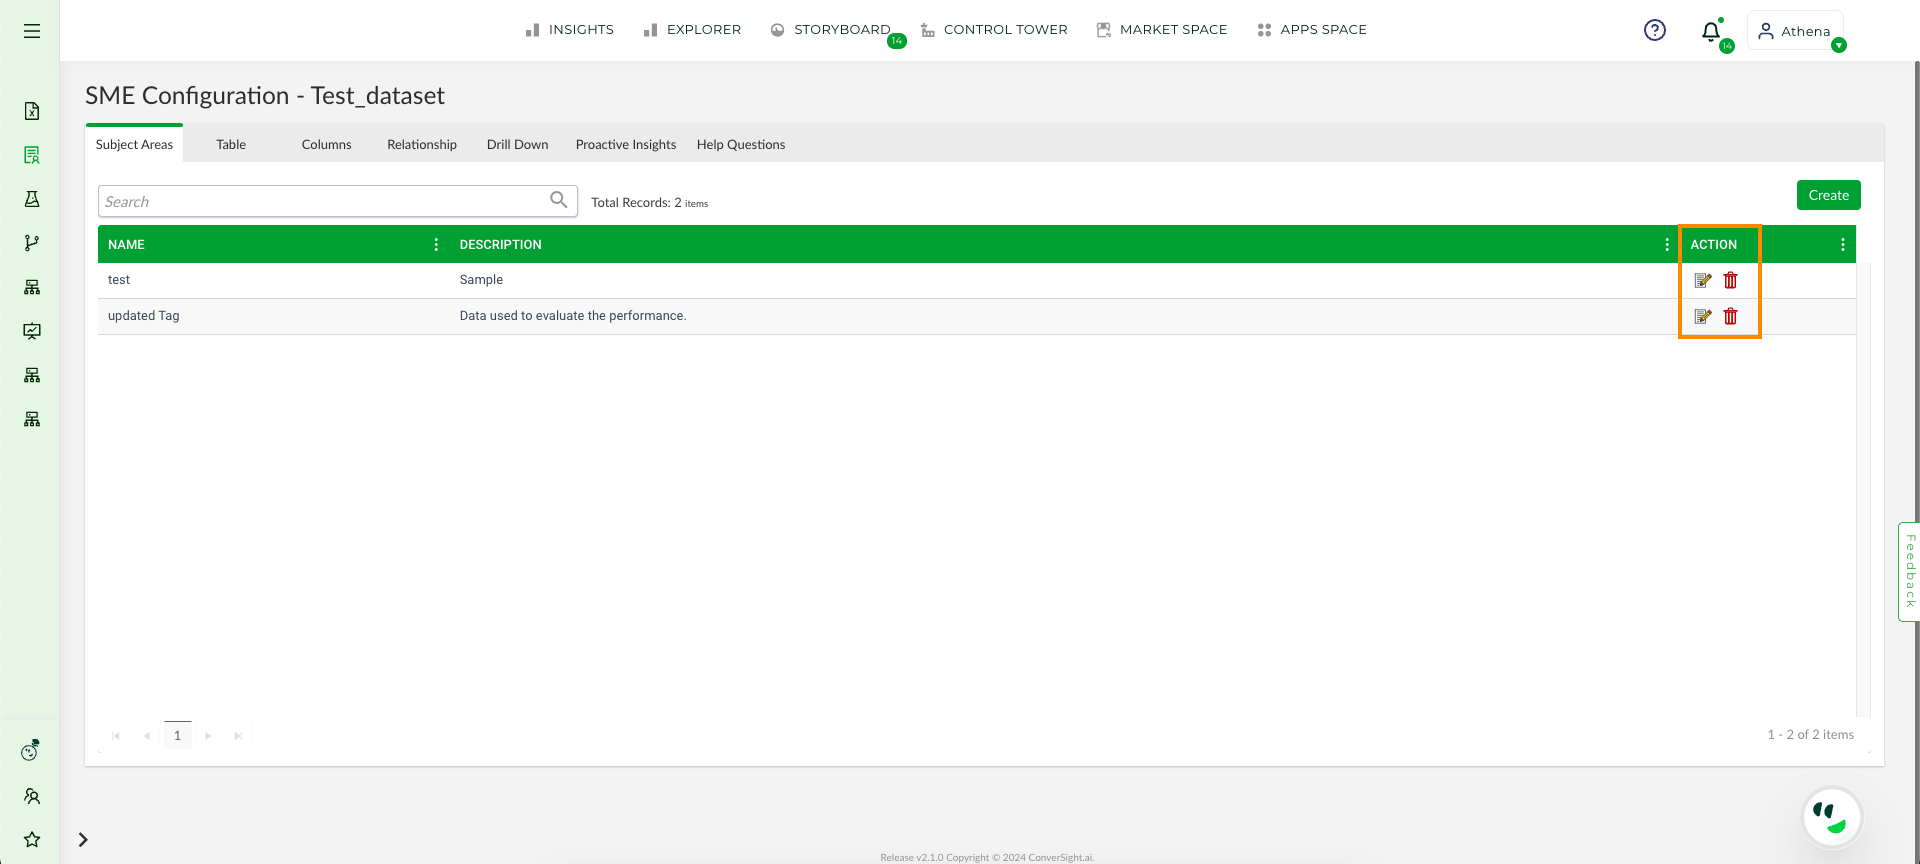
Action Column#

Edit#
Additionally, the Delete option enables users to remove any Subject Area that is no longer relevant.
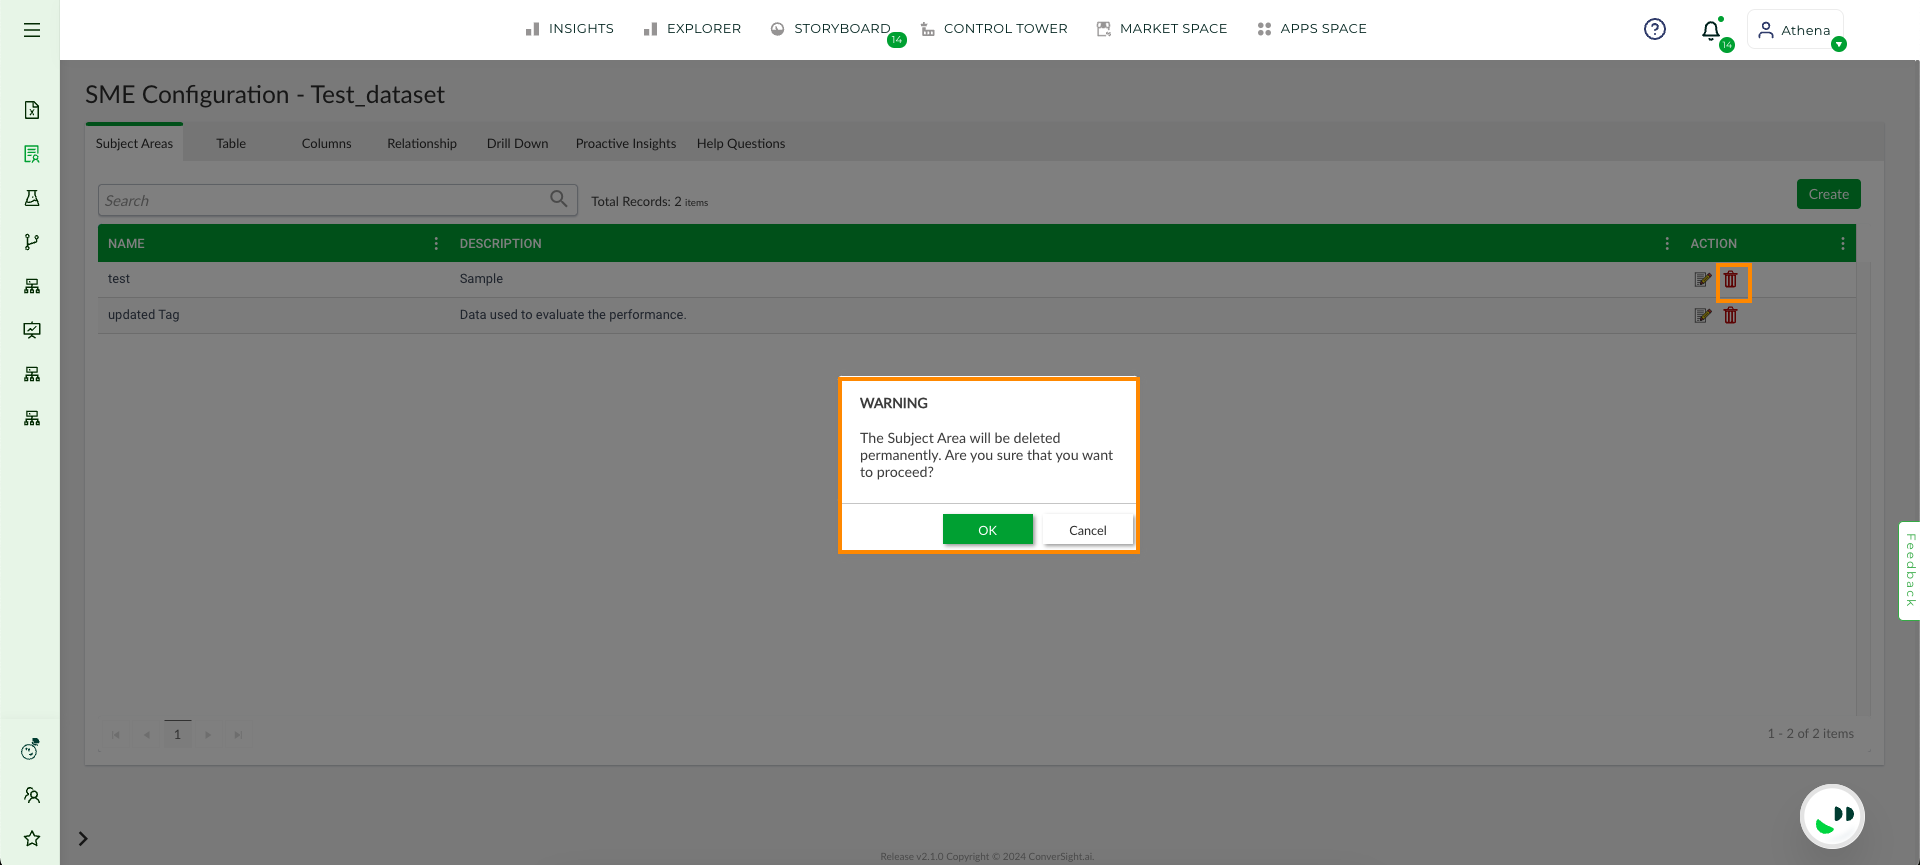
Delete Button#
Table#
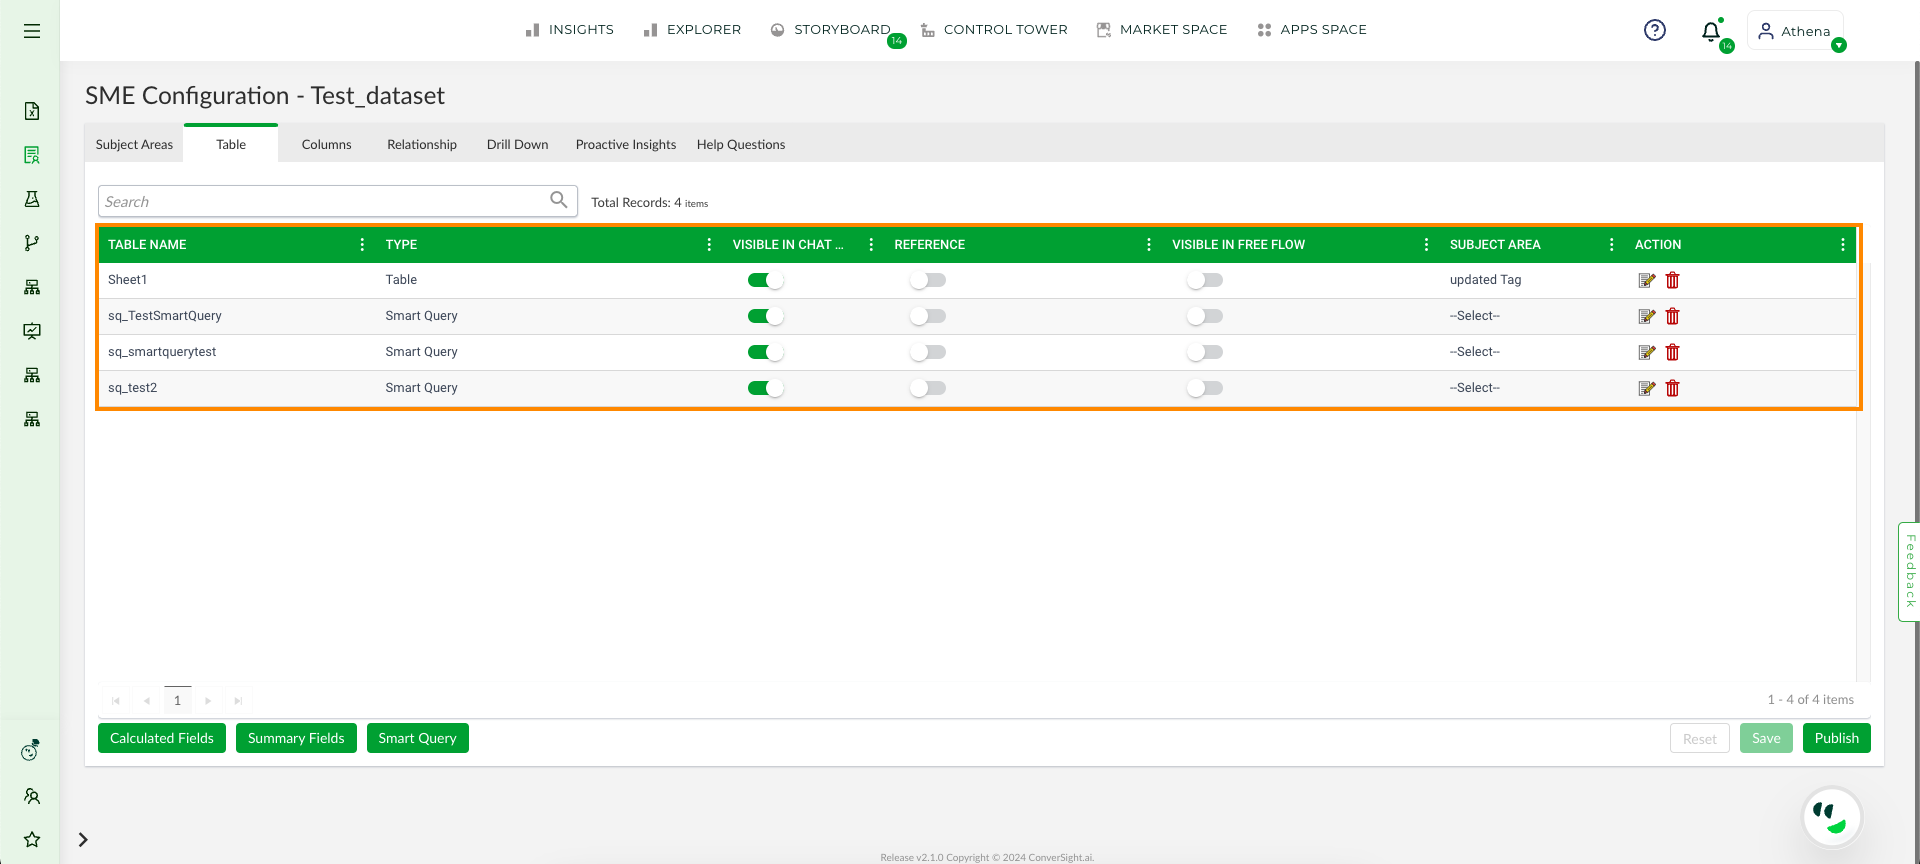
The Table section is where you can view and manage all the tables that are part of the dataset.
Table#
Column |
Description |
|---|---|
Table Name |
The name of the table within your dataset. |
Type |
The type or classification of the table. |
Visible in Chat or Explorer |
Enabling the toggle makes the selected table accessible and visible in Athena Chat and Explorer. This feature manages the table’s visibility to users. |
Reference |
Enabling the Reference option for a table prevents it from forming relationships with other tables and excludes it from Athena queries, ensuring it remains isolated from relational and analytical processes. |
Subject Area |
You can assign a subject area to a table by selecting it from the dropdown list of subject areas created in the Subject Area tab. This helps organize tables into relevant groups or domains, and you can assign multiple subject areas to a single table based on its relationships. |
Visible in Free Flow |
Enabling the toggle ensures that only relevant tables are included in Free Flow, contributing to the insights generated during analysis. |
In the Action column, the Edit icon allows you to edit the name and description of the table. Once you have entered the desired name and description, click on the Save button to apply and store these changes.
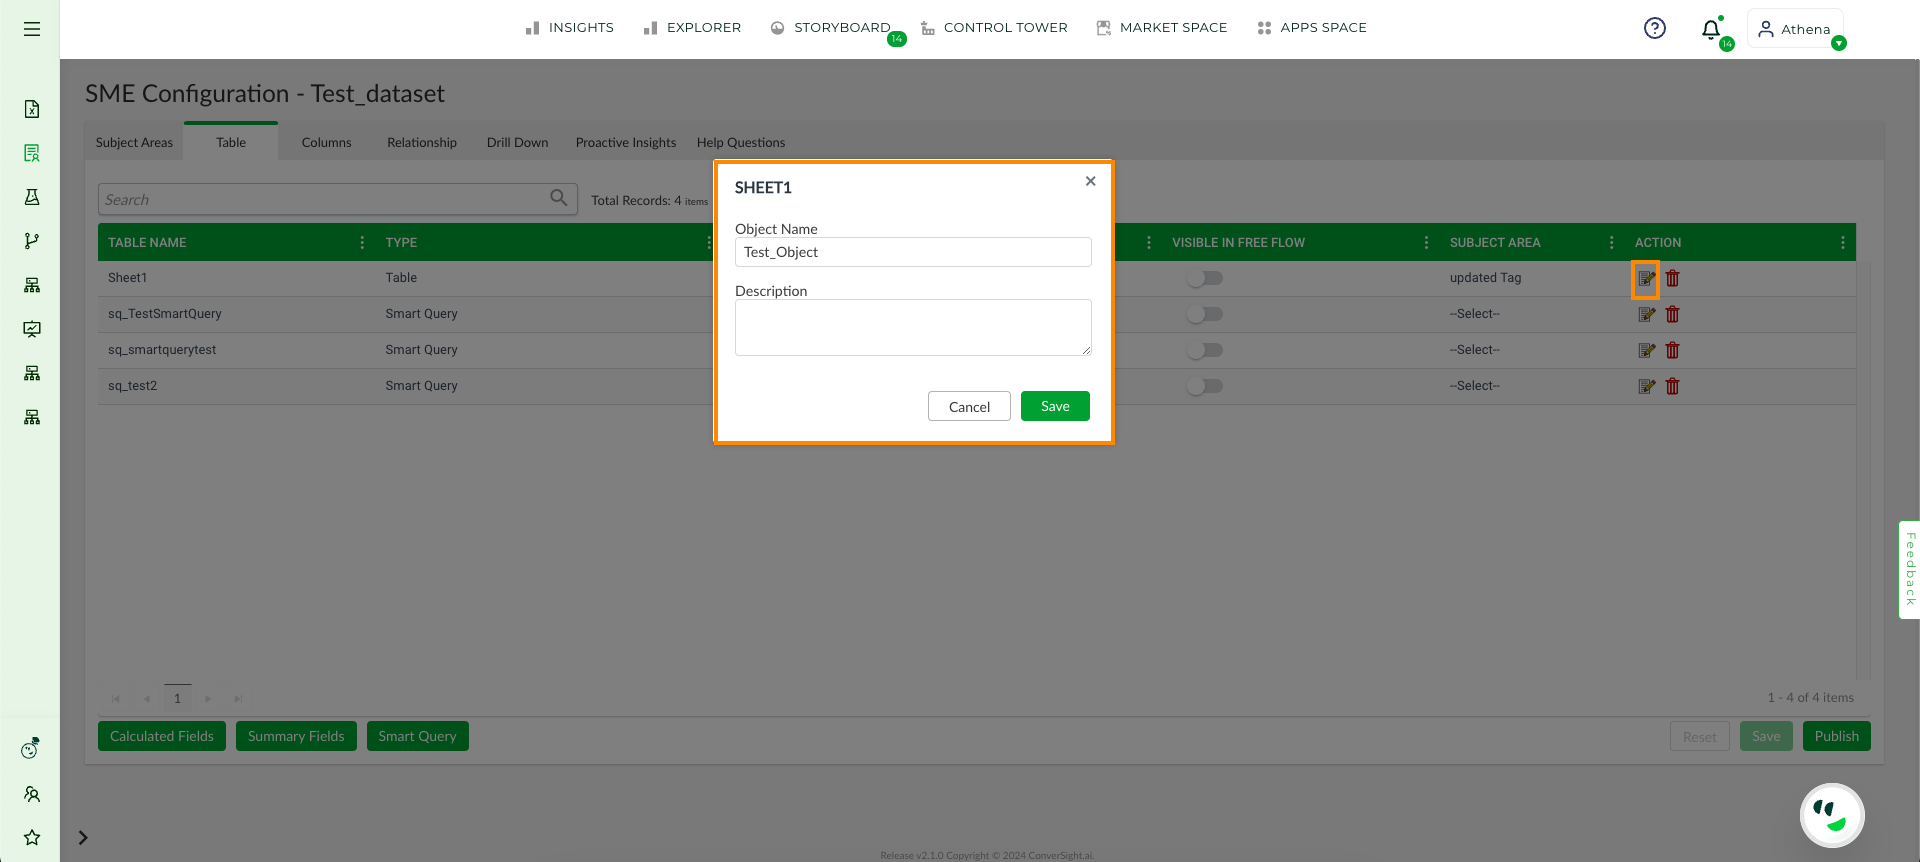
Edit#
Delete icon allows you to remove a table from your dataset. Selecting this option will permanently delete the table, so it’s important to ensure that you no longer need the table or have backed up any necessary data before proceeding.
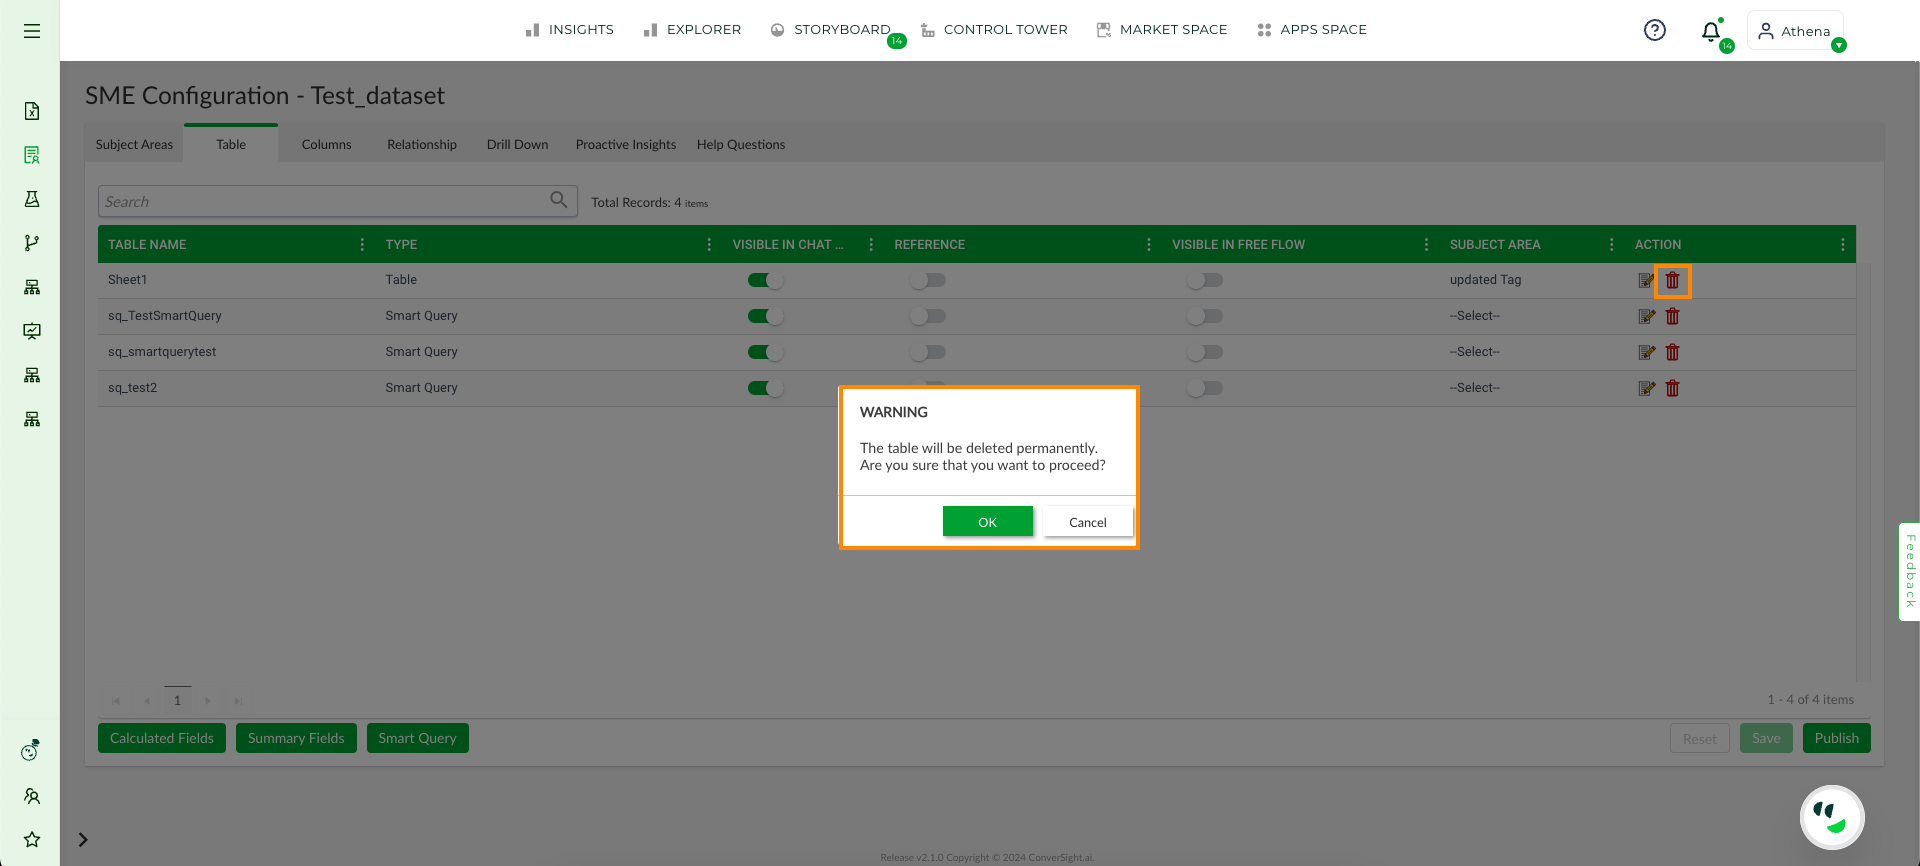
Delete#
NOTE
Deleting the table from here does not remove it from your dataset itself.
Columns#
The Columns tab holds significant importance in training Athena on data. It provides crucial information about the categories and types of columns, as well as appropriate synonyms for column names to enhance Athena’s efficiency. In essence, the Column serves as the foundation of Athena’s knowledge.
In addition to its foundational role, the Columns tab also offers advanced functionalities that contribute to the generation of more efficient and accurate insights. These include options to rank columns based on their significance, as well as the ability to set critical columns and default options. These features help Athena to prioritize relevant data and streamline the analysis process, leading to faster and more accurate insights.
The Columns tab presents data in a tabular format, including information such as table names, column names, categories, types, unit, vocabulary, default option and action field. Additional fields are also available and can be accessed through the three dots located next to each field name. Let’s see each field.
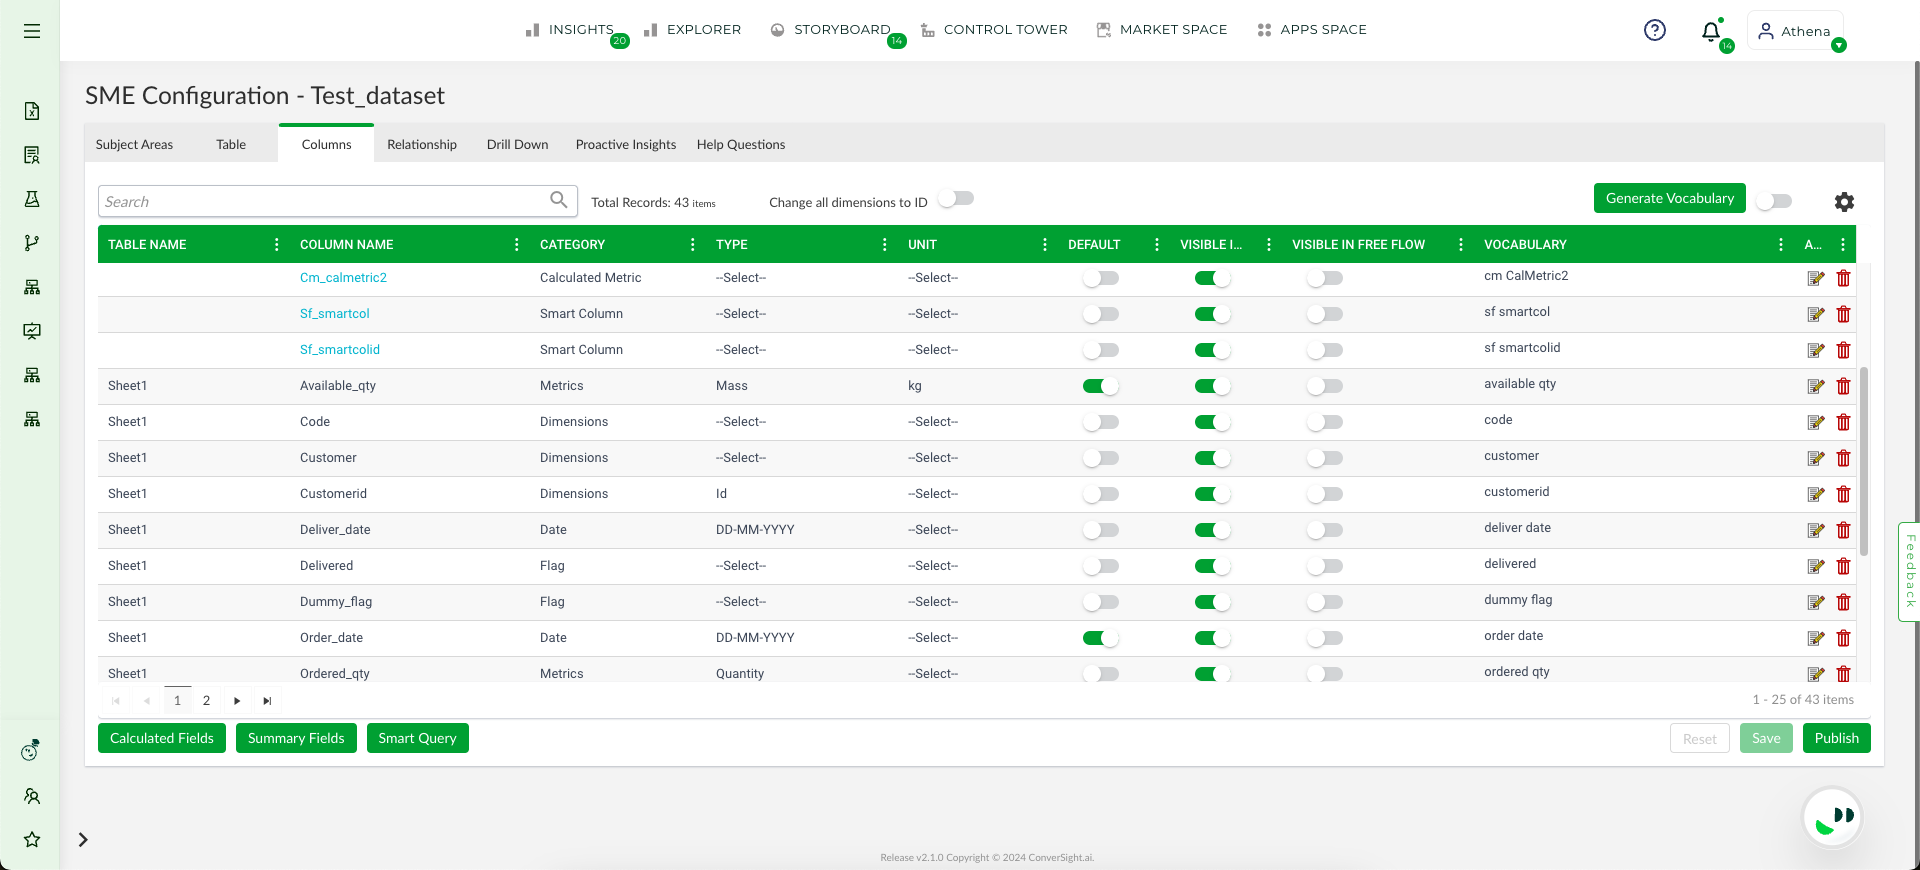
Columns#
Let us explore each field and their specific functions:
Table Name
Under the Table Name, one can find a list of tables. Nonetheless, certain columns do not have a table name since they are custom fields made by users for their convenience and future reference. We will discuss this further in upcoming topic on Create Custom Field.
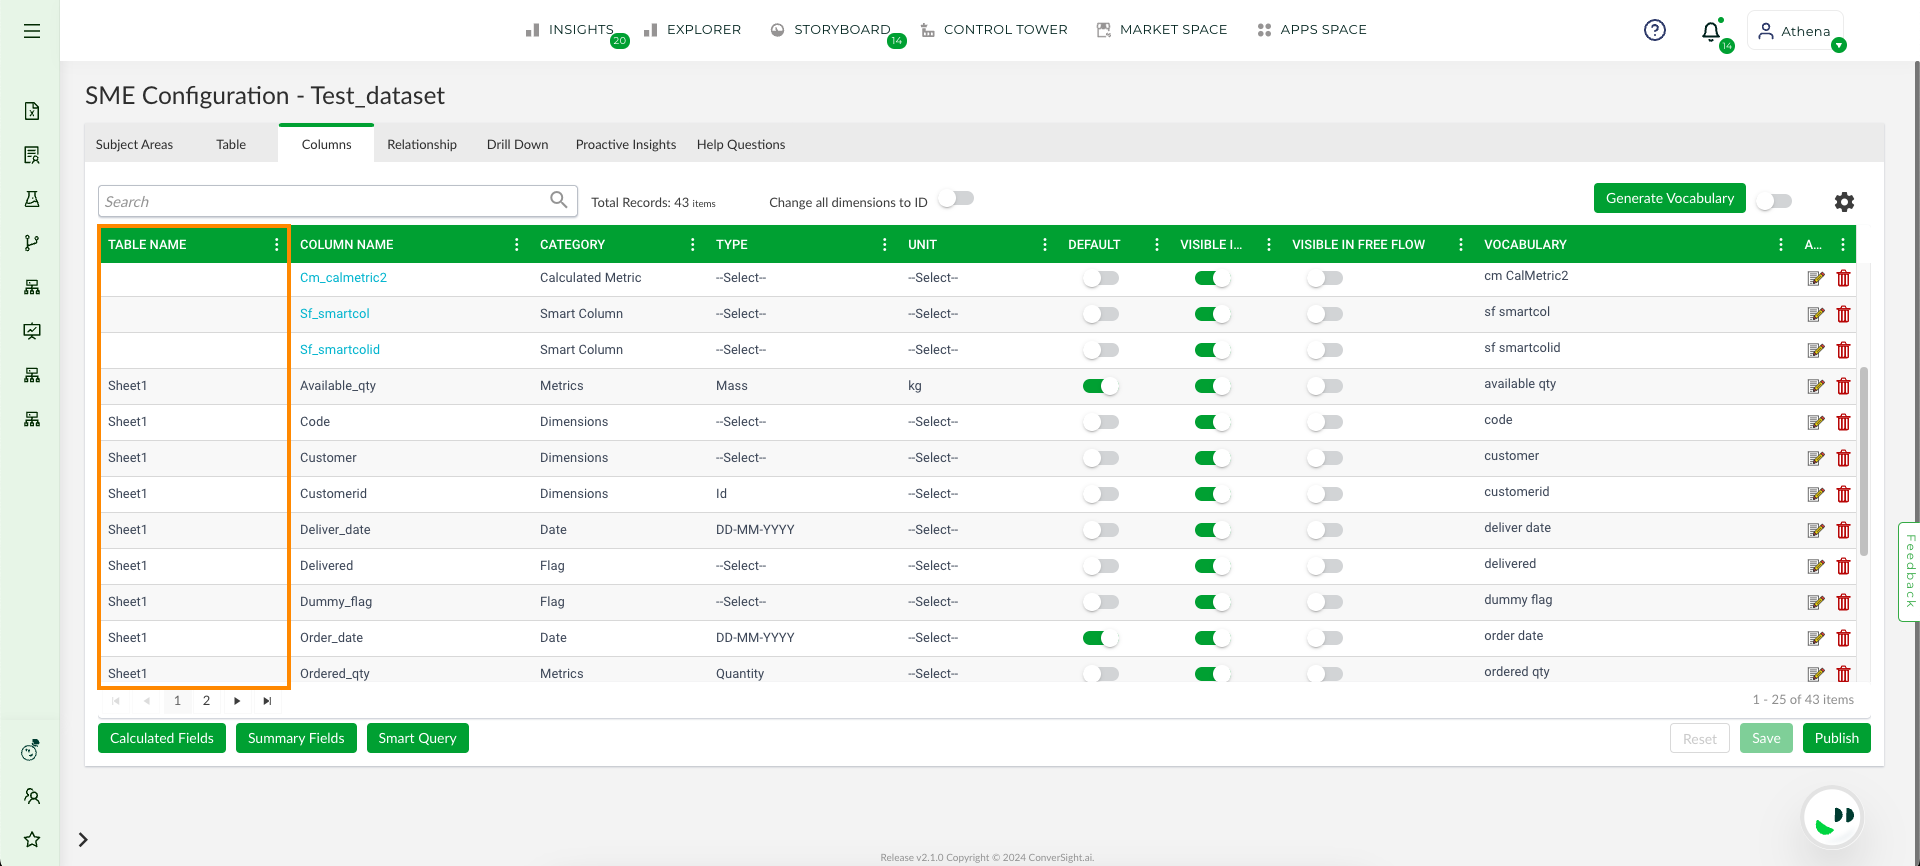
Table Name#
Column Name
The Column Name field exhibits all the columns present in the dataset, including some that are highlighted which are custom field column names. Additionally, some columns have a ![]() icon to signify that they are password protected and not accessible to all users.
icon to signify that they are password protected and not accessible to all users.
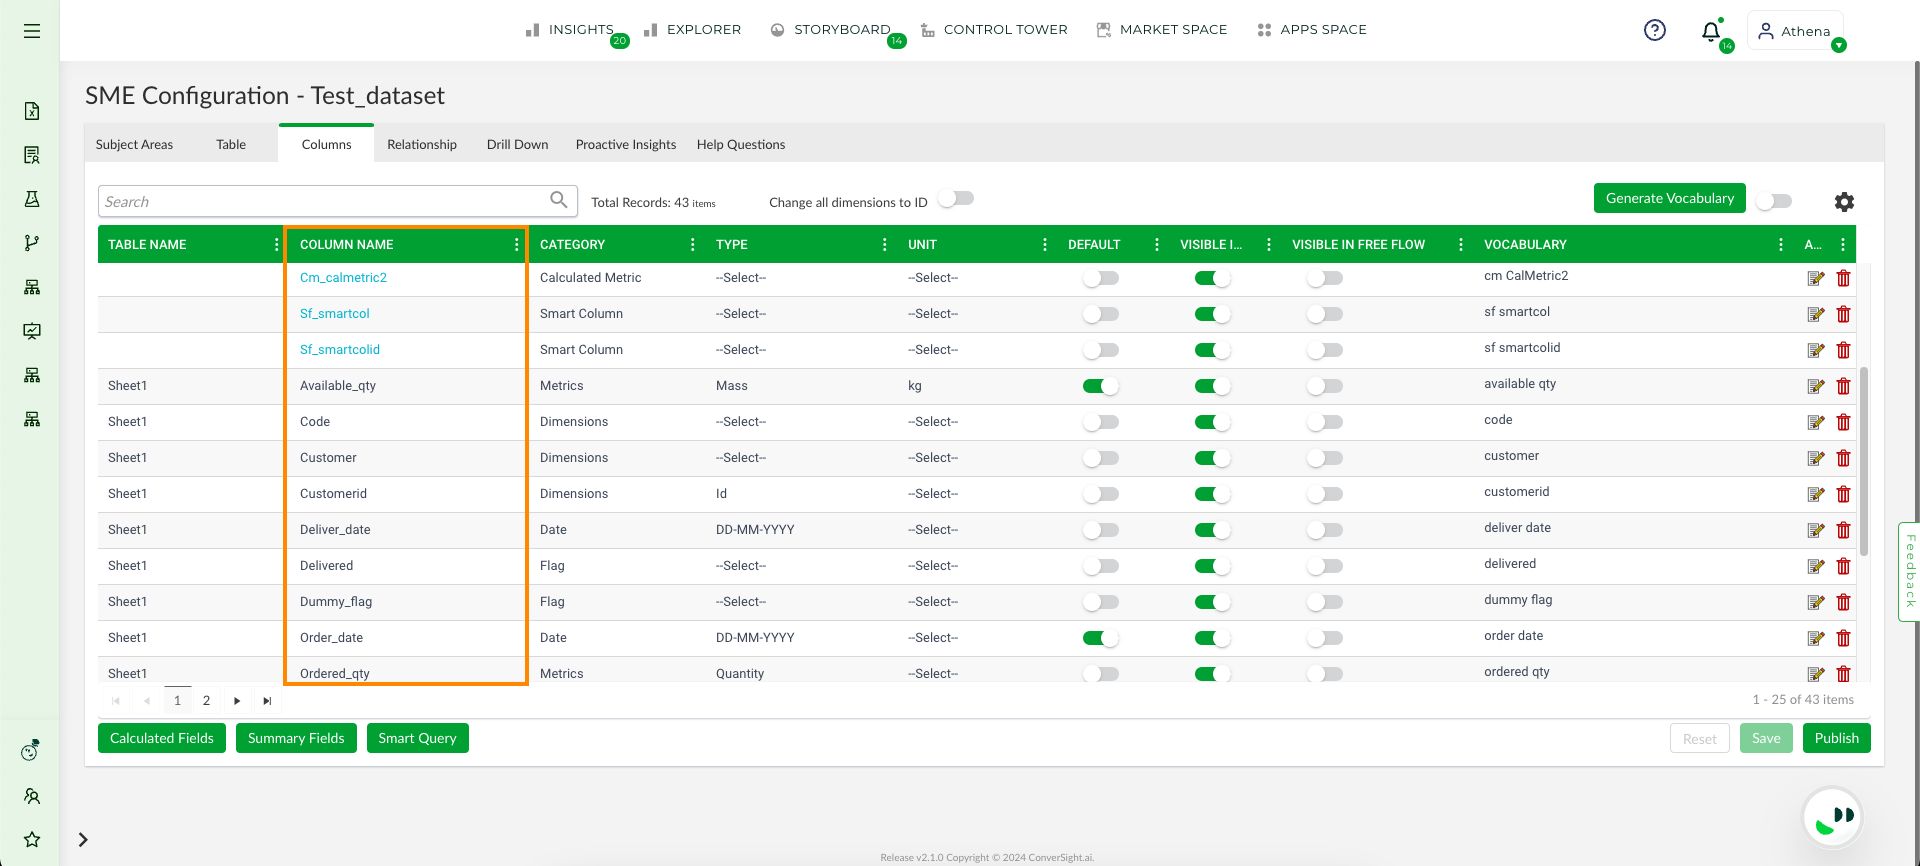
Column Name#
Category
The Category field is used to assign a category to each column based on its type. The available categories include metrics, dimensions, dates and flags. Some columns may be highlighted with categories such as calculated metrics, calculated dimensions and calculated dates, indicating that they are custom fields created by users. Moreover, users may also encounter smart queries and smart columns that are also user-created.
Dimensions: Categorical value-containing columns should be assigned as dimensions.
Metrics: Columns containing aggregable values can be assigned as metrics.
Date: Columns containing timestamps are assigned as Date.
Flag: Columns containing Boolean values such as 0 and 1 or yes and no or true and false should be assigned as flags.
NOTE
Mathematical operations cannot be executed on columns with dimensional data.
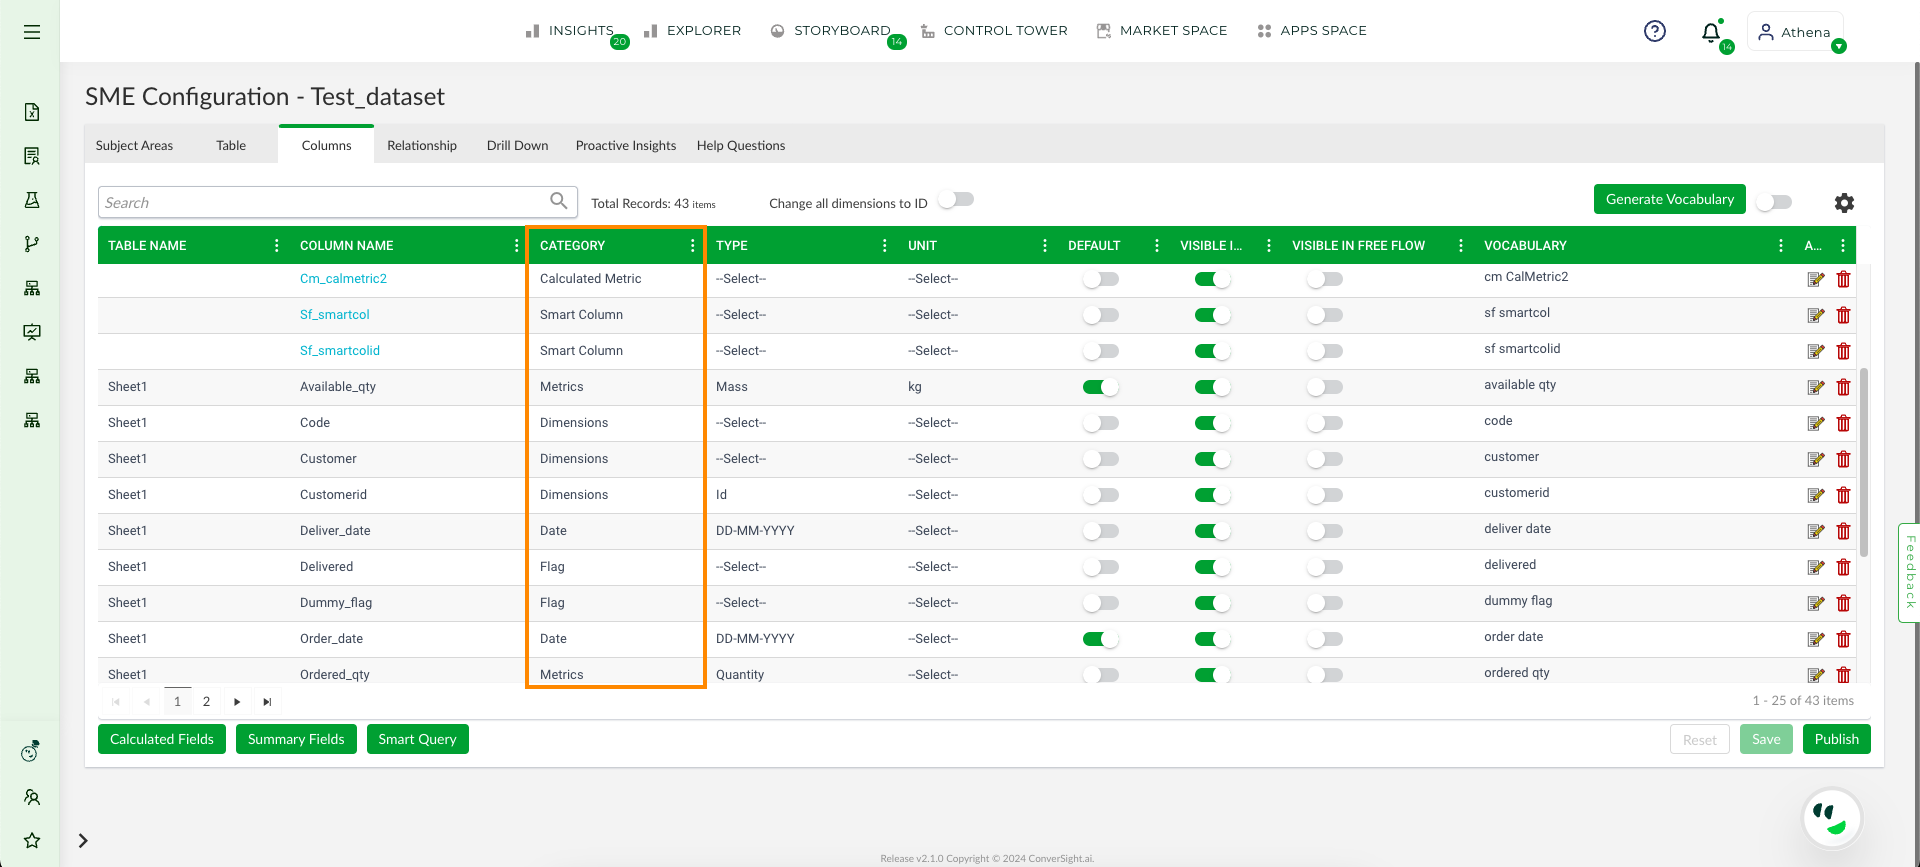
Category#
Type
The options available in the Type field are updated based on the selected category. While the category provides a generalized classification of the column, the Type offers more specific information about the data it contains.
Category |
Type Available |
|---|---|
Metric |
Quantity, Currency, Duration, Distance, Volume, Mass, Temperature, Area and Fraction |
Dimension |
Distance, Volume, Mass, Temperature, Area, Duration, Quantity, Id, Image, Geo, Notes, Quantity and URL |
Date |
DD-MM-YYYY, MM-DD-YYYY, YYYY-MM-DD, YYYY-DD-MM, DD-MM-YYYY HH:MM:SS, MM-DD-YYYY HH:MM:SS, YYYY-MM-DD HH:MM:SS, YYYY-DD-MM HH:MM:SS |
Dimensional Types
ID: When the Type field is configured as ID, the data associated with this type is excluded from loading into the knowledge base. One option available is to convert all dimensions to ID
 . Which prevents the entire dataset from being loaded into knowledge base.
Geo: If a column contains geographical data, such as latitudes and longitudes then, assign the Type field of the column as “Geo.” This setting interprets the latitude and longitude values, pinpointing locations on the map.
URL: Columns containing URLs should be labeled with the URL type. When queried, Athena will retrieve the clickable links present in the respective column. If the URL is labelled with a type other than URL, it will be treated as a string.
Image: Image URLs should be categorized as images to view them in the image format
Notes: Columns containing descriptions are to be assigned type field Notes.
Unit
Similar to the Type field which is depended on the chosen Category, the Unit field is also depended on the chosen type and the unit is loaded accordingly based on the type selected previously.
Type |
Unit Available |
|---|---|
Currency |
$, €, ₹, £, ¥, ₩, AED, CHF, CNY, DJF, DZD, EGP, HKD, IQD, IRR, JOD, KMF, LBP, LYD, MAD, MMK, MUR, OMR, QAR, RUB, SAR, SDG, SOS, SYP, TND, UAH, YER, R, KES, MYR, THB, KMR |
Duration |
Minutes, Hours, Seconds, Days, Weeks, Months, Years |
Quantity |
No Units Available |
Distance |
cm, m, km, inches, feet, yards, miles |
Volume |
m3, kb, mb, gb, L, mL, gal, US gal |
Mass |
g, mg, kg, lbs, t, kt, Mt, oz |
Temperature |
0C, 0F |
Area |
m2, sq ft, hectares, acres, yards |
Fraction |
% |
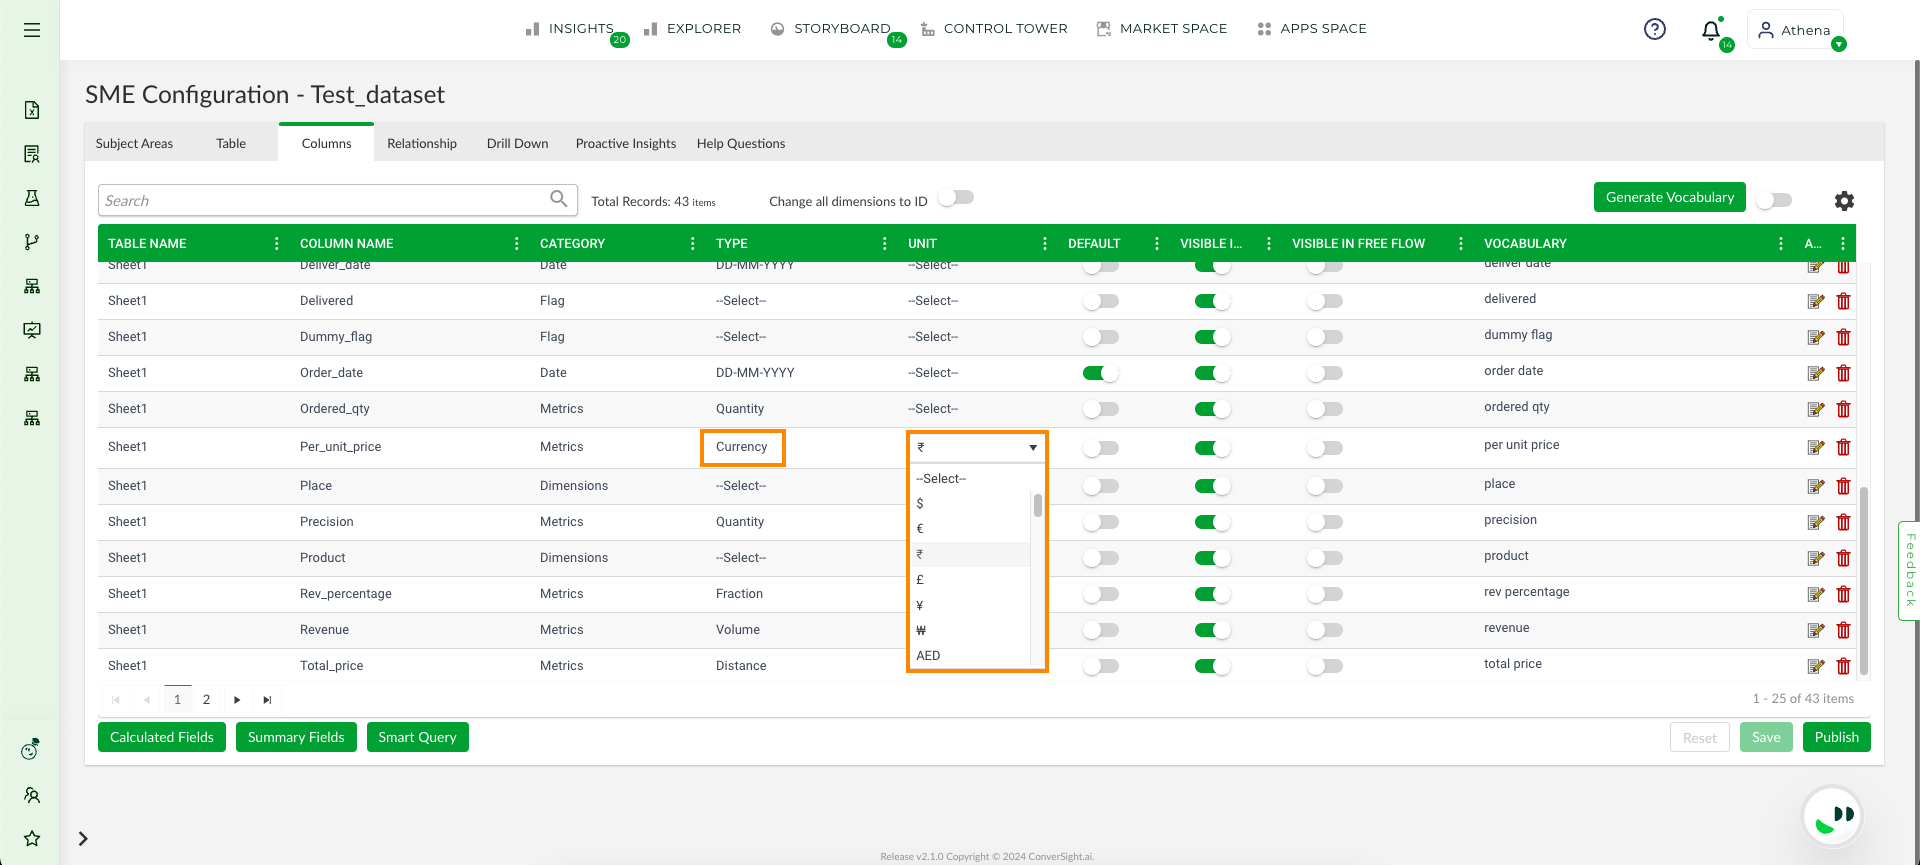
Unit#
Default
The Default field plays a critical role in making Athena work more efficiently and accurately. For example, when a user requests Athena to generate insights on revenue by year. The dataset may have different date columns like order date, delivery date and sale date. To avoid confusions, the user can set a column default to set higher priority and when a date query is given Athena refers from the default date column. Similarly default can be set for metrics and dimensions to prioritize an column.
Visible in Chat/Explorer
Visible in Chat/Explorer allows you to control whether a specific column is visible in Athena Chat and Explorer. By enabling the toggle, you can choose to make the selected column accessible and visible. This feature ensures that only the relevant data is presented to users during interactions, streamlining their experience and focusing attention on the most pertinent information.
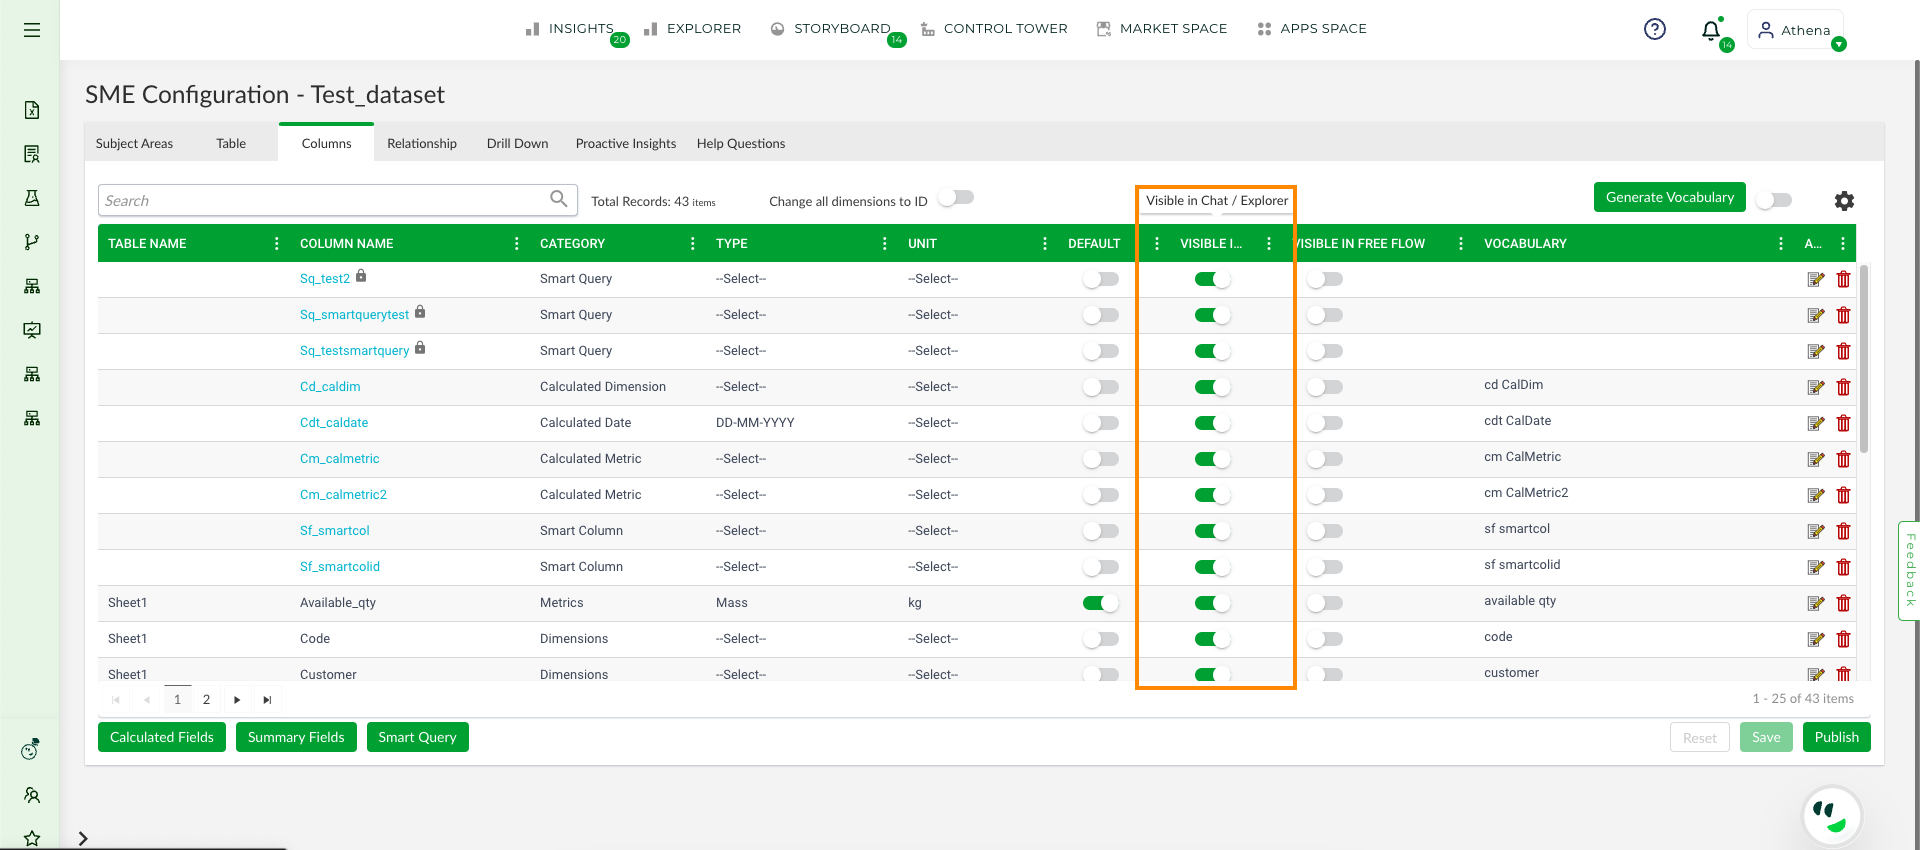
Visible in Chat/Explorer#
Visible in Free Flow
Visible in Free Flow, allows you to control whether a specific table within a dataset should be included in the free flow analysis. By enabling the toggle option, you can decide if the table will be considered during free flow operations. This feature gives users flexibility in managing which data is dynamically analyzed and presented, ensuring that only relevant tables contribute to the insights generated in free flow mode.
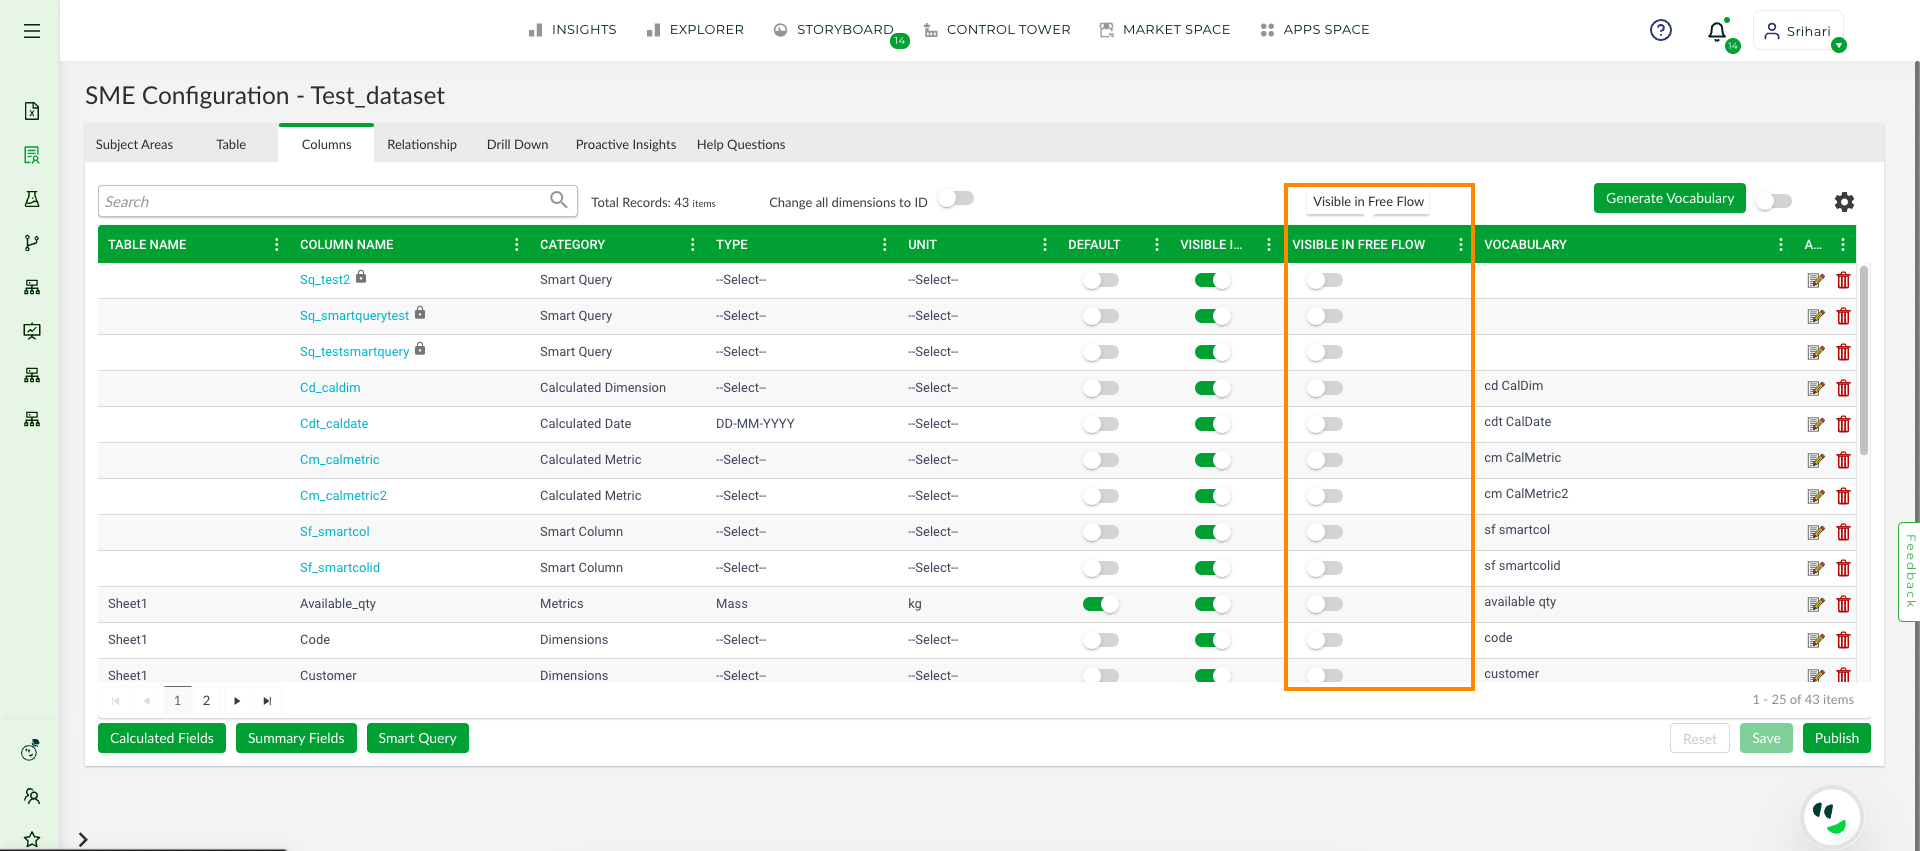
Visible in Free Flow#
NOTE
Despite the visibility toggle of the column being disabled, it remains functional for creating Custom Fields.
Generate Vocabulary
The Generate Vocabulary feature allows users to obtain the nearest synonymous matches for column names when dataset details are provided. The results can be downloaded in Excel format and the generated synonyms can be imported into the dataset in generate vocabulary column.
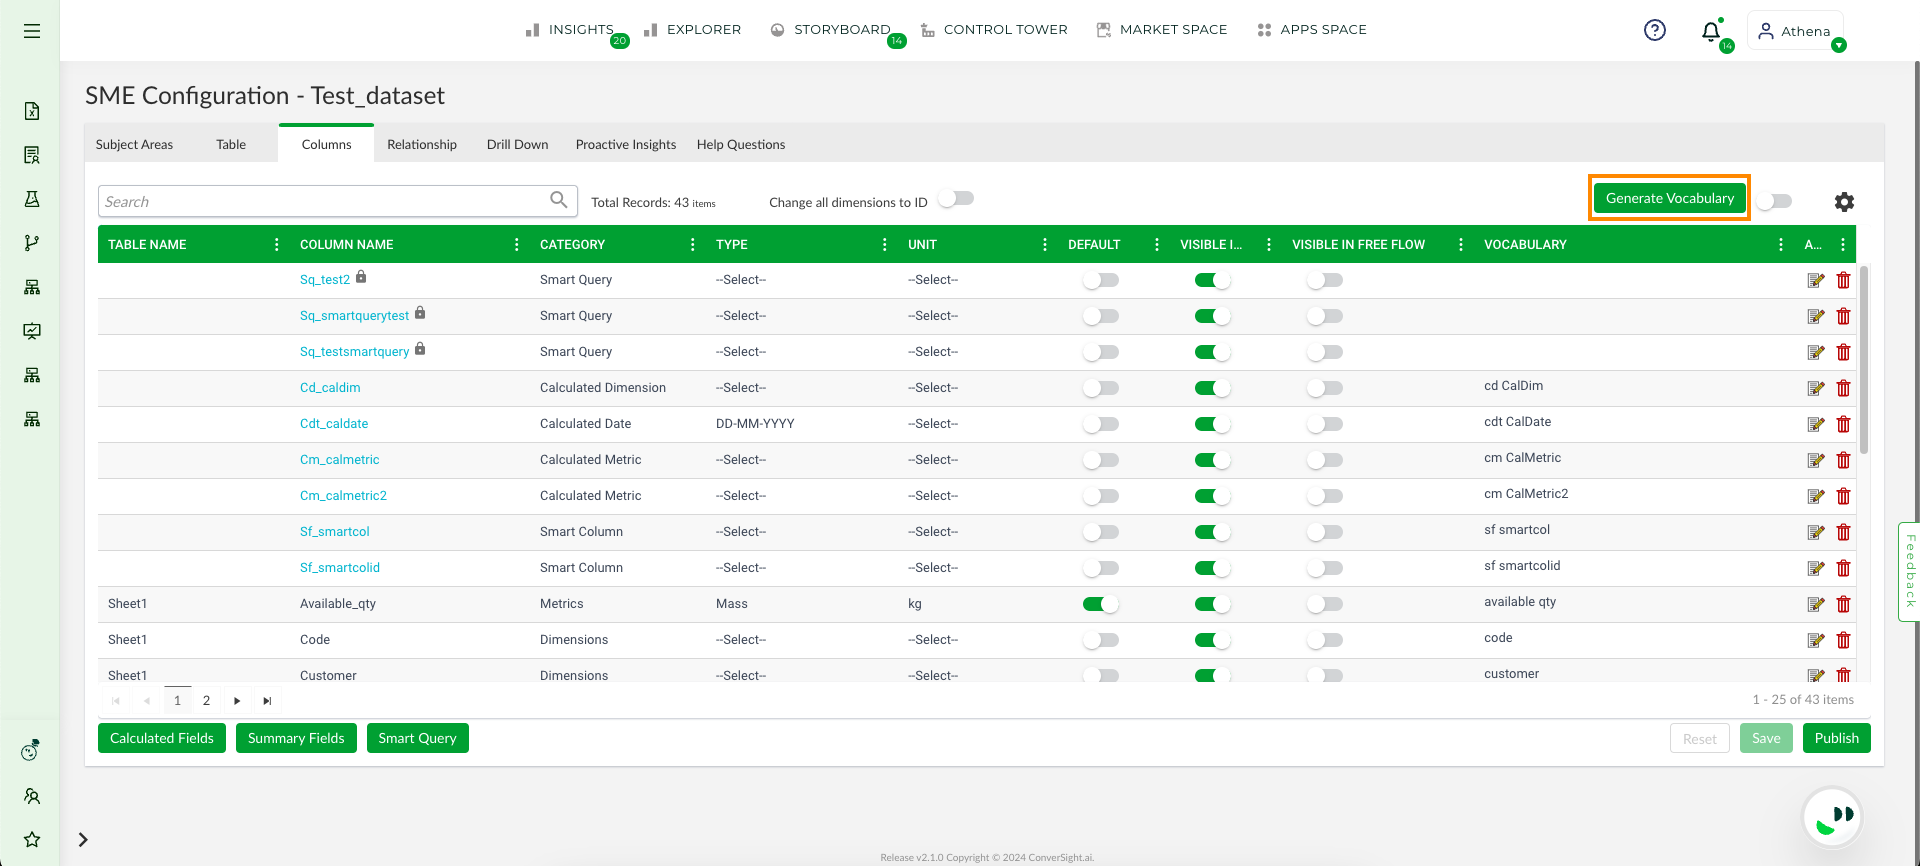
Generate Vocabulary#
Vocabulary
The Vocabulary column allows us to add suitable synonyms to the column names. For example, the term consumer may have various synonyms such as customer, end user, client, buyer, purchaser and shopper. All of these could be included in the Vocabulary column as synonyms. This is primarily done to train Athena to identify and respond to diverse questions that have equivalent meanings.
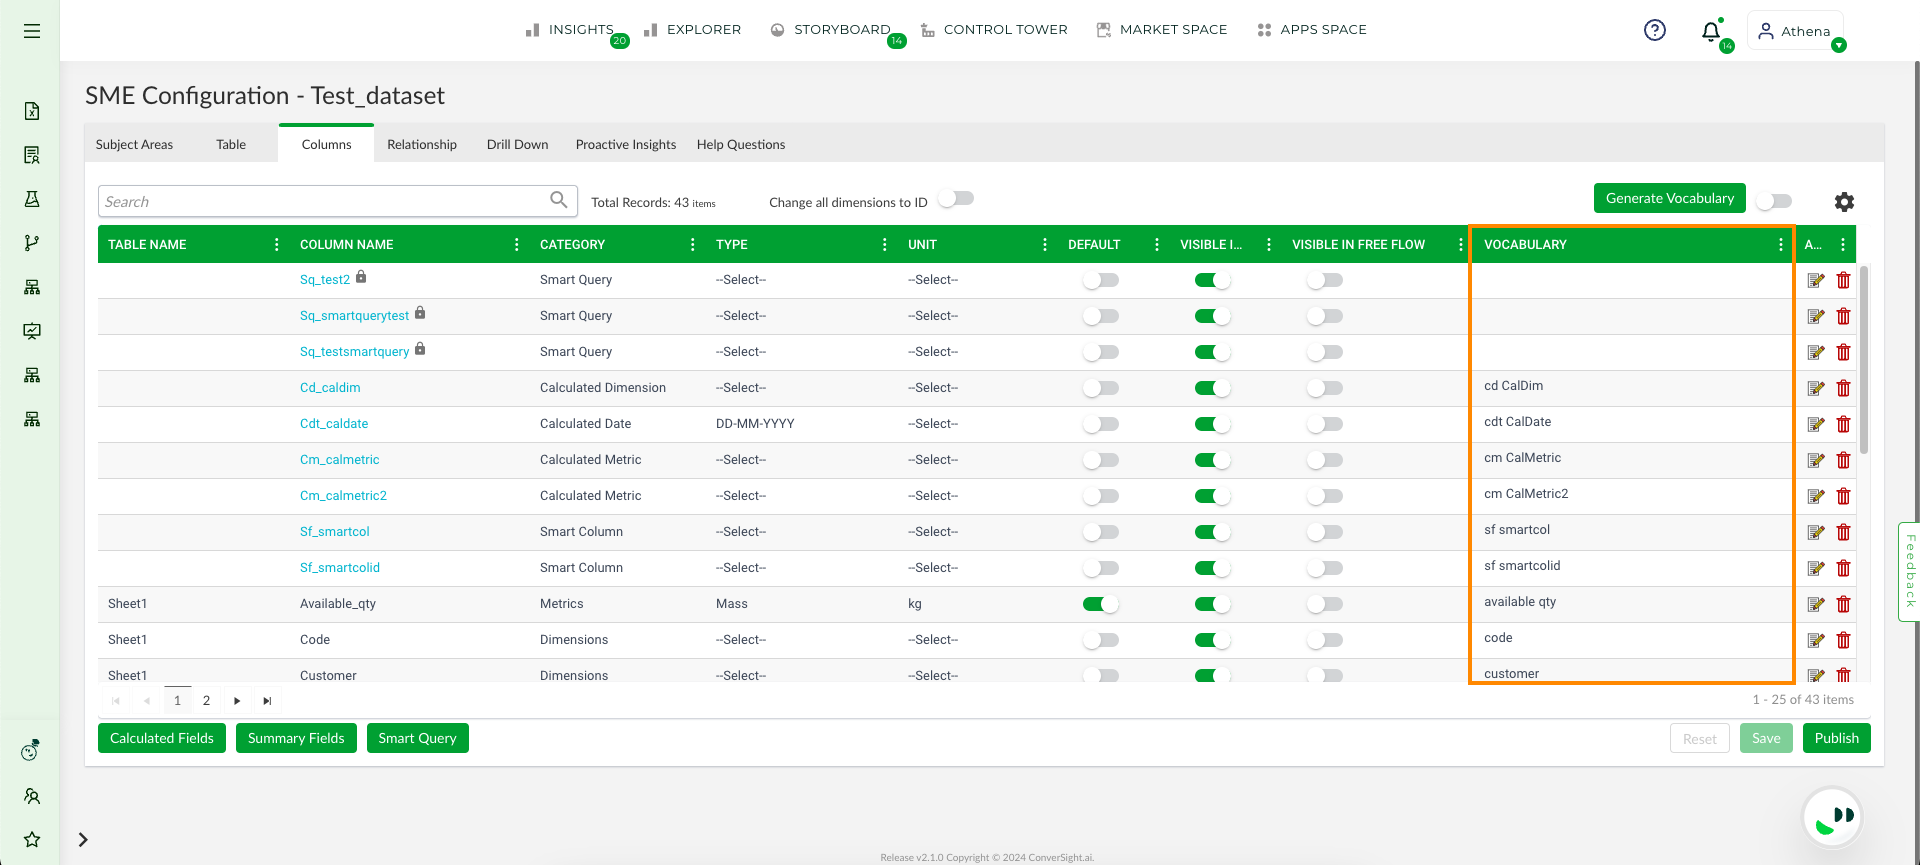
Vocabulary Field#
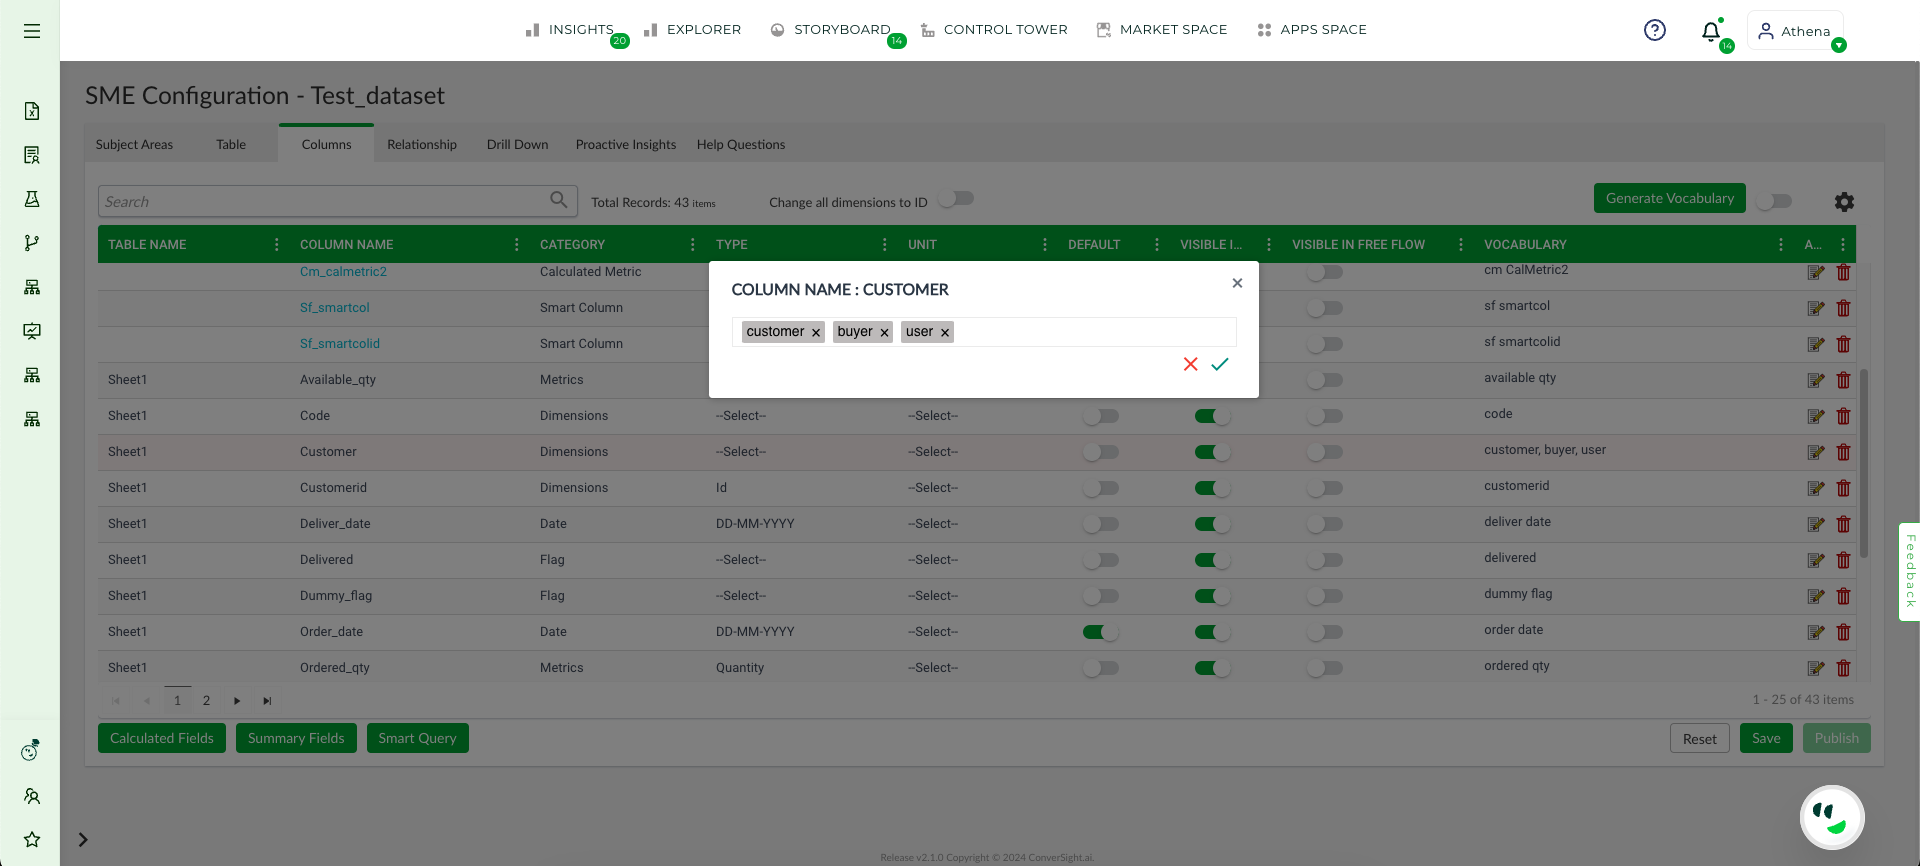
Vocabulary Added#
Action
The Action column provides options to manage and modify your columns effectively.
In the Edit option, you can adjust the column settings based on the category type, such as metric, dimension or date. The fields for source system reference and description remain consistent across all categories. The source system reference indicates the origin of the data, while the description allows you to add details for clearer understanding.
The following are the available edit options based on the category types:
Under the Metrics category, the
 page includes the ability to set precision for values. Additionally, users can determine whether the column should be summed up or an average should be taken during calculations by utilizing the Aggregation option. Finally, users have the privilege to customize the background colour and text colour for the column’s UI.
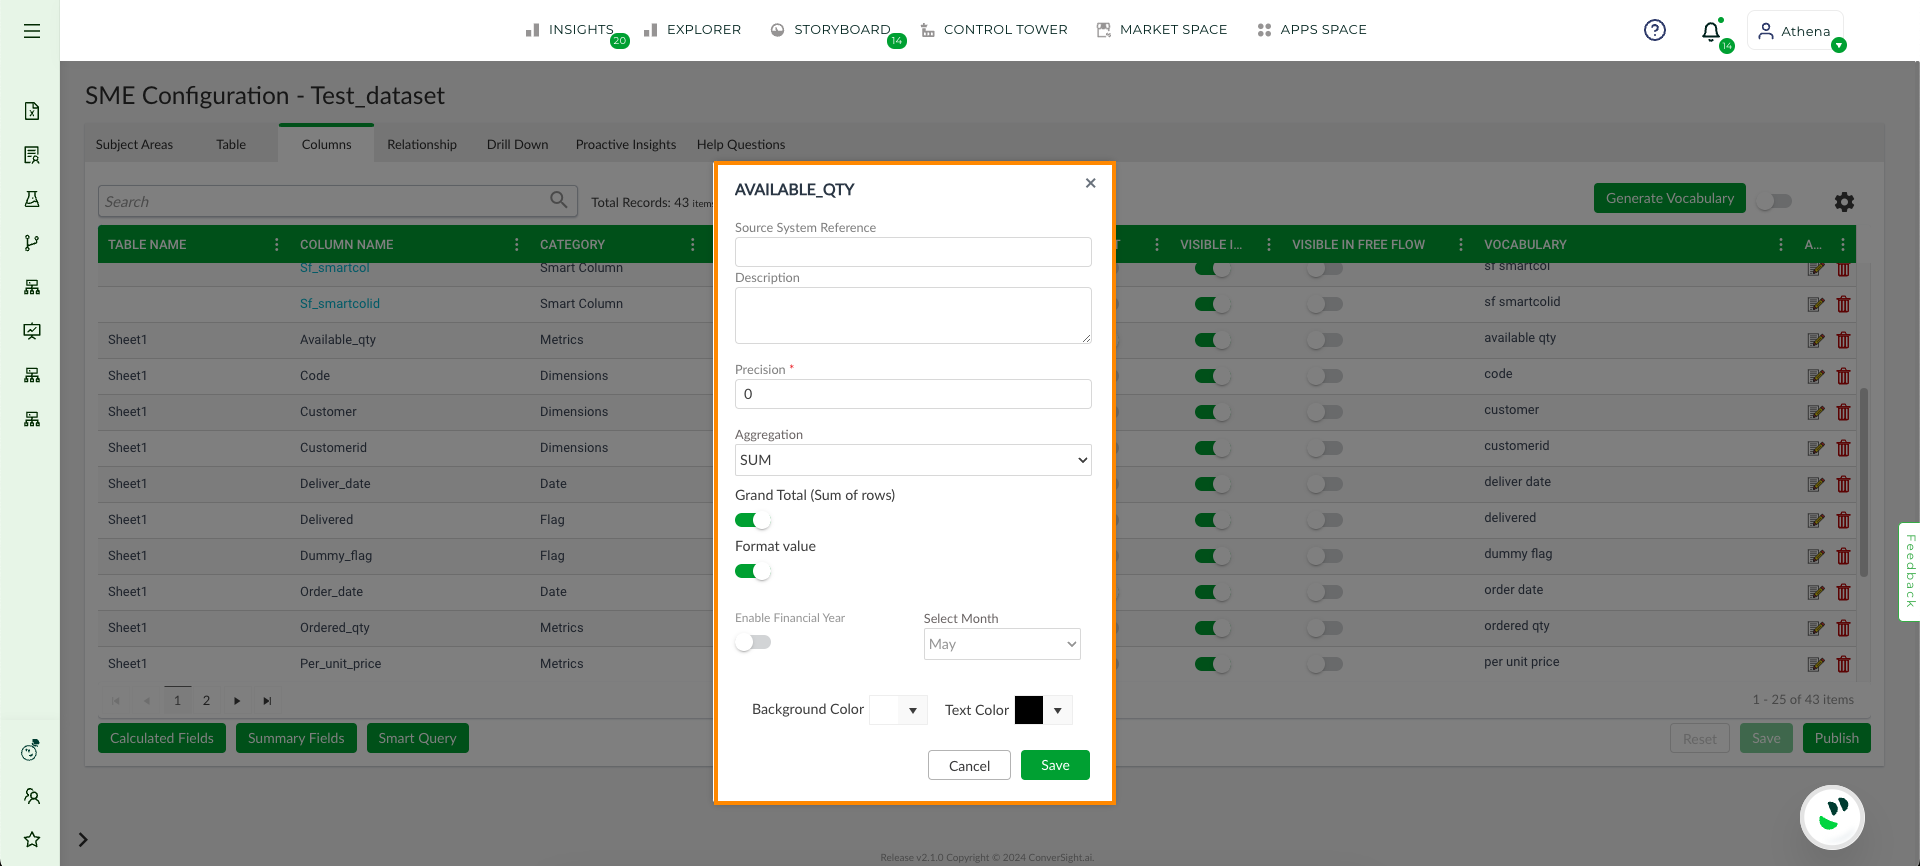
Action Page for Metrics#
Within the Dimensions category, the
page features a toggle for Entity Clarification. When enabled, this function enables Athena to search for unknown words within the column. Furthermore, users can select a default smart column from the list to ensure that the word is matched with the entity column and functions as a filter for the selected default smart column. The users are provided with the privilege to customize the background colour and text colour of the column in the UI.
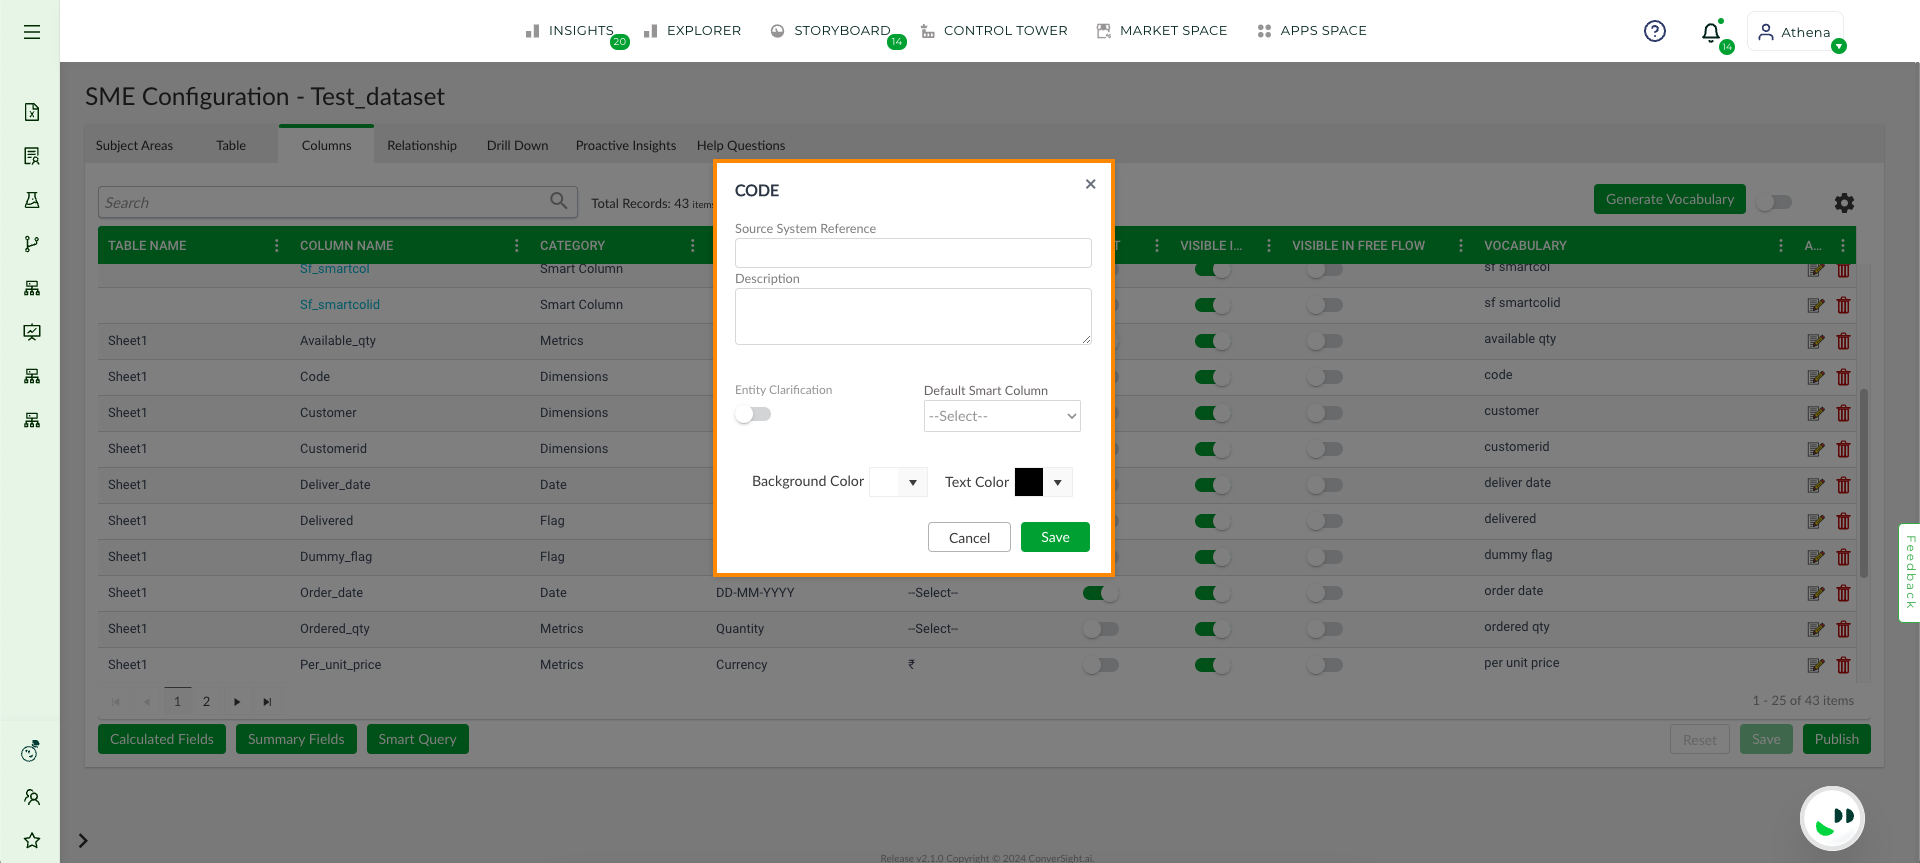
Action Page for Dimensions#
Under the Date category, the
page includes the option to enable a financial year and select the starting month of the year. Additionally, users can customize the background colour and text colour of the column in the UI.

Action Page for Date#
By clicking on the ![]() icon, the use can delete the corresponding column.
icon, the use can delete the corresponding column.
Fields Option
Each field provides the user with the ability to sort in either ascending or descending order. Additionally, users can filter columns and add fields from the list of available column options.
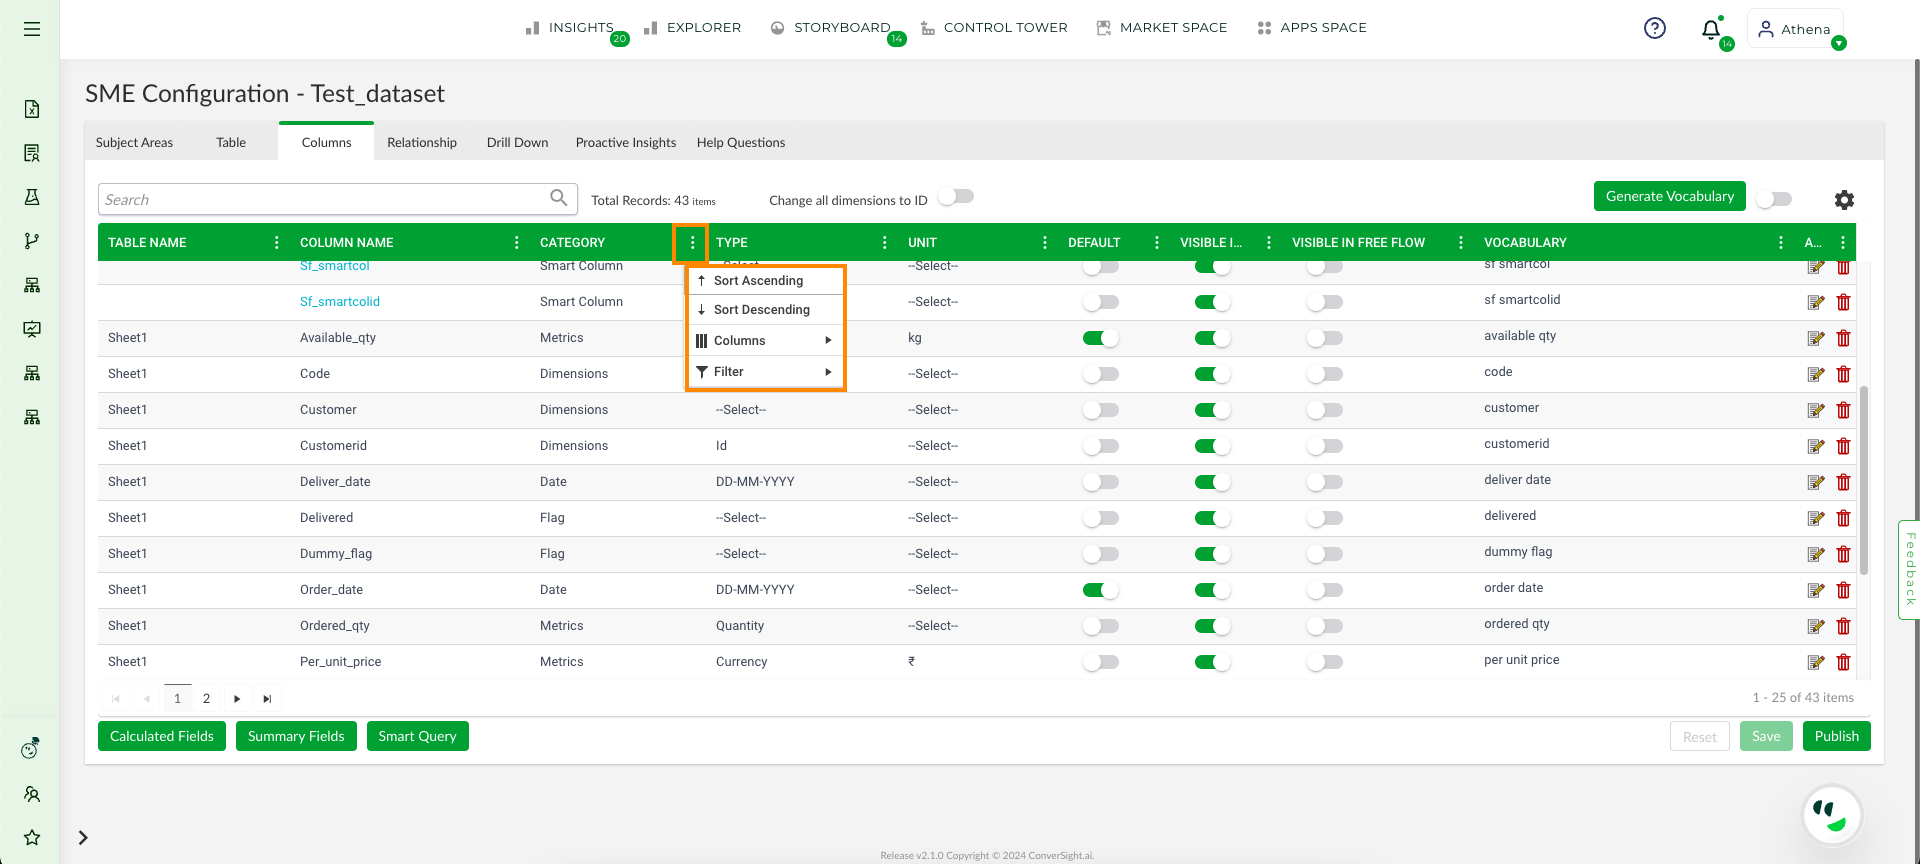
Field Options#
Sort Ascending and Sort Descending: The options for sorting in ascending and descending order arrange the selected column in alphabetical order, depending on whether the user has chosen ascending or descending sorting.
Columns: When clicking on the columns, a display of all available columns that can be added to the table is presented.
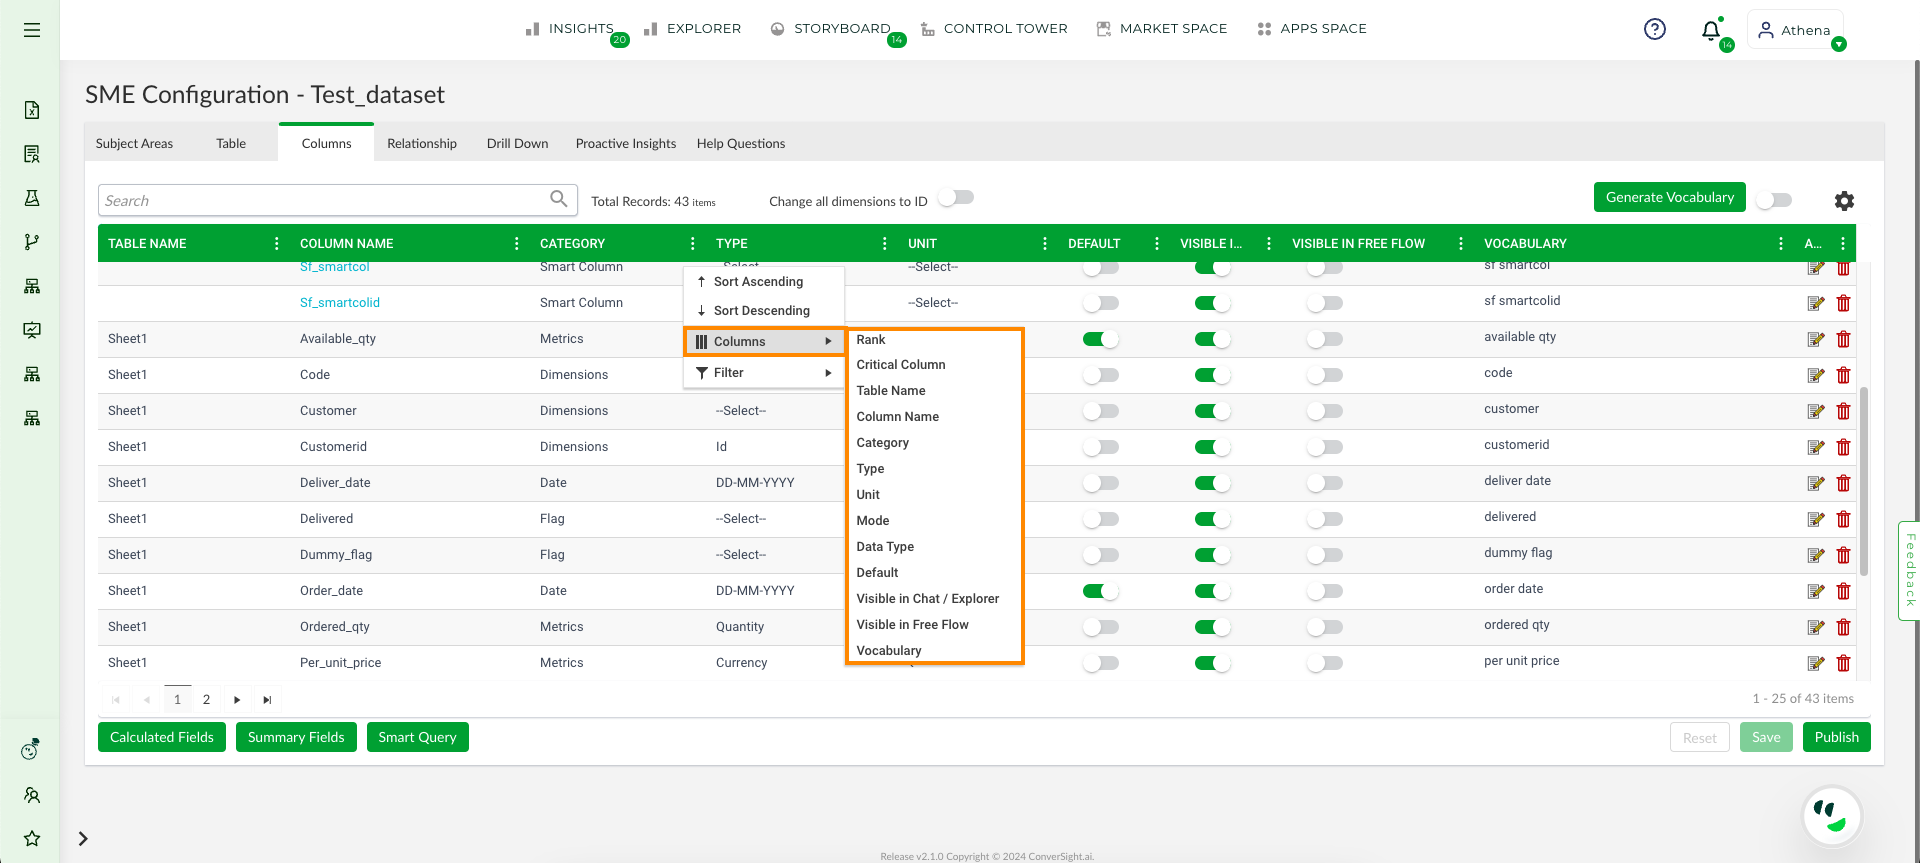
Available Column Fields#
These include:
Columns |
Action |
|---|---|
Rank |
The Rank column is assigns rank-based preference to the column. Please note that once a Rank is assigned, any other columns with the same synonym will be disregarded. |
Critical Column |
The Critical columns pertain to the fundamental columns within a dataset that are utilized for performing analysis and forecasting. |
Table name, Column Name, Category, Type, Unit, Default, Vocabulary |
These columns are shown by default. |
Data Type |
The Data Type column refers to the format of the information when it is being loaded into our database and these types can’t be modified |
Mode |
The Mode column is utilized for sorting the data in the column in either ascending or descending order. |
Filter: The filter option enables the user to analyze a subset of data by applying specific criteria. Once a filter is applied to a table or data range, rows that do not meet the chosen criteria can be temporarily hidden. This allows for a concentrated focus on the most pertinent data.
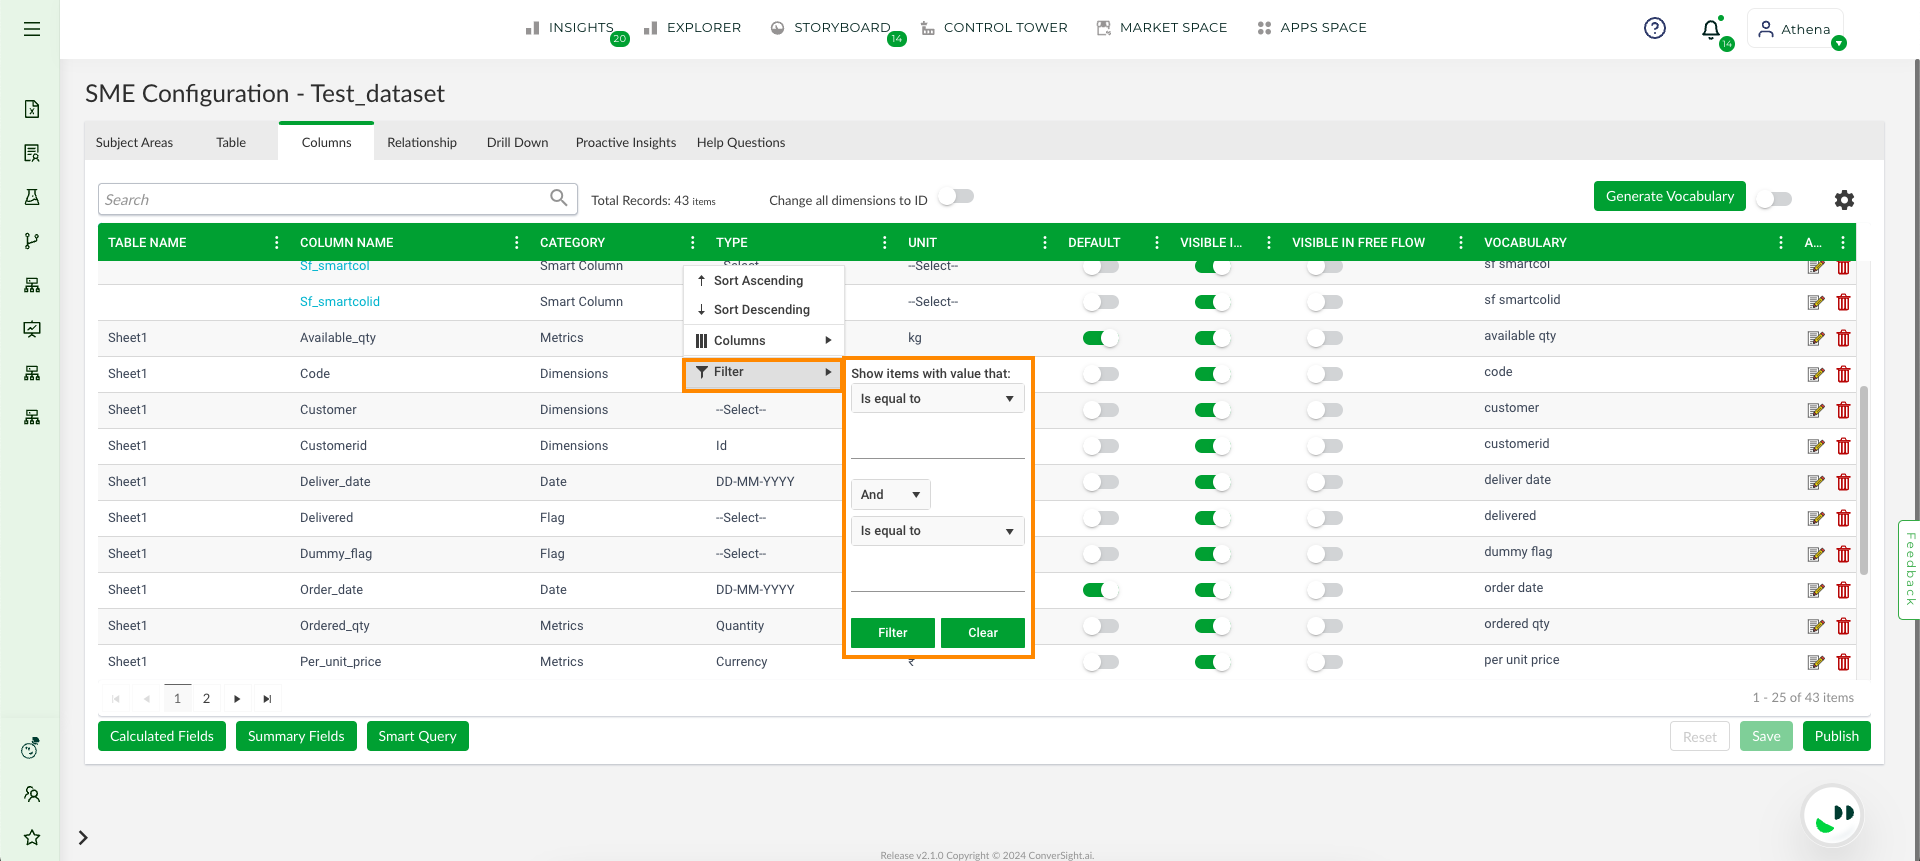
Filter#
To watch the video, click on Columns Vocabulary.
Custom Fields#
The Custom Fields empowers users to generate their own column from existing data, incorporating an applied condition column that can be utilized in future analysis.
ConverSight offers the following Custom Fields:
Calculated Fields
Summary Fields
Smart Query
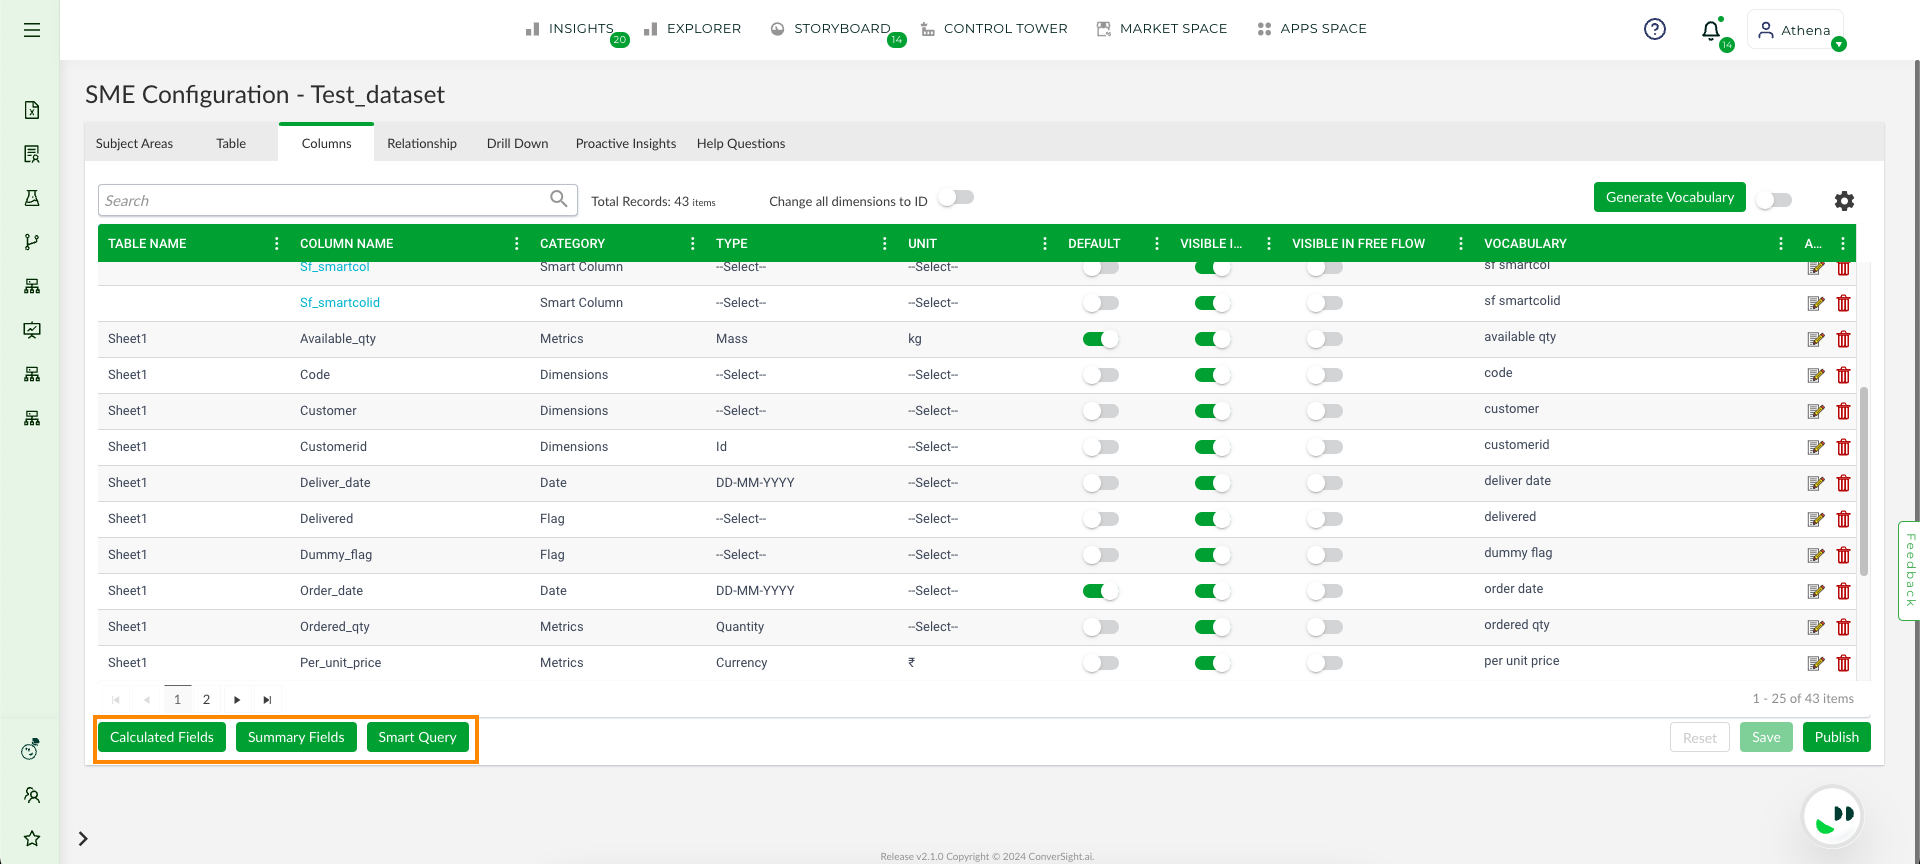
Custom Fields#
Calculated Fields#
Calculated Fields play a crucial role in the analysis and visualization of business data. They enable users to generate customized data fields tailored to their specific needs. These fields are created by applying filters and performing operations on existing data fields, allowing you to create exactly the type of information you require. The custom field created using Calculated Fields will exclusively exist within the platform and won’t be replicated in the actual database.
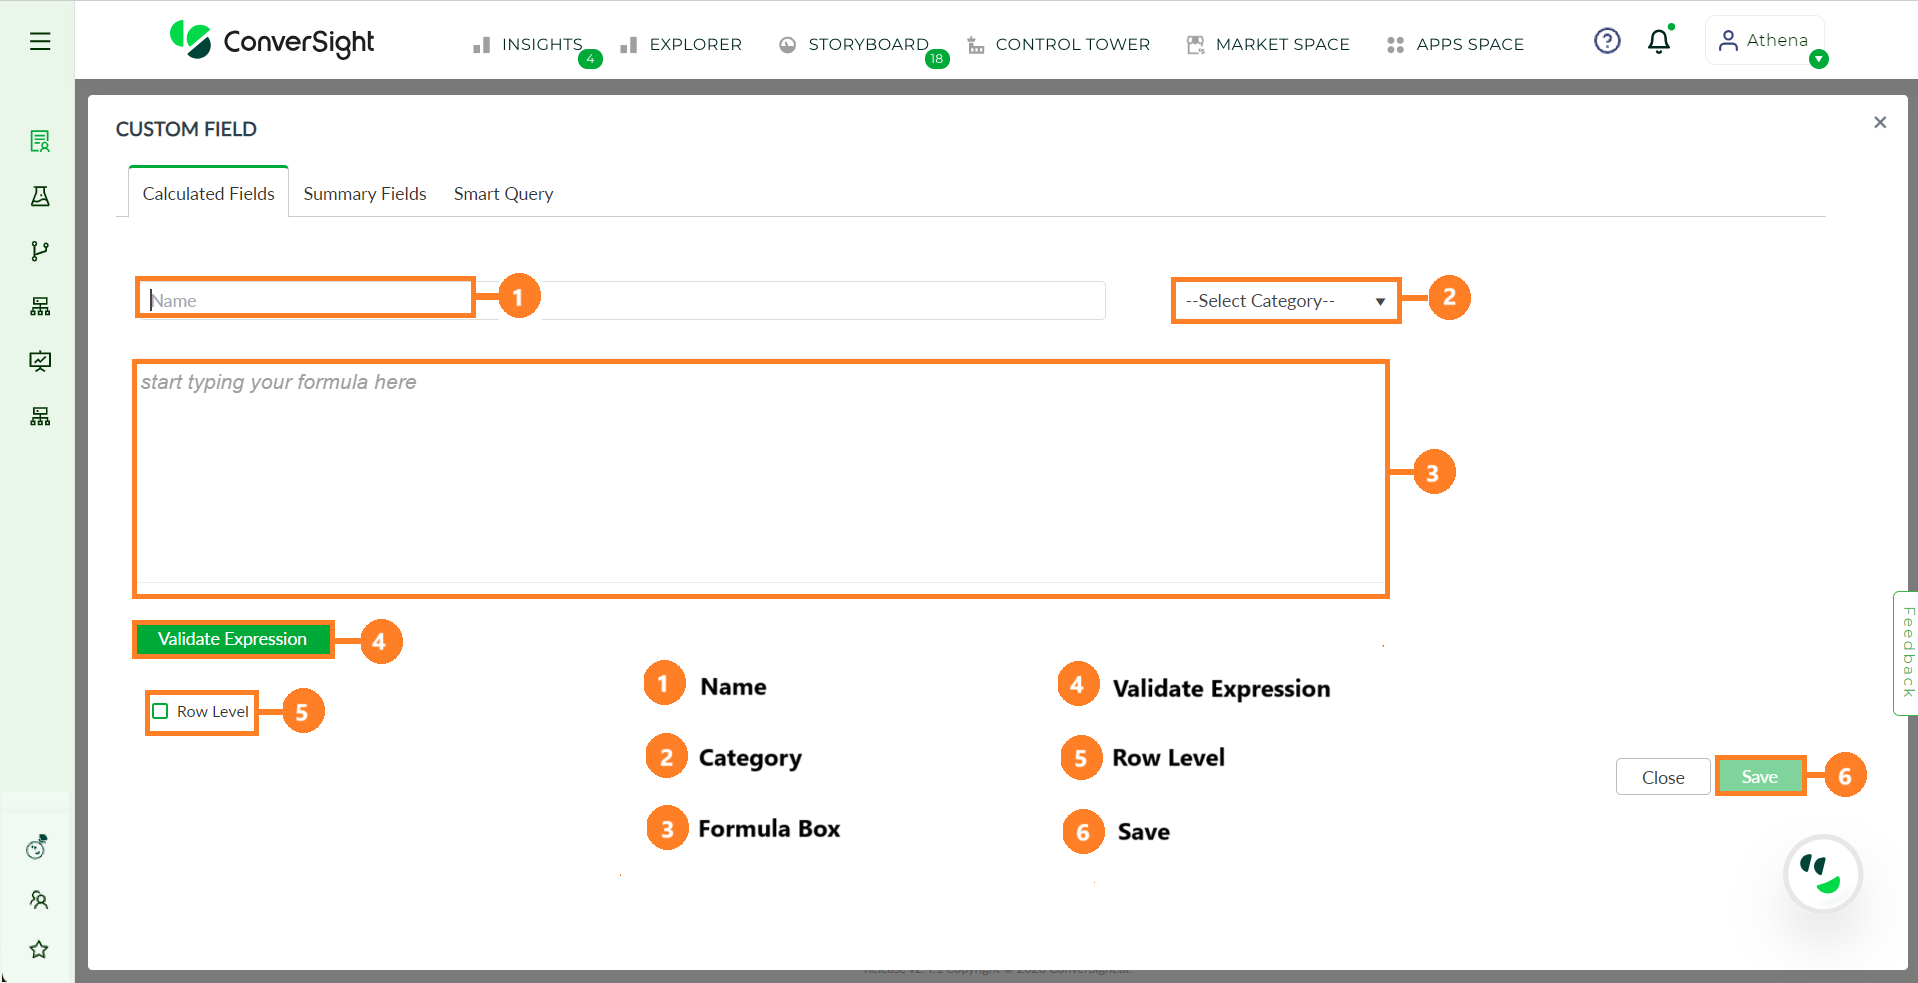
Calculated Field Overview#
Feature |
Description |
|---|---|
Name |
Provide a name for referencing your Calculated Field. |
Select Category |
Choose the category of the custom field as Metric, Dimension or Date. |
Formula Box |
Enter operations and filters in the formula box to create the Calculated Field. |
Validate Expression |
Validate if the provided expression can create a Calculated Field. |
Row Level |
When selected, operations and filters are individually applied to each row within the column. |
Save |
Save your Calculated Fields by clicking the Save button. |
To work and know more about these fields you can refer Calculated Fields.
To watch the video, click on Calculated Fields.
Summary Fields#
Summary Fields are used to create Smart Columns that serves as an important and valuable tool for users who need to create reports or verify inputs from multiple columns across various tables within a dataset. Normally, users would need to manually enter their queries or use a guided search with Athena, which can be a time-consuming task. However, by utilizing Smart Columns, users can consolidate all necessary columns in one place, name the query and save it for future use. This feature enables users to retrieve the group of columns using only the Summary Fields name in Athena, saving significant time and effort.The created Smart Column will exclusively exist within the platform and won’t be replicated in the actual database.
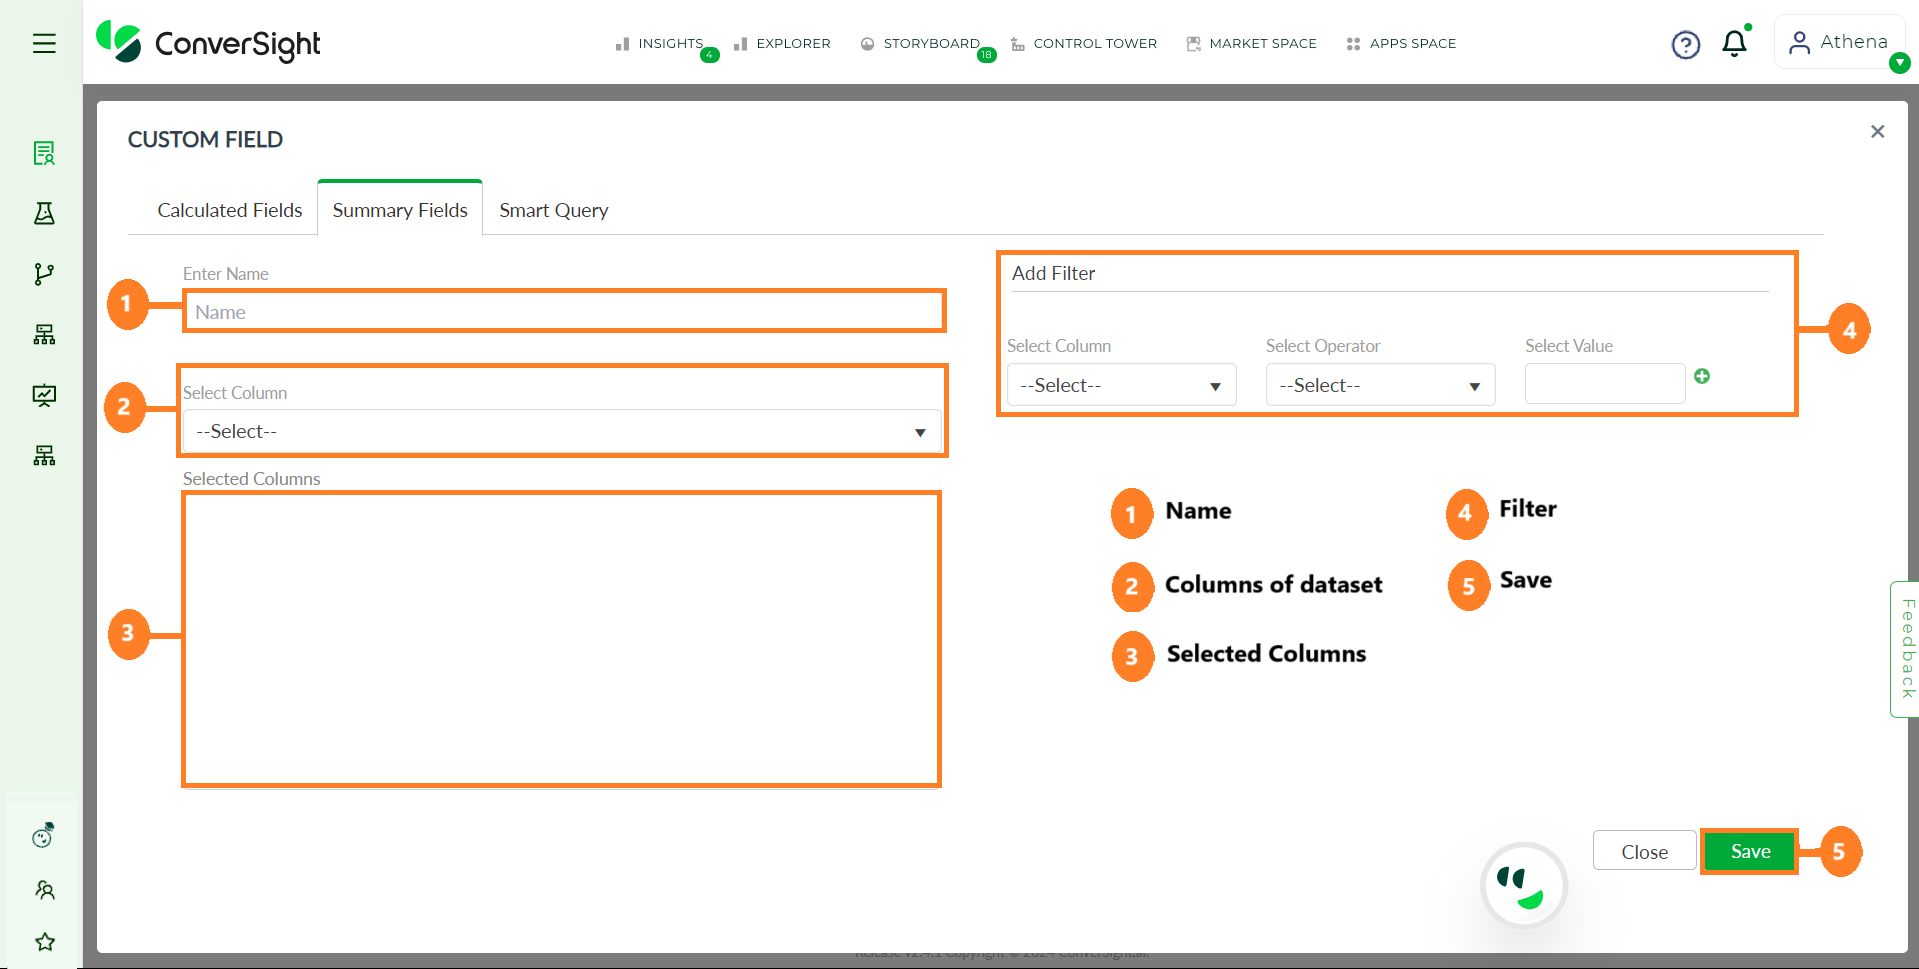
Summary Fields#
NOTE
Summary Fields can retrieve outcomes from diverse tables only when a relationship exists between those tables.
To work and know more about these custom fields you can refer Summary Fields.
To watch the video, click on Summary Fields.
Smart Query#
Smart Query is a feature embedded within the ConverSight platform, engineered to simplify the process of data retrieval from a database through an intuitive interface. This advanced functionality empowers users to select tables, fields and filters, thereby constructing customized queries that yield structured tables of results. Smart Query boasts a comprehensive array of features designed to augment its efficiency and user-friendliness, differentiating it from conventional querying methods.
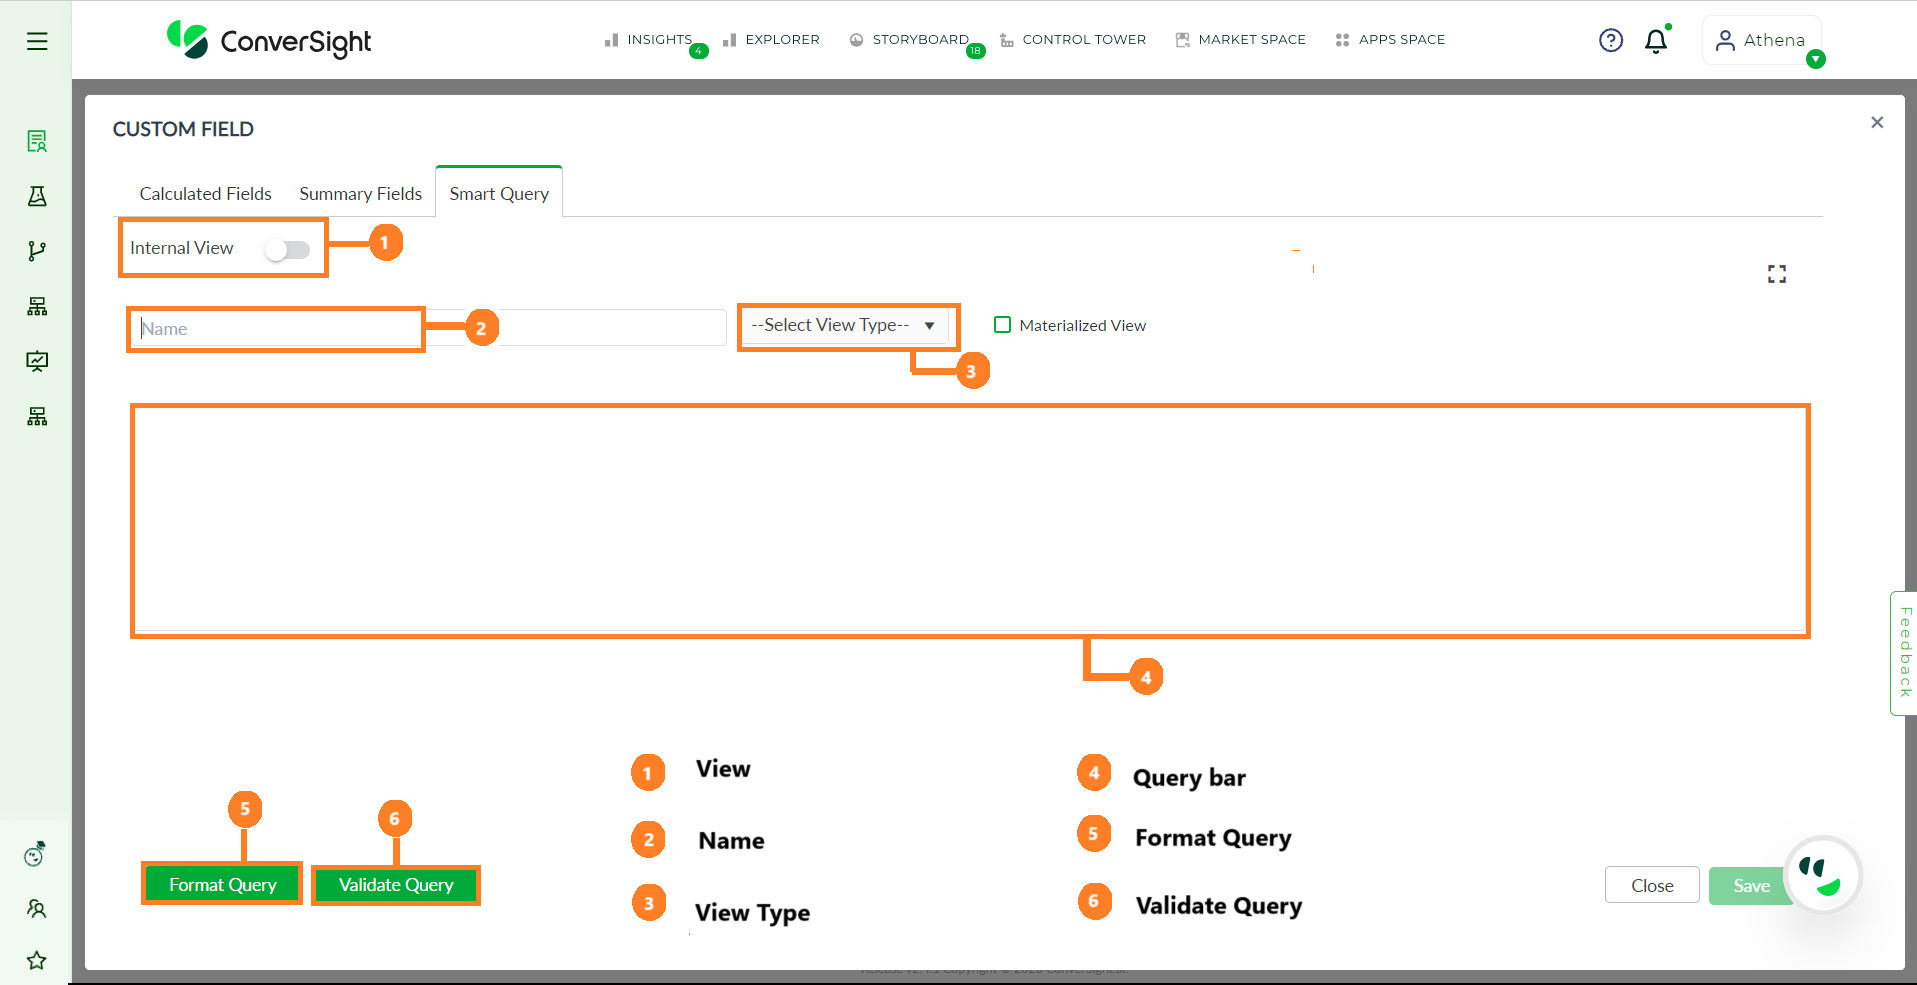
Smart Query Overview#
Feature |
Description |
|---|---|
Internal View |
Allows users to access and customize the dataset available in the platform’s database. |
External View |
Provides users with the capability to access datasets originating from the client database using Connectors. |
Name |
Mandatory field for specifying the name of your smart query. |
View Type |
Materialized View loads the dataset into the knowledge graph, while Reference creates a non-loaded view. |
Query Bar |
Enter a query to retrieve a table. Use ‘@’ to list columns and ‘#’ to list tables from the database. |
Format Query |
Formats the given query for better understanding. |
Validate Query |
Click to view the result of the query. |
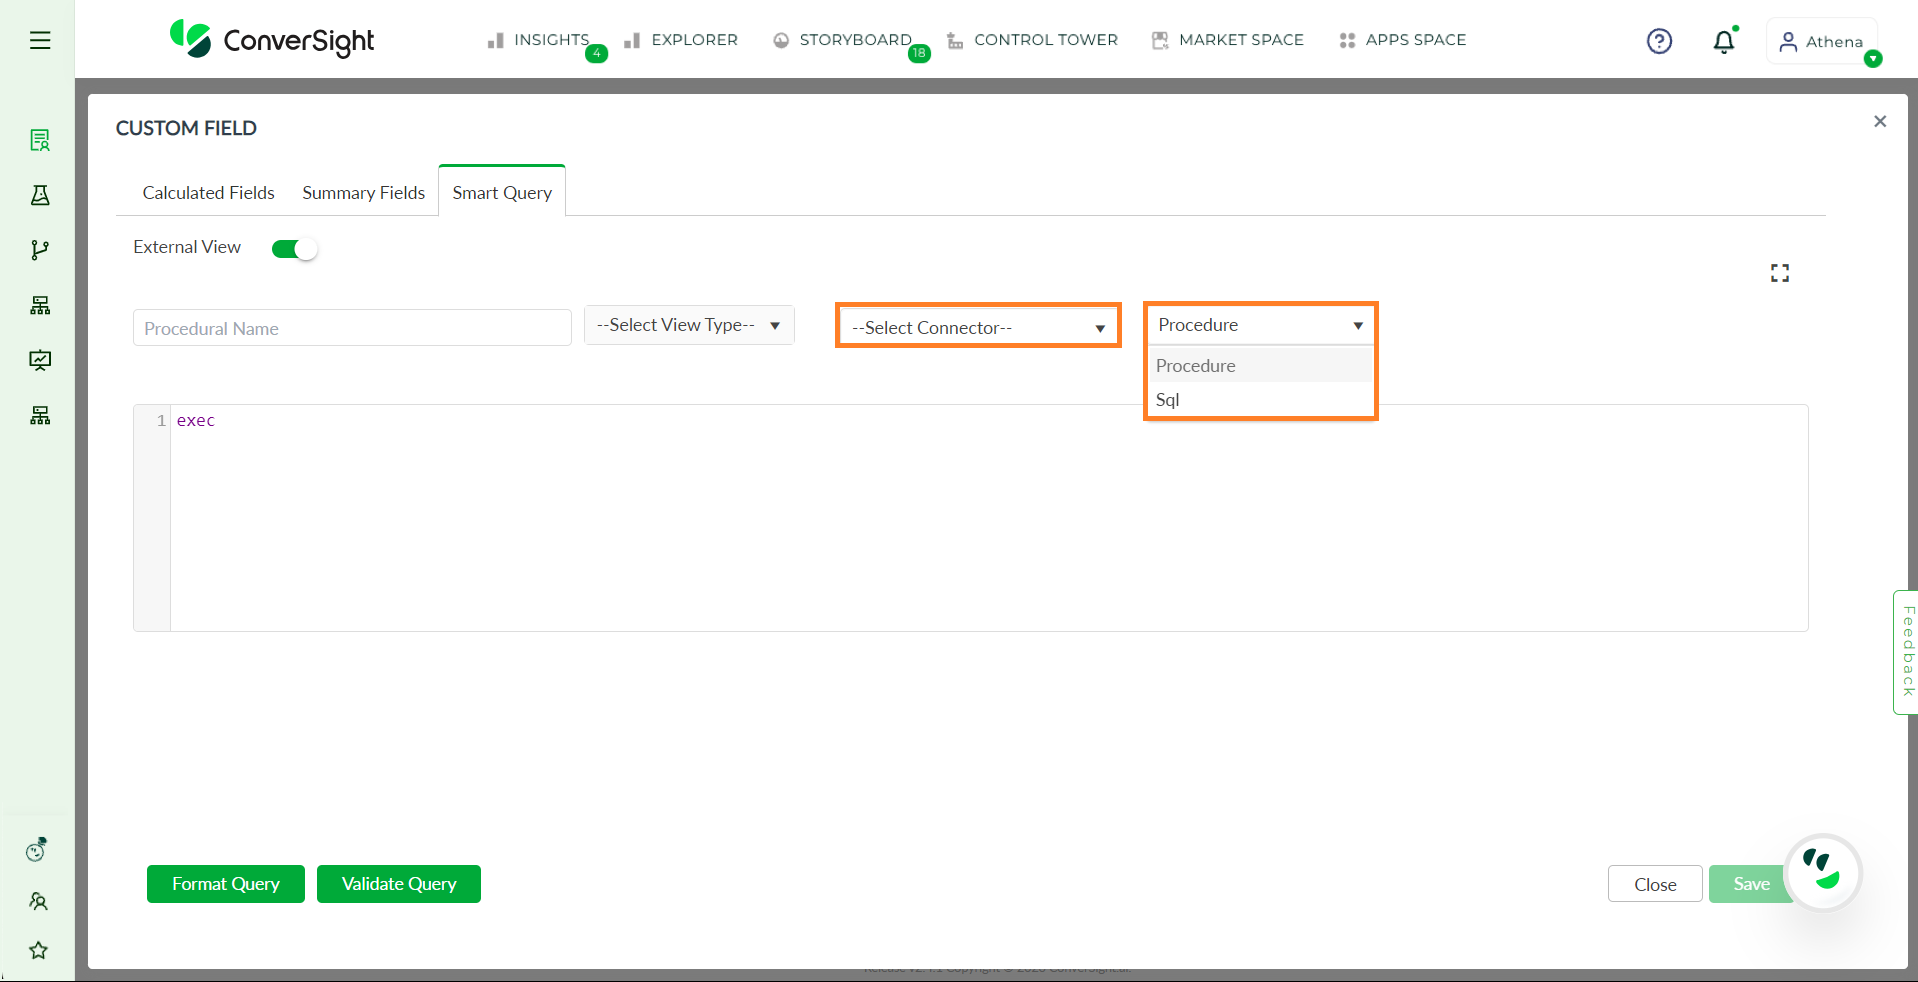
External View#
Additionally, the External view contains the following features :
Feature |
Description |
|---|---|
Select Connector |
Choose the connector for your client from the available connectors list. |
Procedure |
Execute procedures specific to the client’s database. |
SQL |
Utilize SQL queries to fetch data as needed. |
To work and know more about these fields you can refer Smart Query.
To watch the video, click on Creating Smart Query.
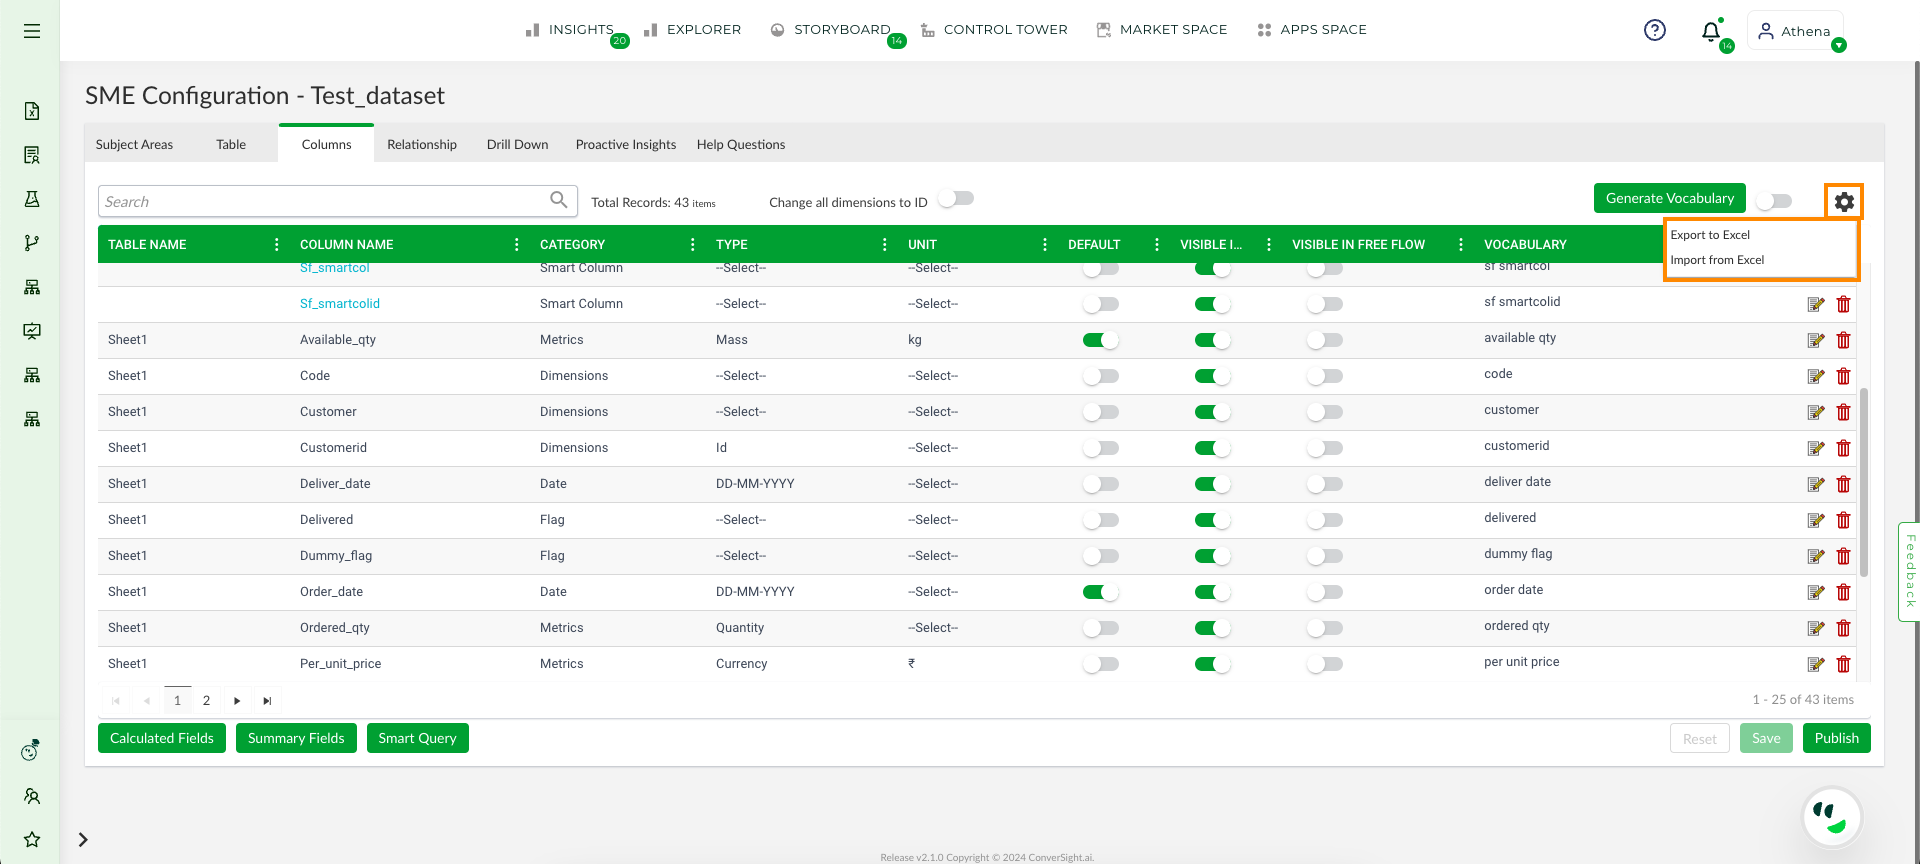
Export and Import
The user can export the dataset to an Excel file and import data from Excel by utilizing the export and import options.
Export and Import#
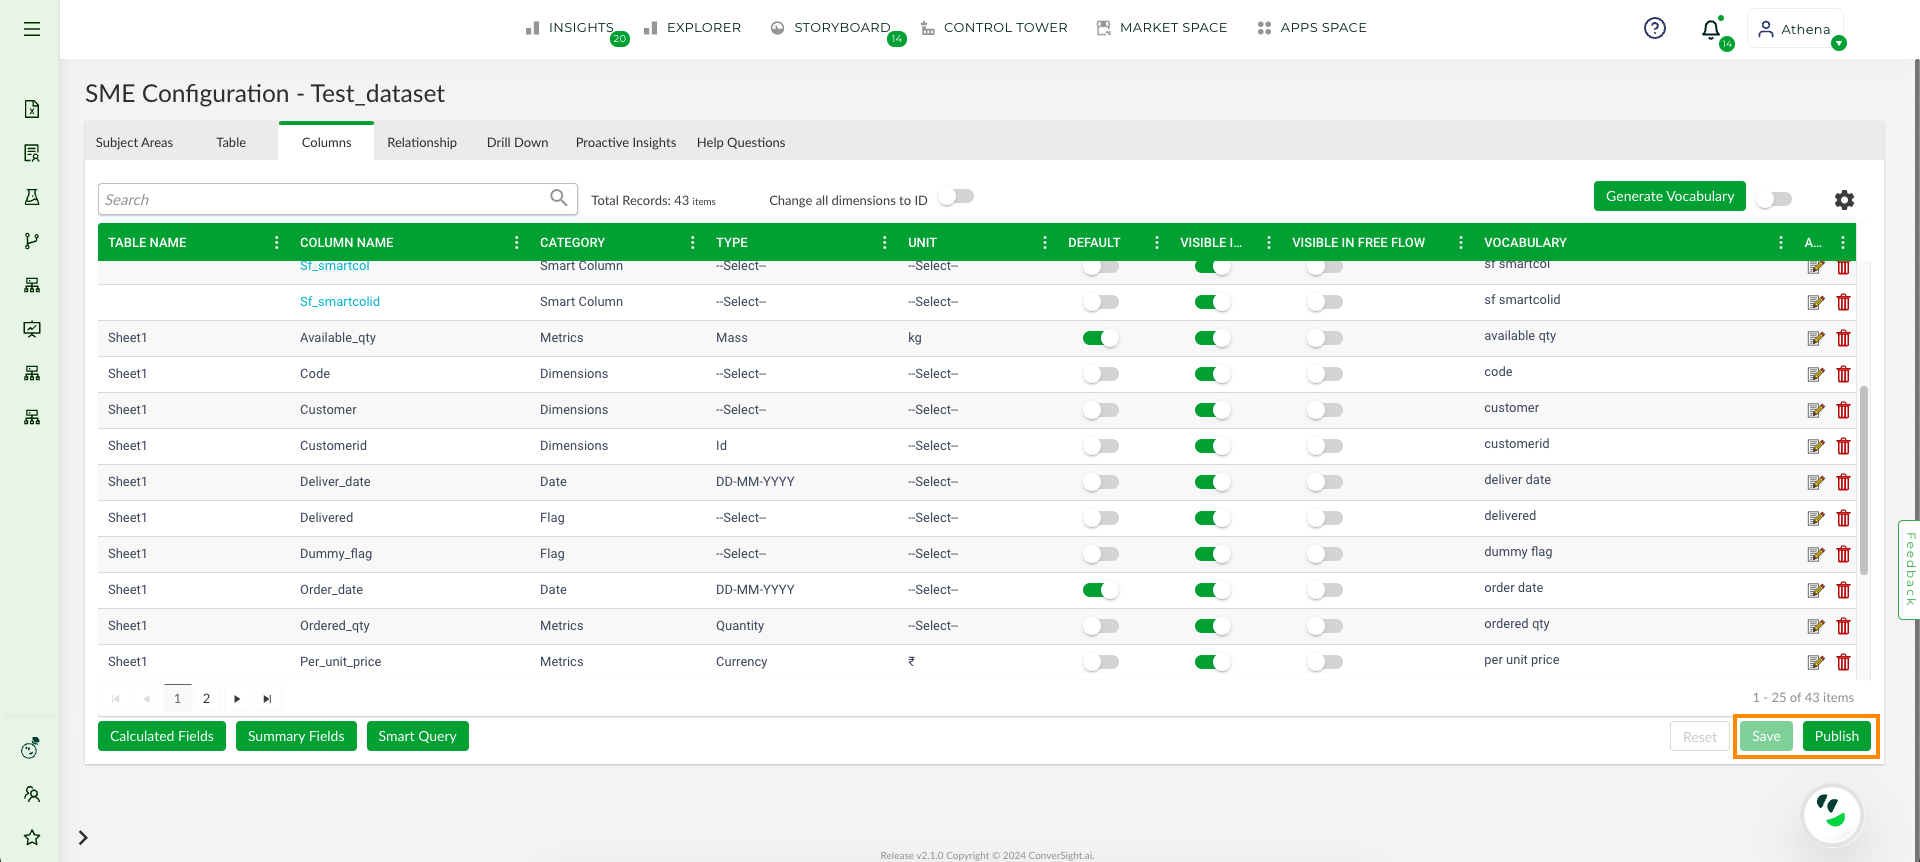
Save and Publish
Once you have finished configuring the SME coaching settings, click the Save button to store your changes. To make these configurations live, proceed by clicking the Publish button.
Save and Publish#
After clicking Publish, you will be presented with three options to finalize your configurations.
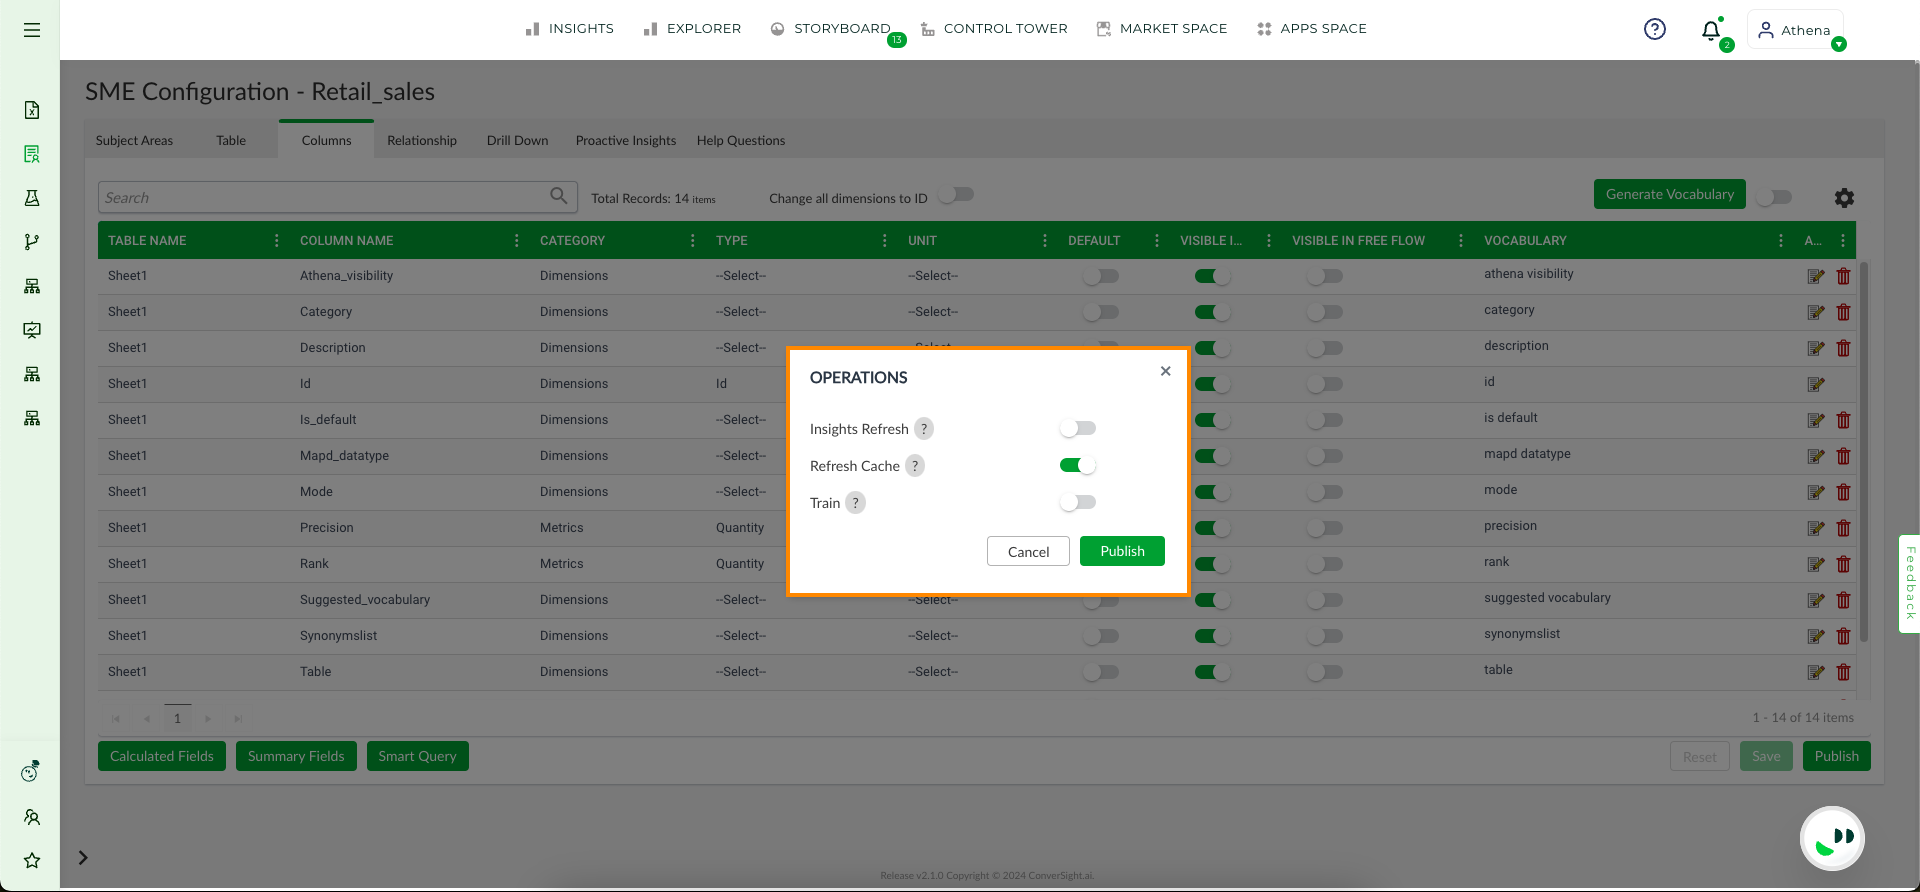
Publish#
Option |
Description |
|---|---|
Insights Refresh |
Enable this to refresh data in insights; if disabled, cached data remains. |
Refresh Cache |
Enable this to clear conversation cache and refresh storyboards; if disabled, cache persists. |
Train |
Enable this to train or re-train the LLM model with SME information, refreshing all synthetic utterances. |
After enabling the necessary toggle options, click the Publish button to apply the changes.
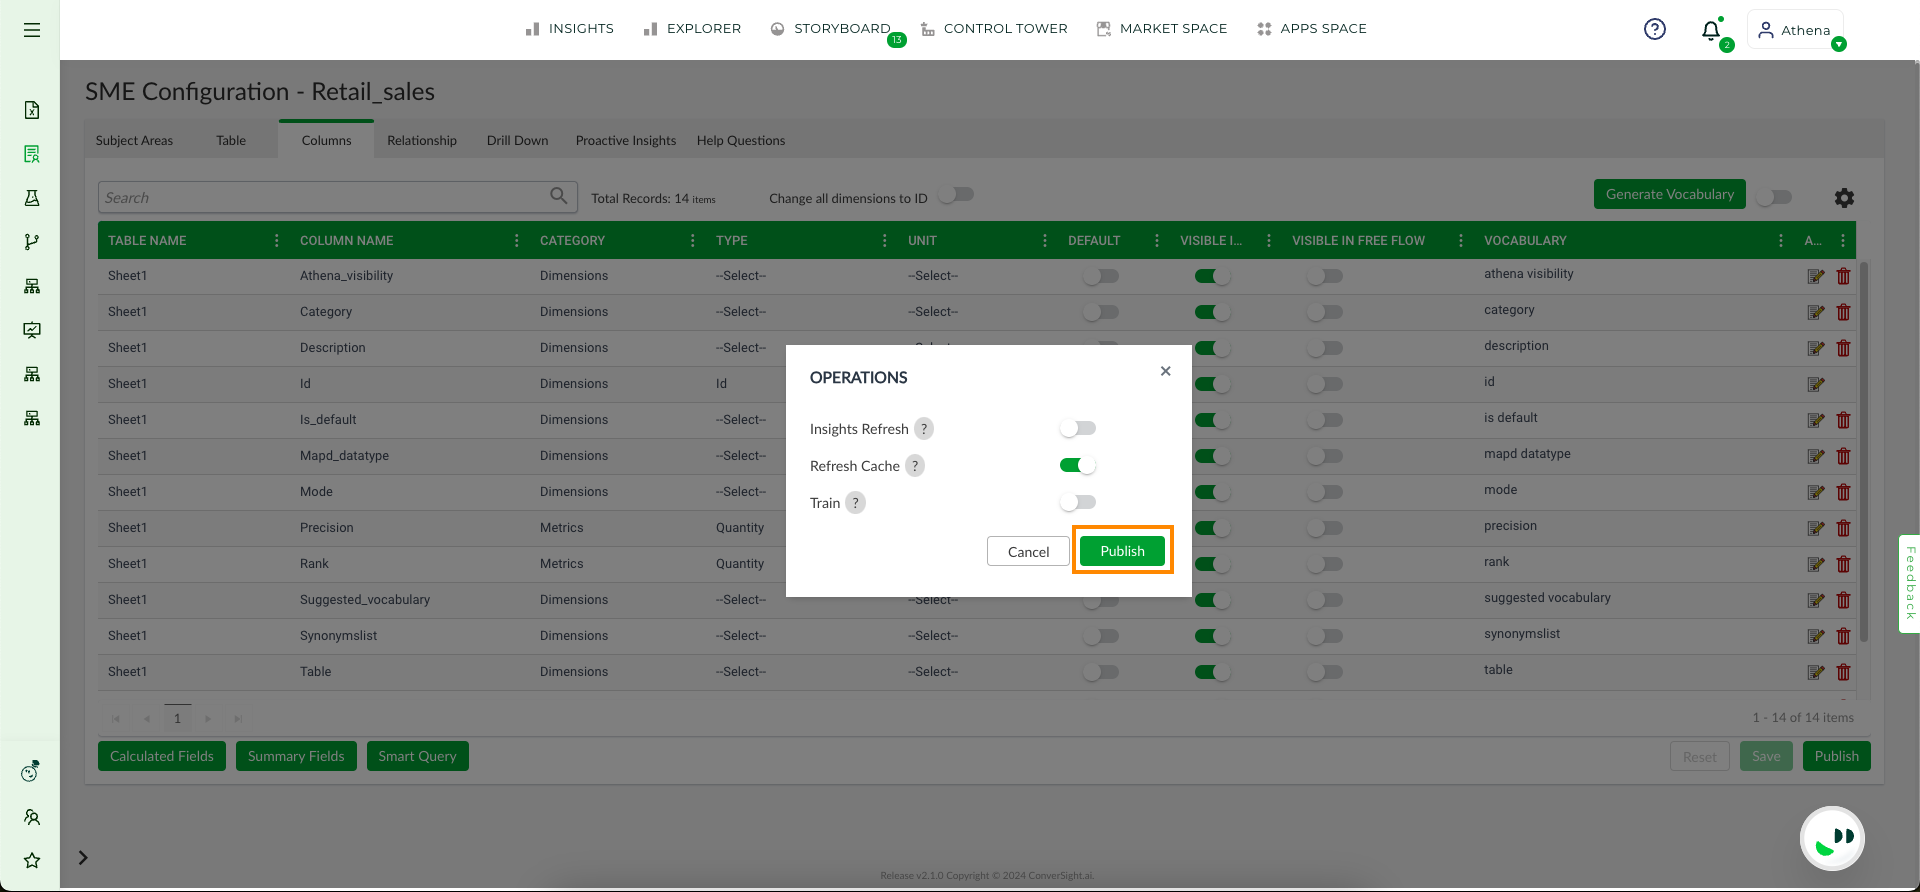
Publish Button#
Drill Down#
Drill Down is an essential feature that allows users to move from a summarized view of data to a more detailed view and it is commonly used in charts, graphs and tables. Initially, the high-level data displayed is an aggregation of different sets of data and it maintains a hierarchy. By clicking on the Drill Down option, users can access a hierarchical view that progressively delves deeper into the column until it reaches its individual and final unit. This feature helps users to gain a more thorough understanding of their data.
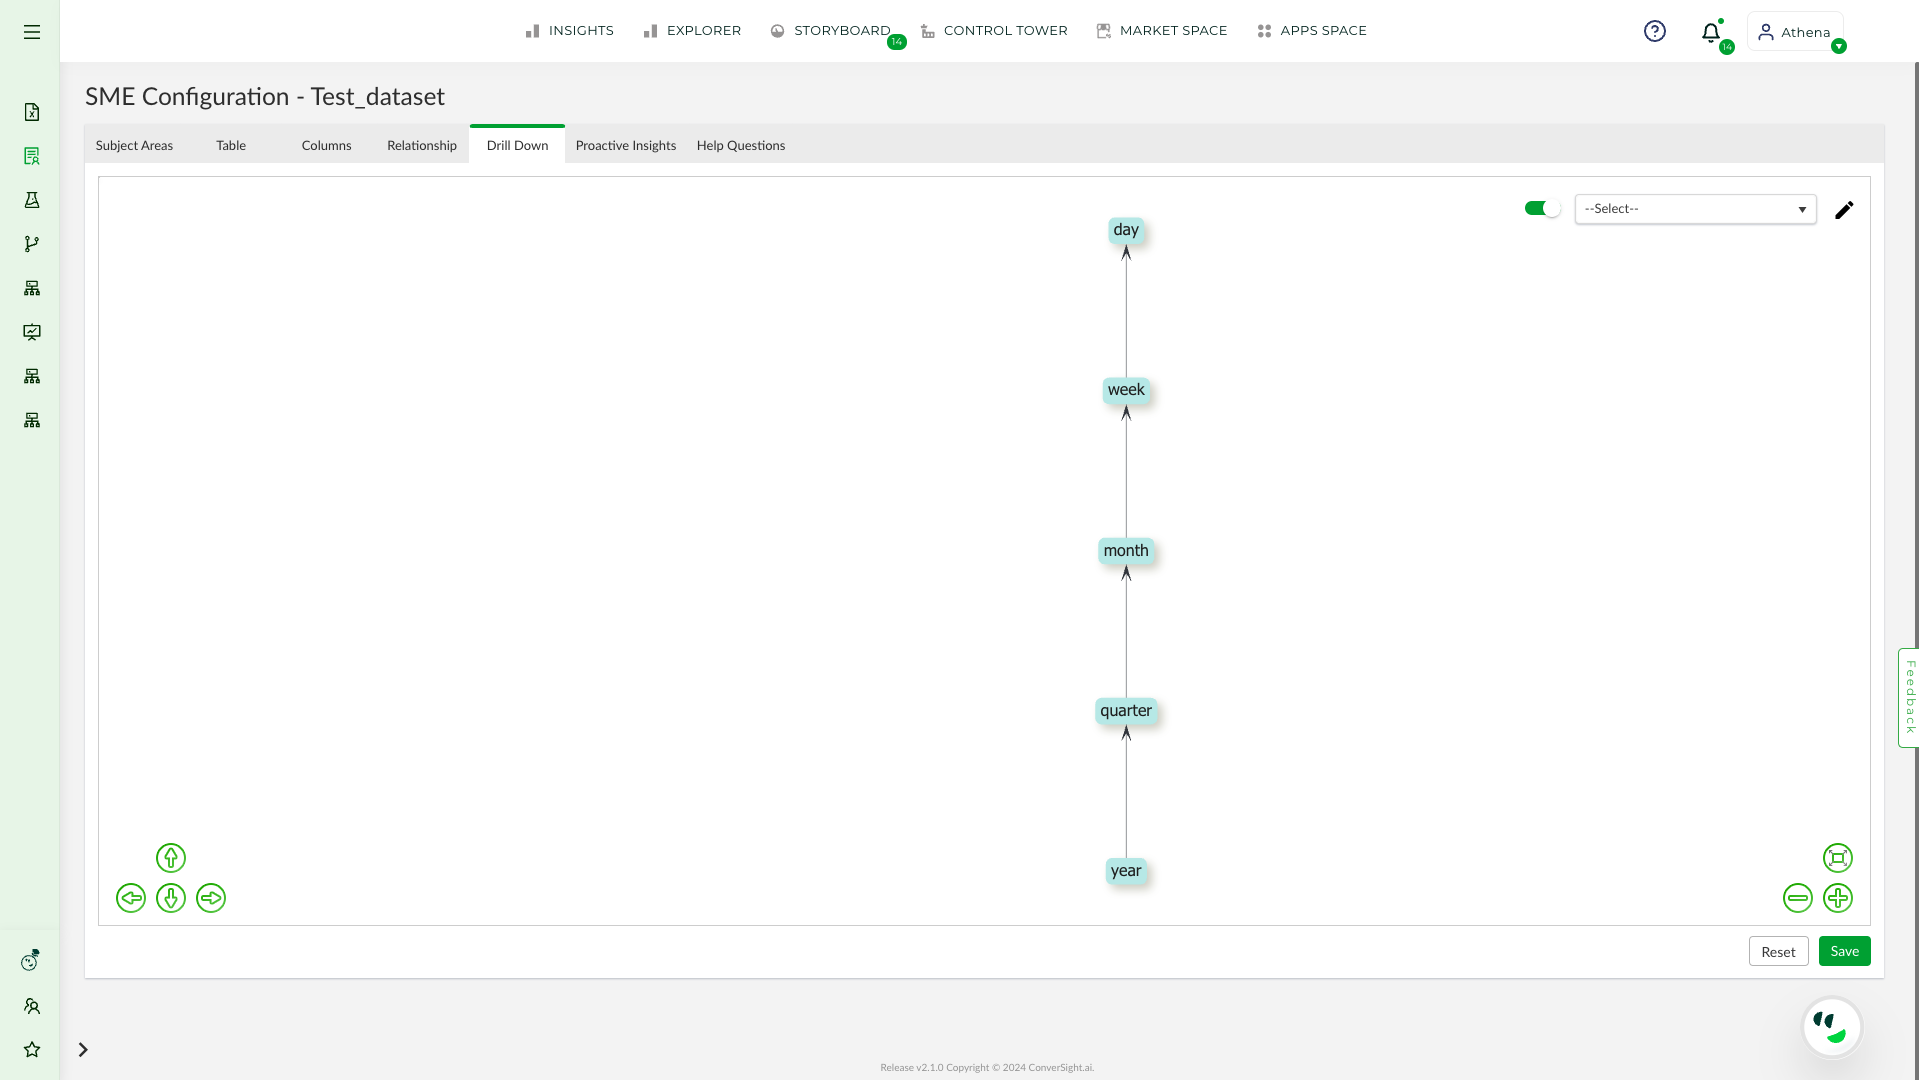
Drill Down Page#
To watch the video, click on Drill Down.
How to Create a Drill Down
By clicking on the
 icon enables users to both edit existing Drill Down structures and create new ones. Clicking on the
icon will also display a list of available columns within the dataset on left side of the page.
icon enables users to both edit existing Drill Down structures and create new ones. Clicking on the
icon will also display a list of available columns within the dataset on left side of the page.
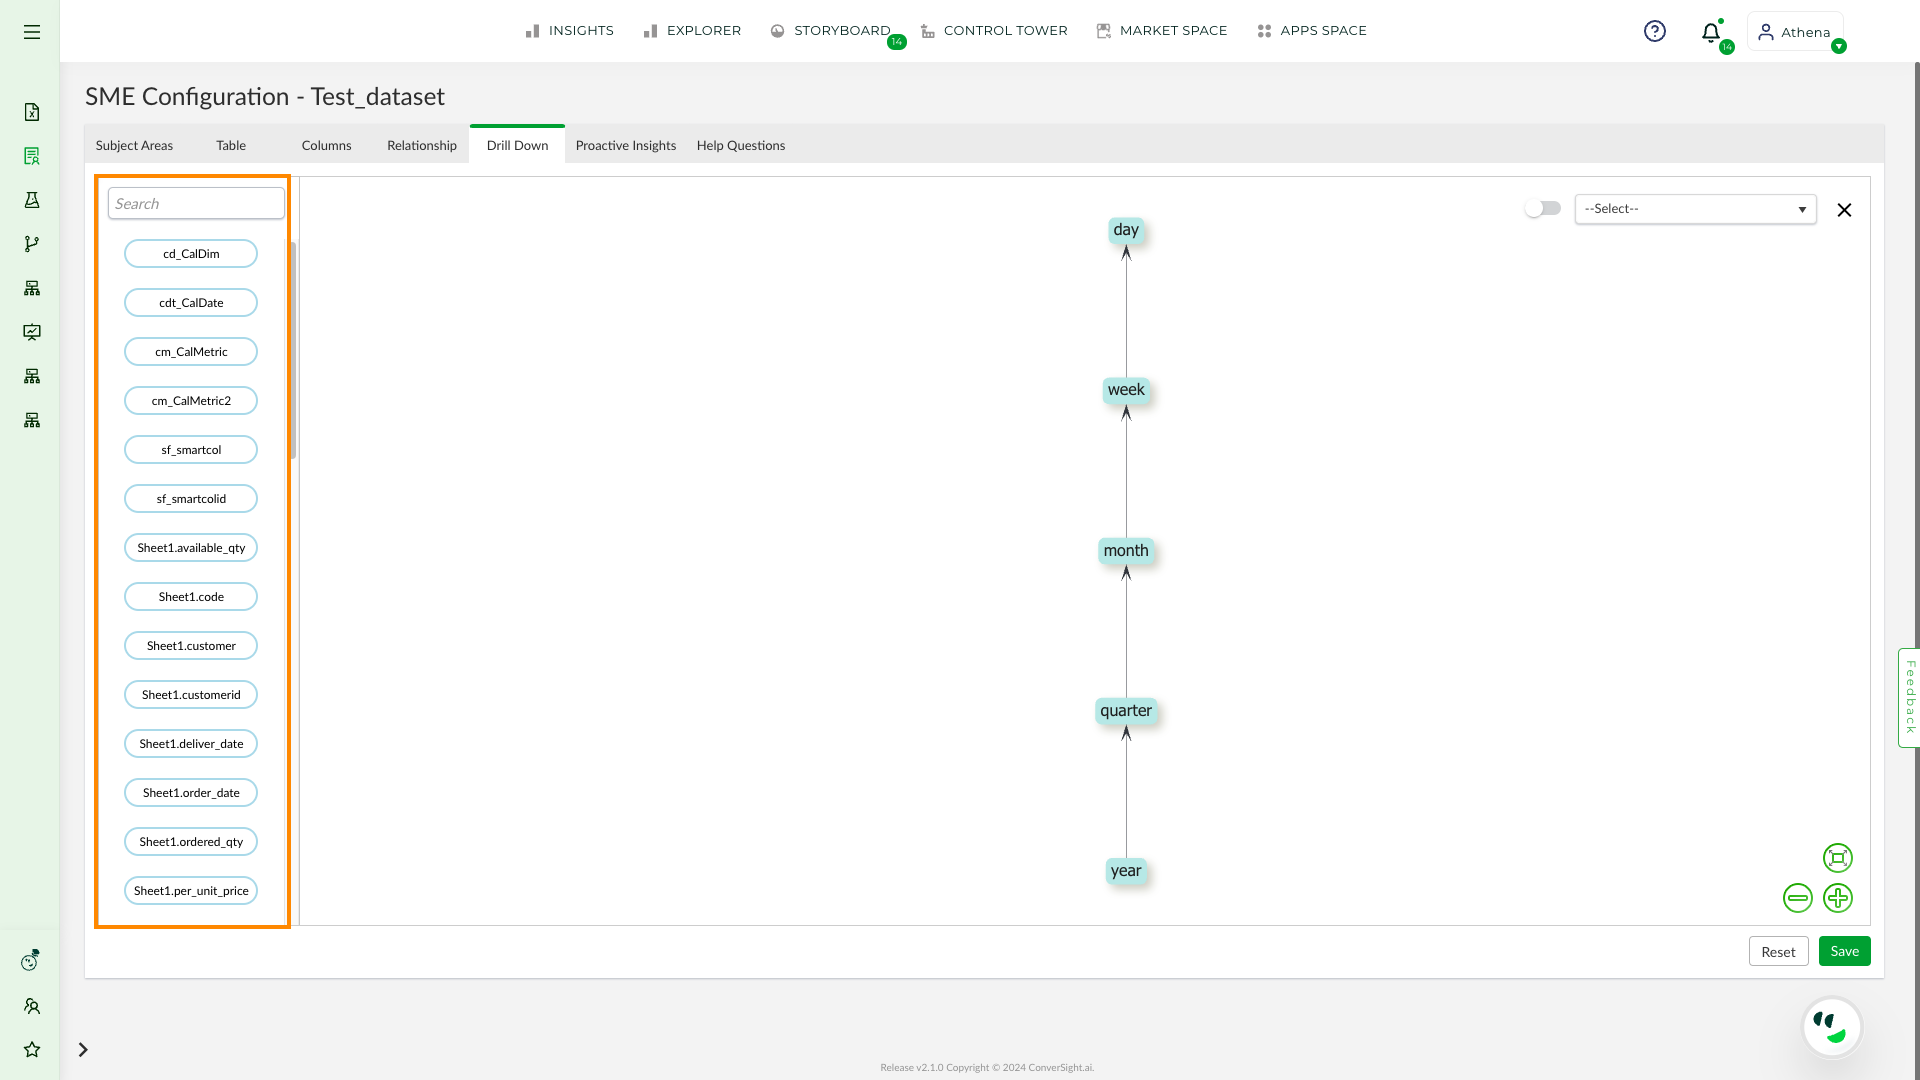
List of Available Columns#
Users can drag and drop the columns onto the screen for which user intended to establish a hierarchy. On the left-hand side, the arrows enable the user to shift the structure horizontally, vertically or diagonally. Meanwhile, the symbols on the right-hand side can be utilized to minimize or maximize the size of the structure.
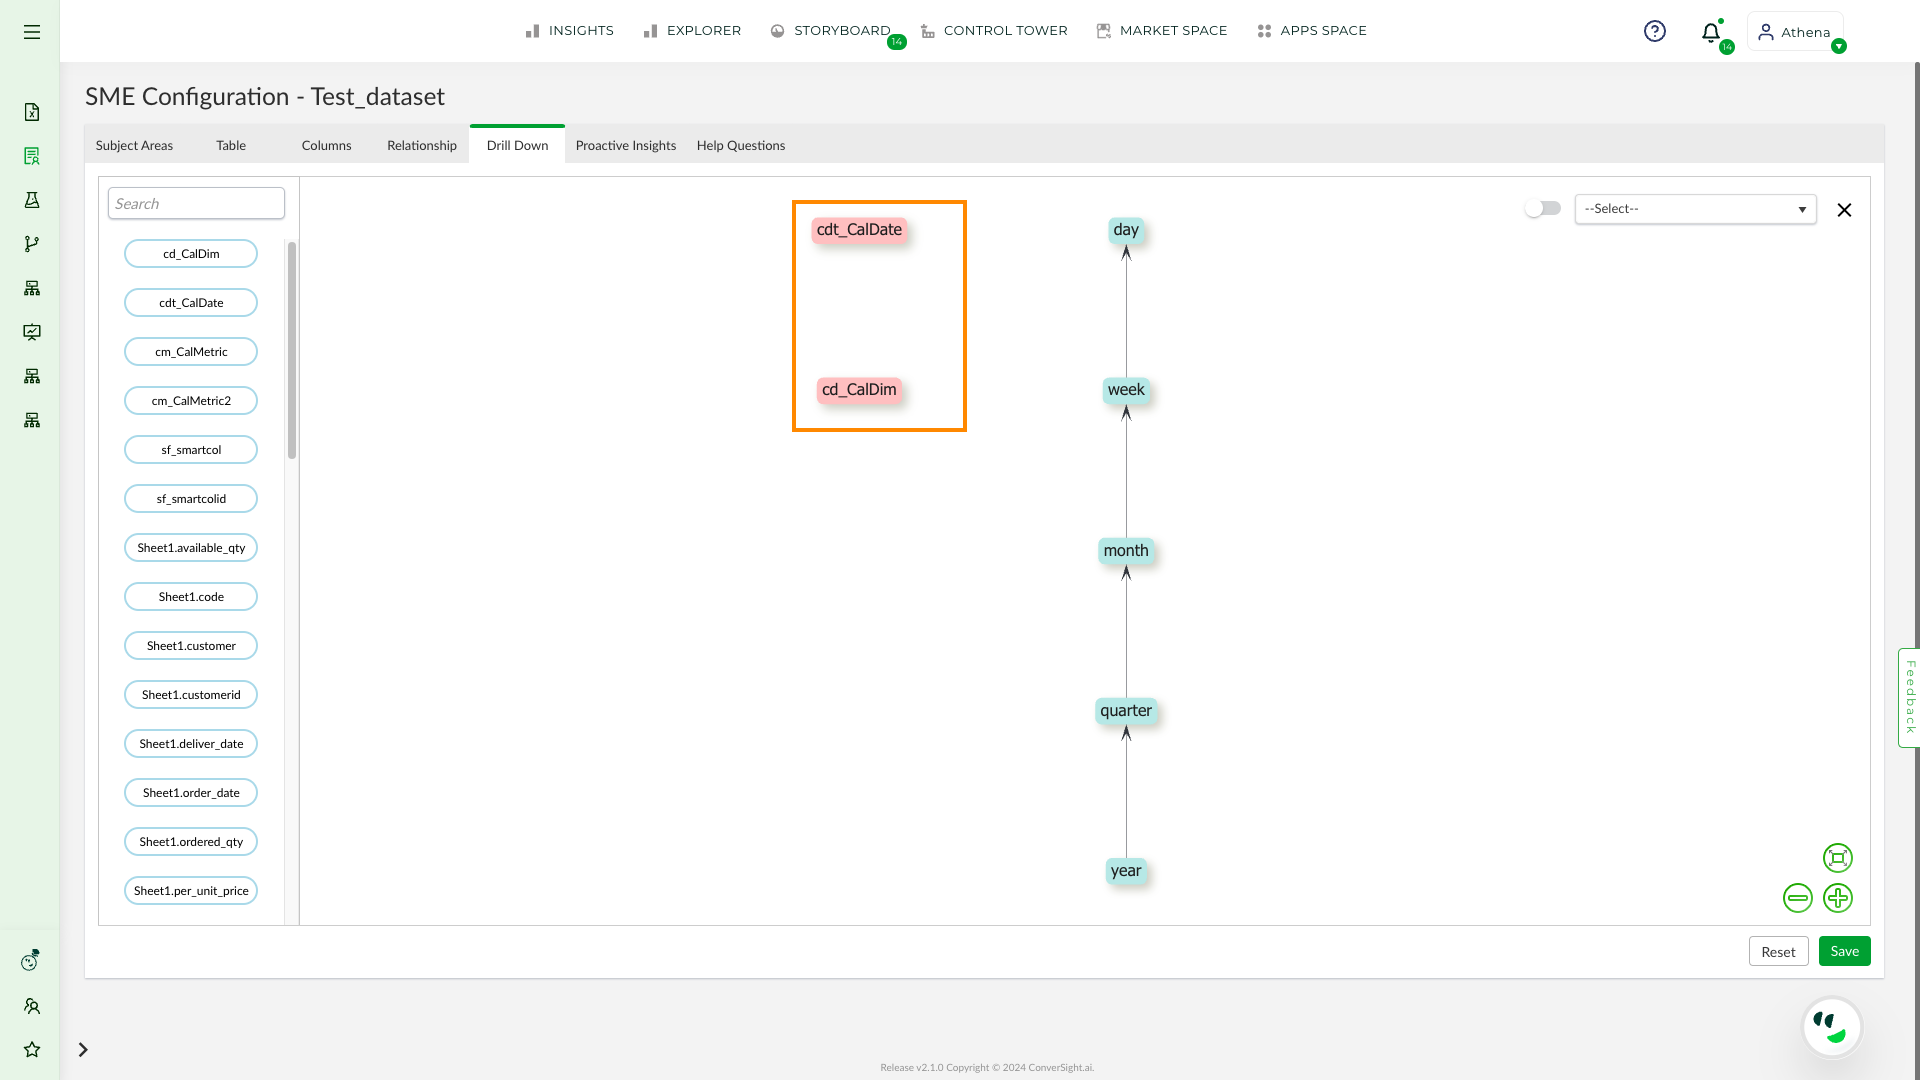
Drag and Dropped Columns#
To create a connection between two columns, users can click on the dragged and dropped column name and select the arrow icon from the displayed icons.
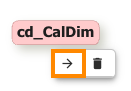
Drag and Dropped Columns#
The columns can be connected by the user dragging the arrow and clicking on the arrow, the corresponding icon allows for the removal or editing of the arrow.
Arrow Options#
Additionally, if a column is no longer required, users can utilize the delete icon to remove it from the hierarchy.
Delete A Column#
Click on Save button to save your changes and go to Column Vocabulary page and click on Publish Button To publish the changes
Proactive Insights#
Proactive Insights tab efforts lead to the generation of insights, which are then presented in a tabular format. Insights created from Proactive Insights are brought to life and showcased on the screen of insights, providing a glimpse into the future.
Proactive Insight#
To watch the video, click on Generating Proactive Insights.
Create a New Insight#
To create an Insights, click –>CREATE NEW
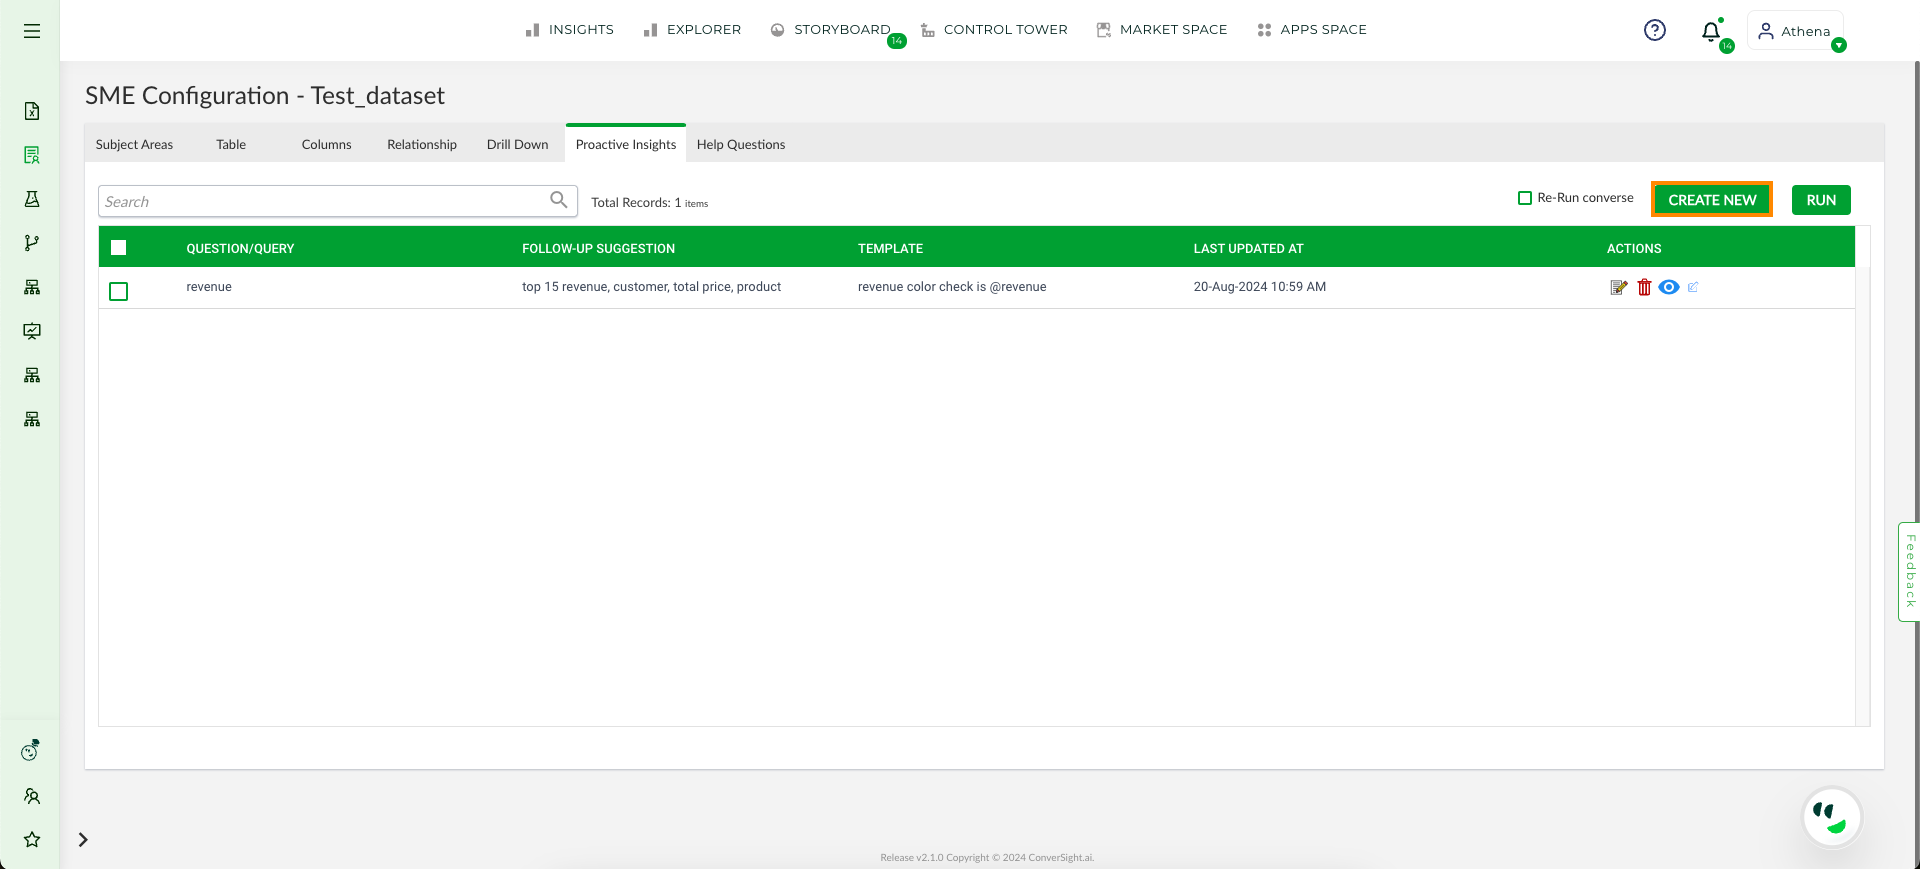
Create New Page#
Create New#
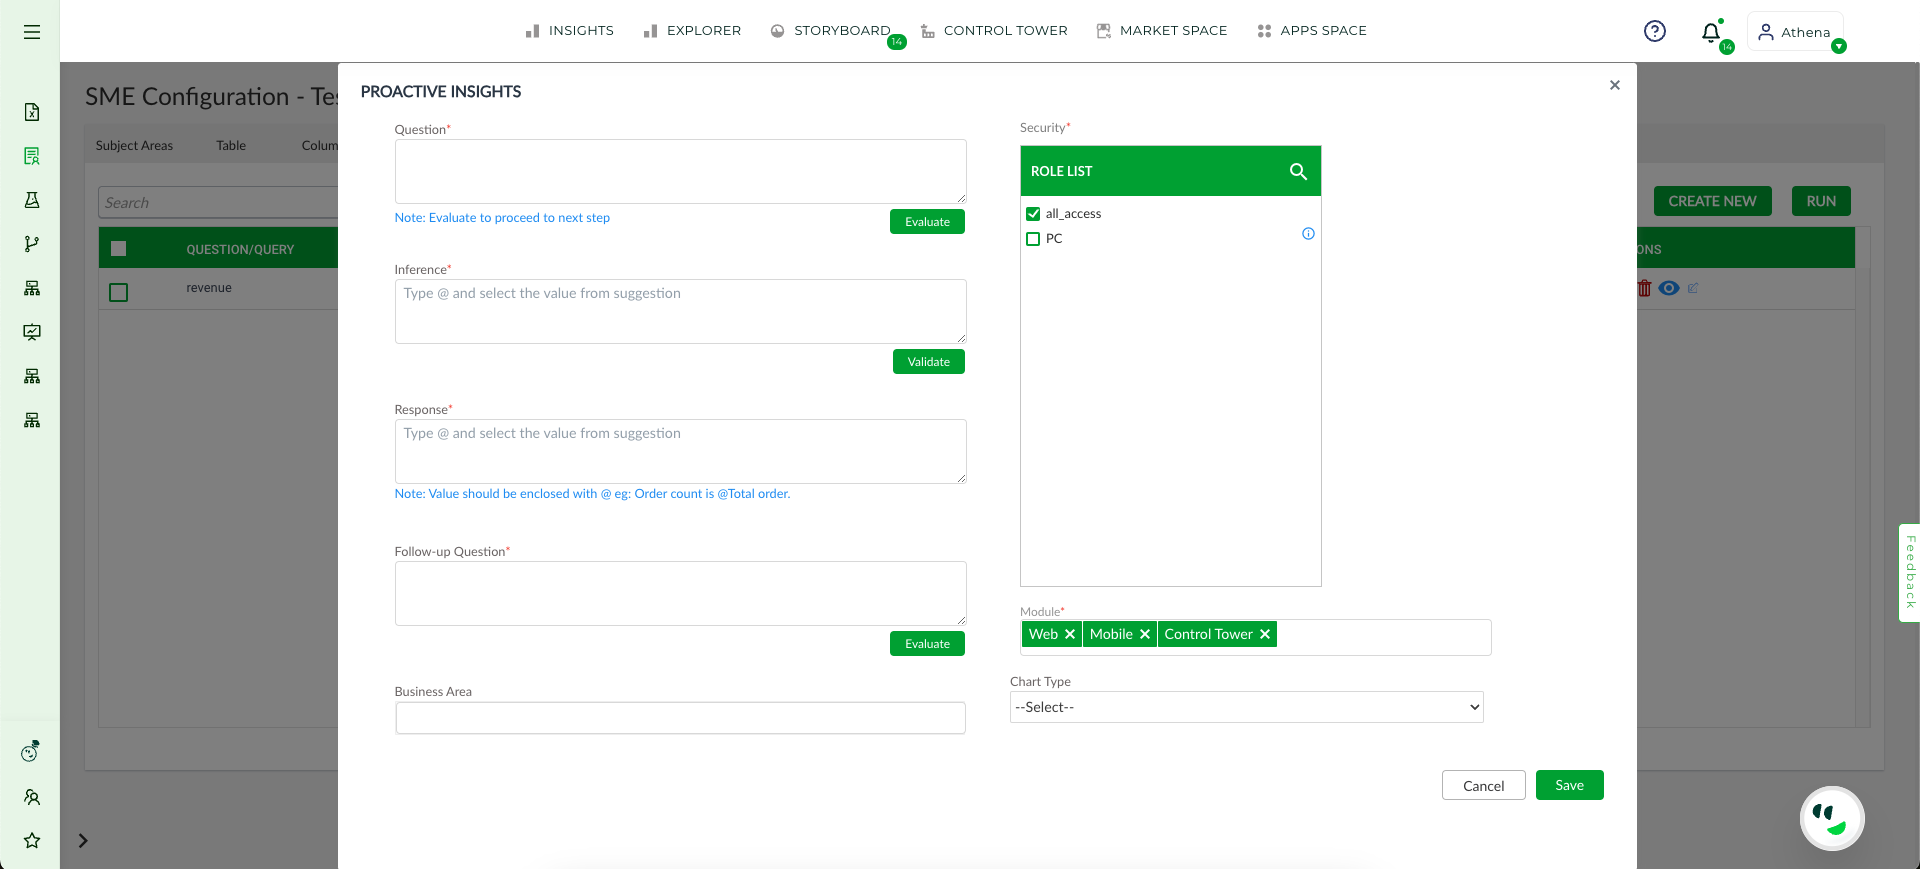
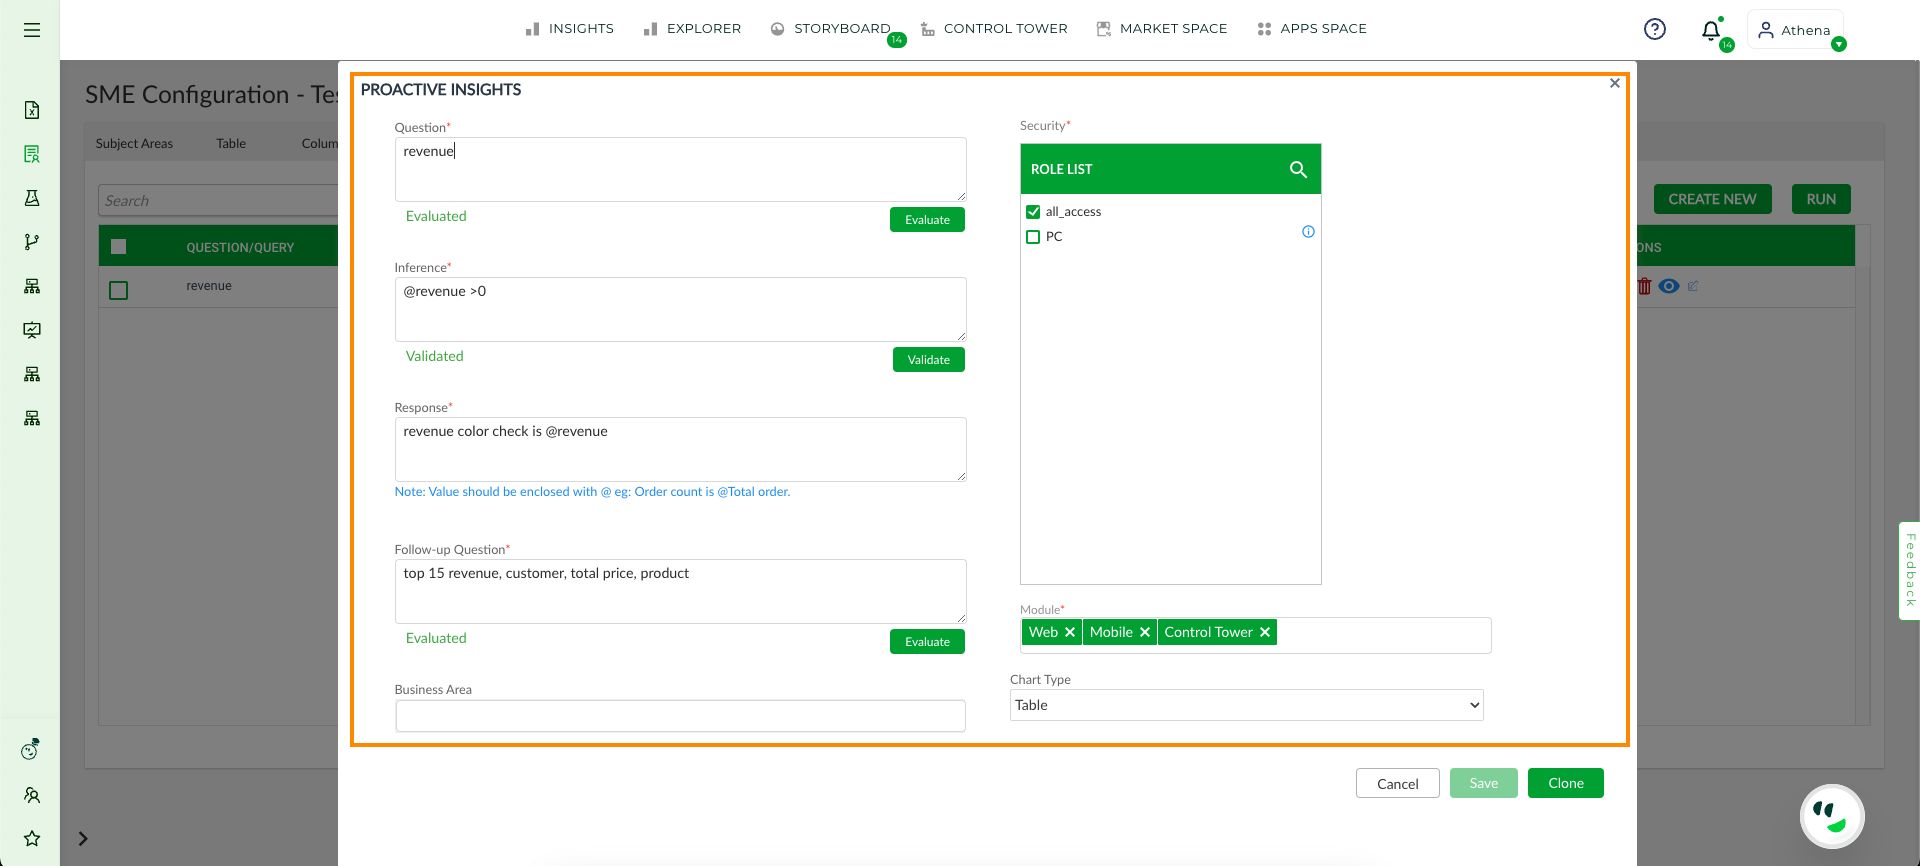
The CREATE NEW tab allows users to incorporate fresh insights into their project. In order to do so, they must supply a Question or Query which is then assessed to determine its output. Once the Question or Query has been entered, users may evaluate it by clicking on the designated button.
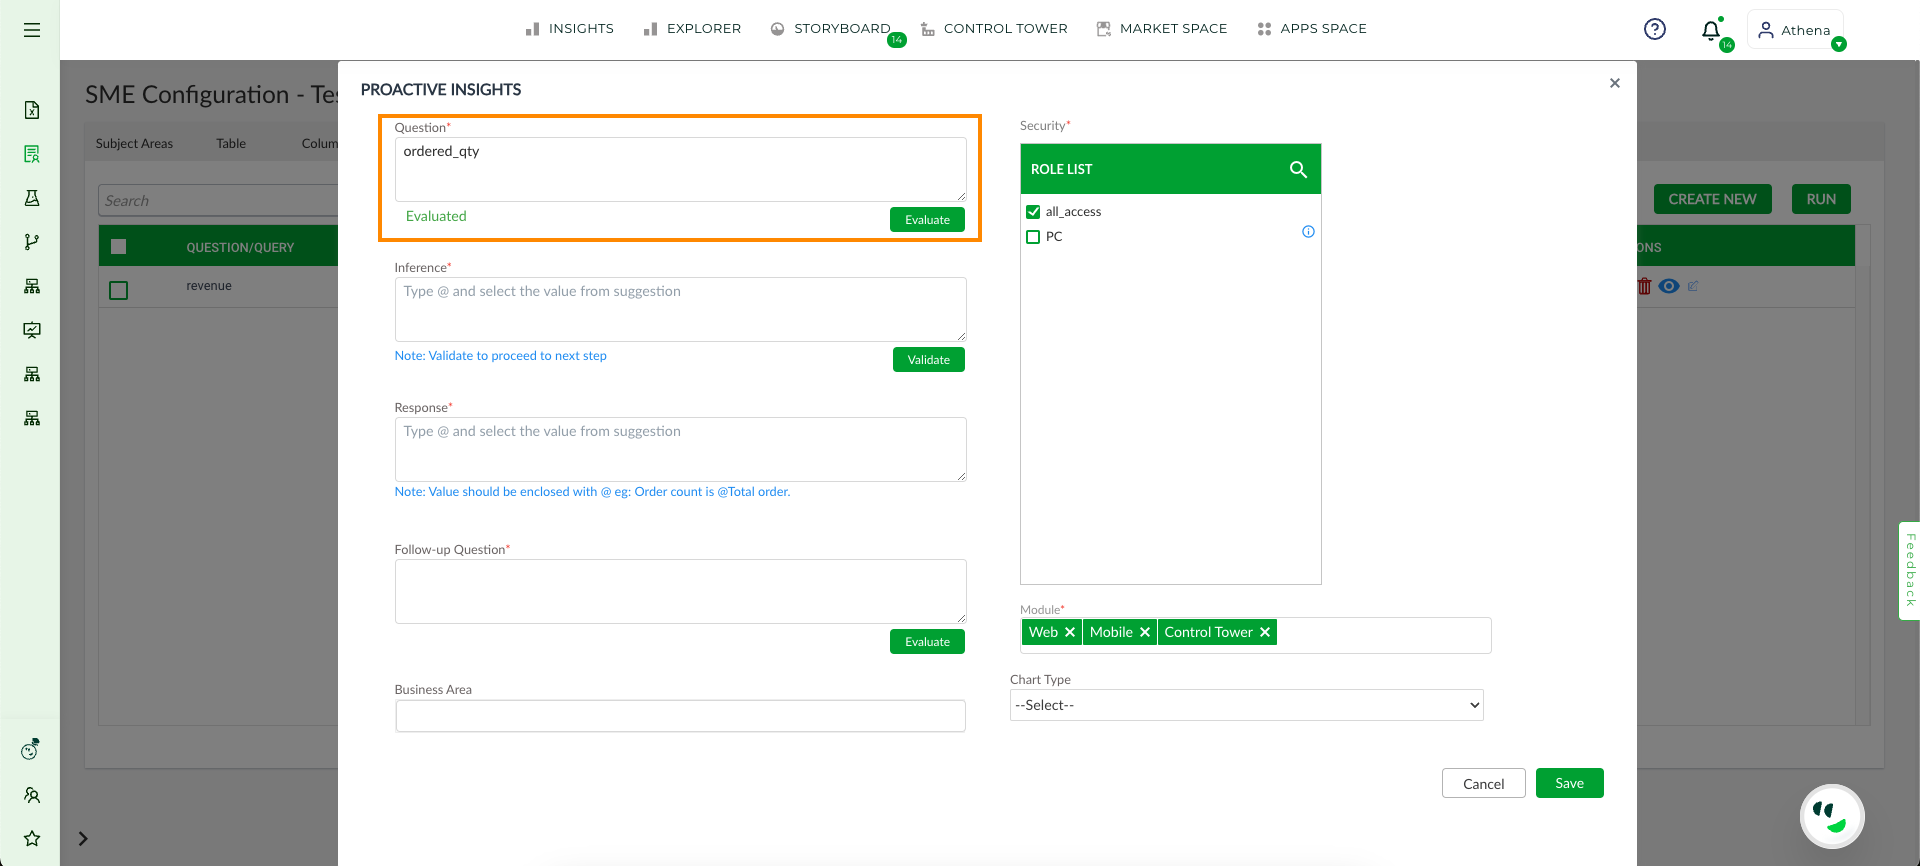
Question#
The Inference Textbox contains the criteria that trigger the alert response template for insight sets. Users have the flexibility to personalize and tailor the condition to their preferences and requirements. By typing “@” symbol, users can retrieve a list of synonyms that correspond to their Question or Query. The user can validate their condition of their input by selecting the Validate button.
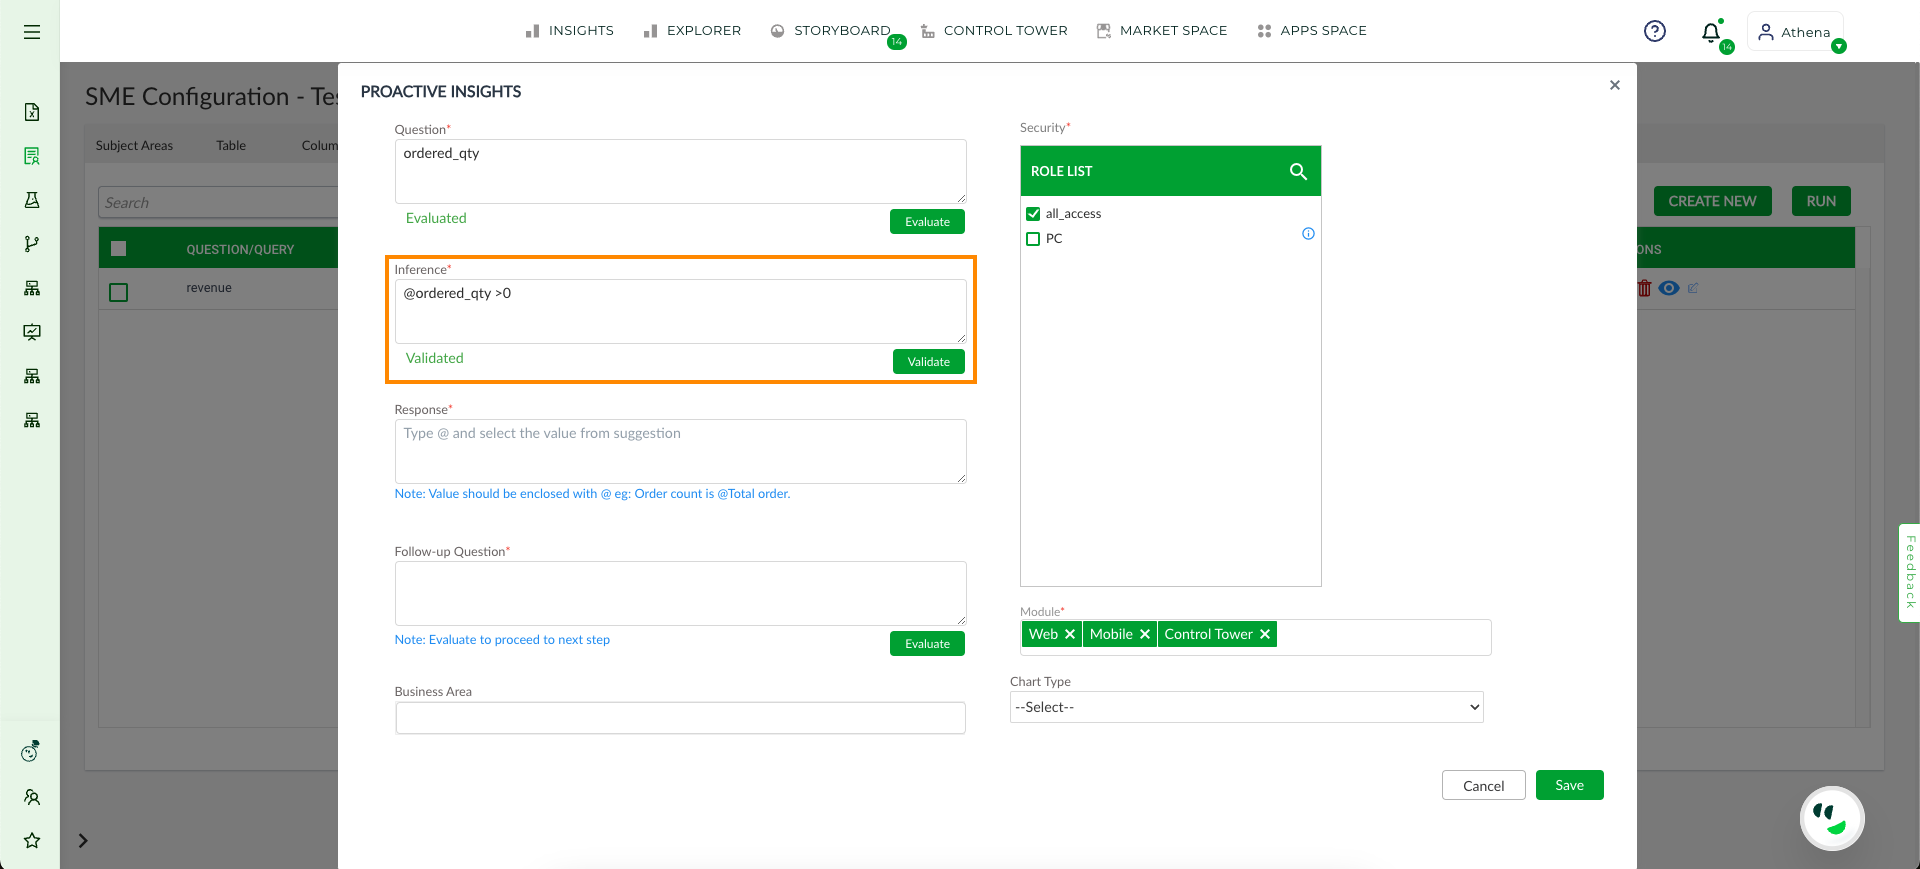
Inference#
The Response Textbox is utilized to input a template that will be displayed alongside the Insight Charts. The Response Textbox acts as alert response template for the user. This information serves as an additional source of knowledge for the user and includes the column-generated values that are denoted by “@” followed by the respective column name.
The Follow-up Question Textbox is designed for users to enter a question that is likely to arise after viewing the output of an insight. Users have the freedom to create their own Follow-up Question, which can then be evaluated for its accuracy of their question.
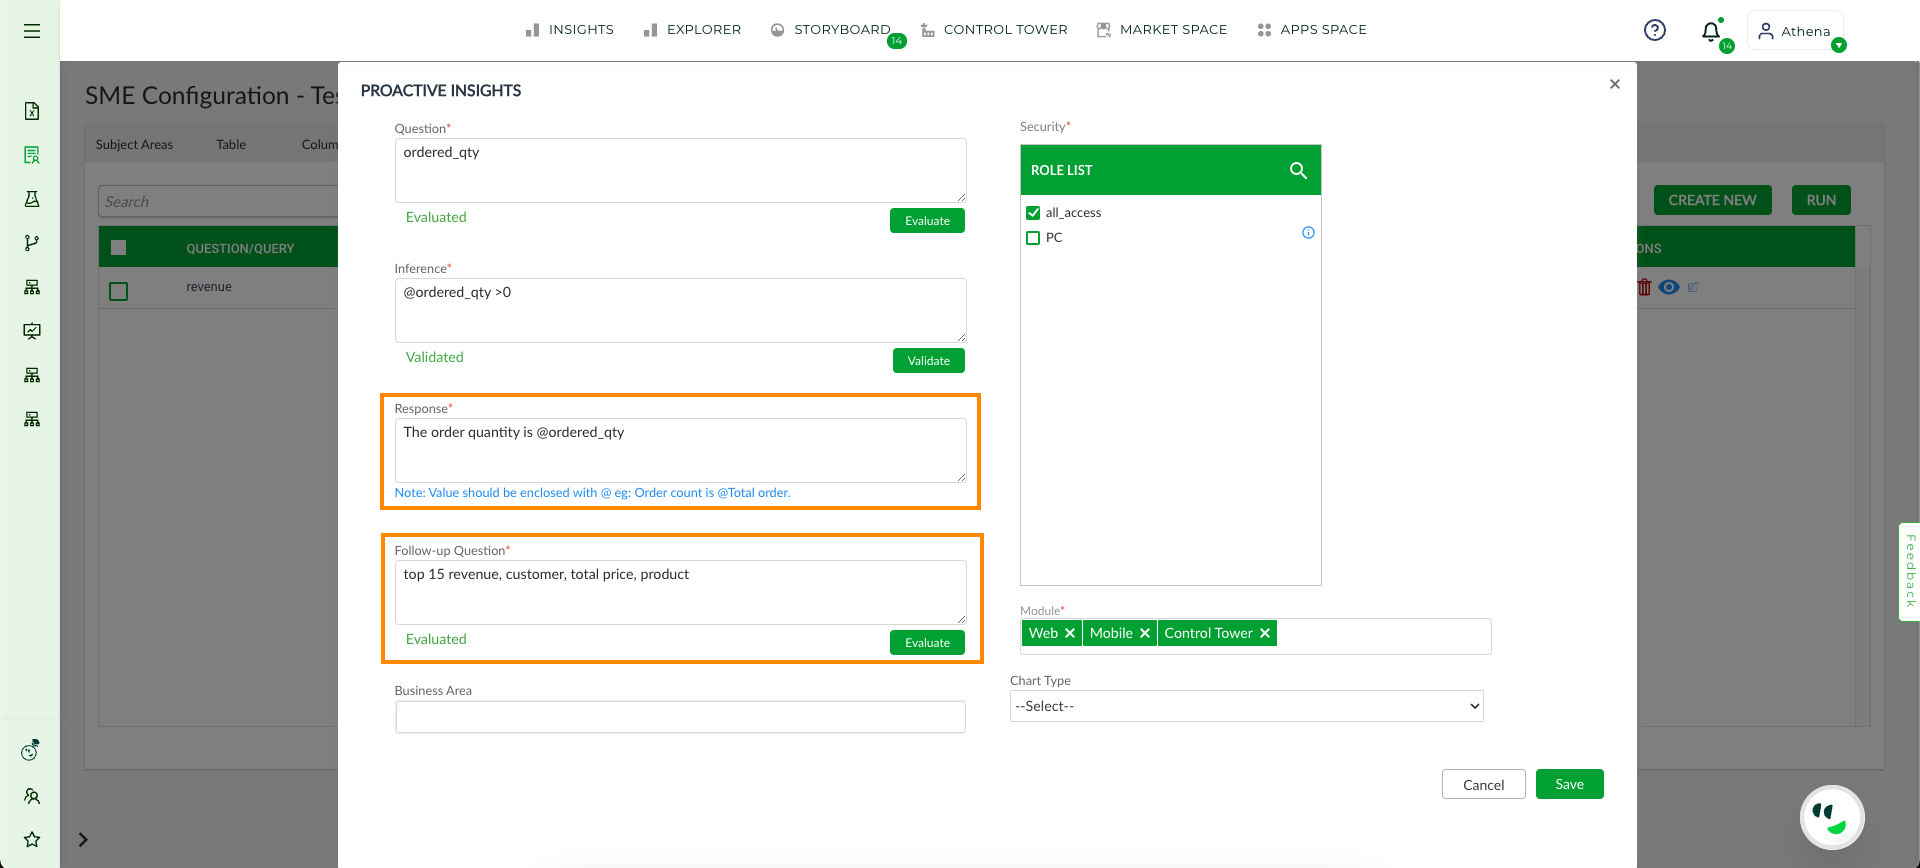
Response and Follow-up Question#
The Business Area can be used to create a narrative story by grouping insights with different tags, allowing for the integration of various insights into a single cohesive story.
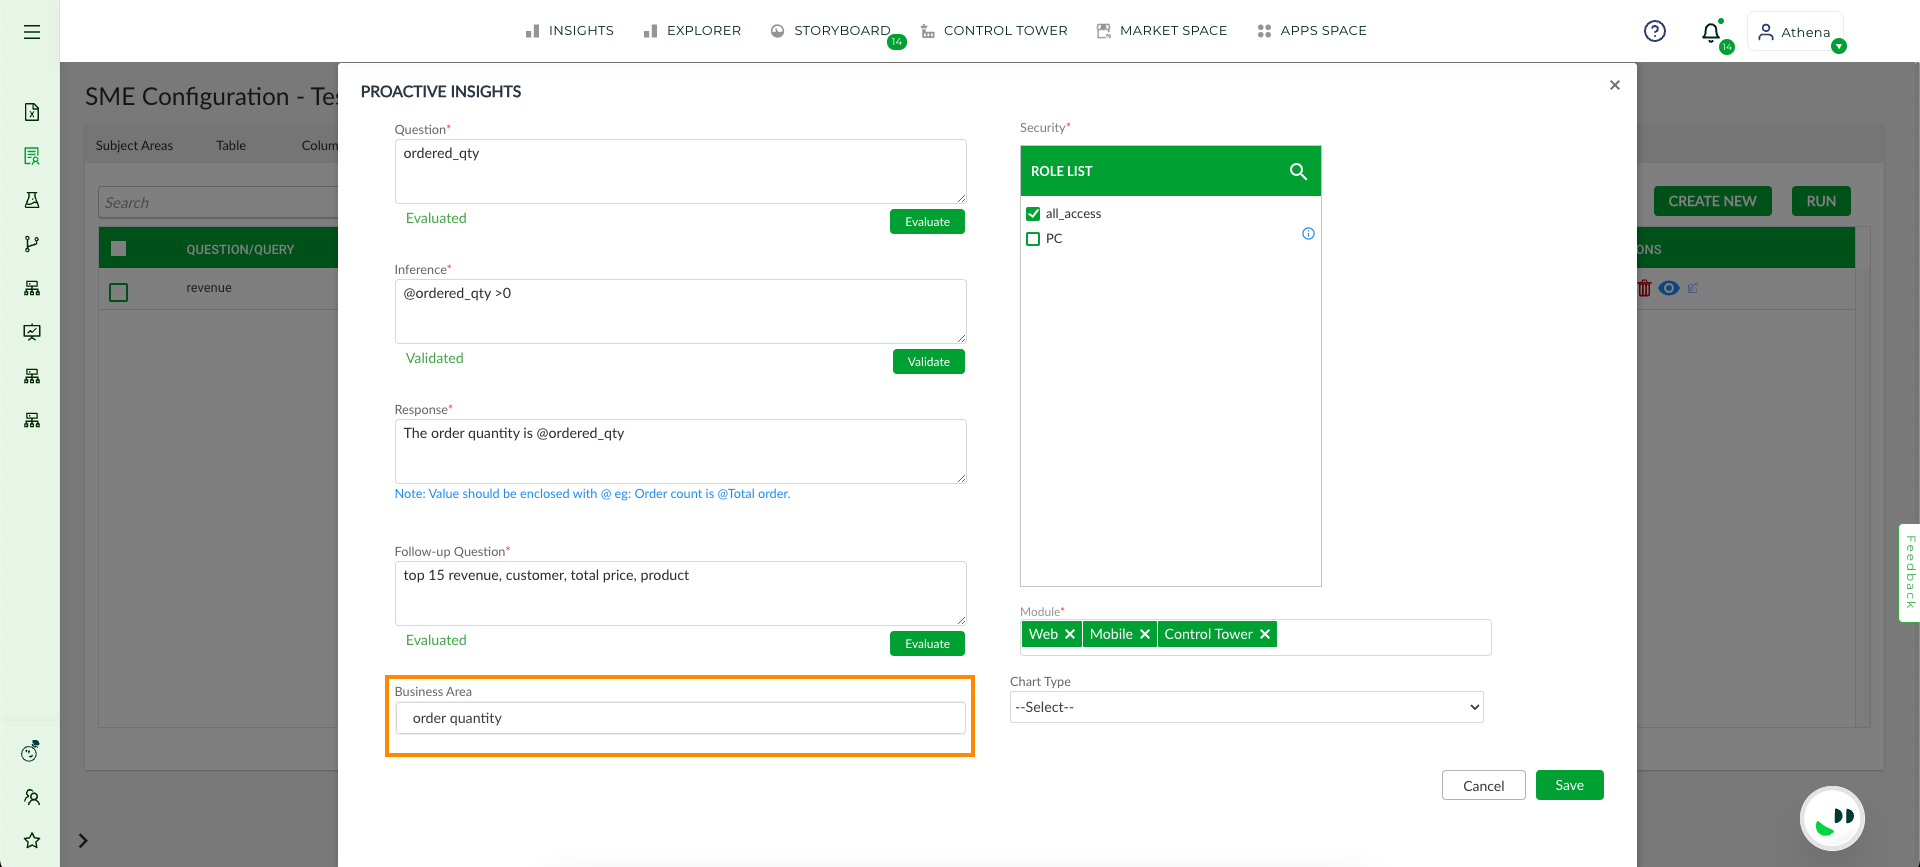
Business Area#
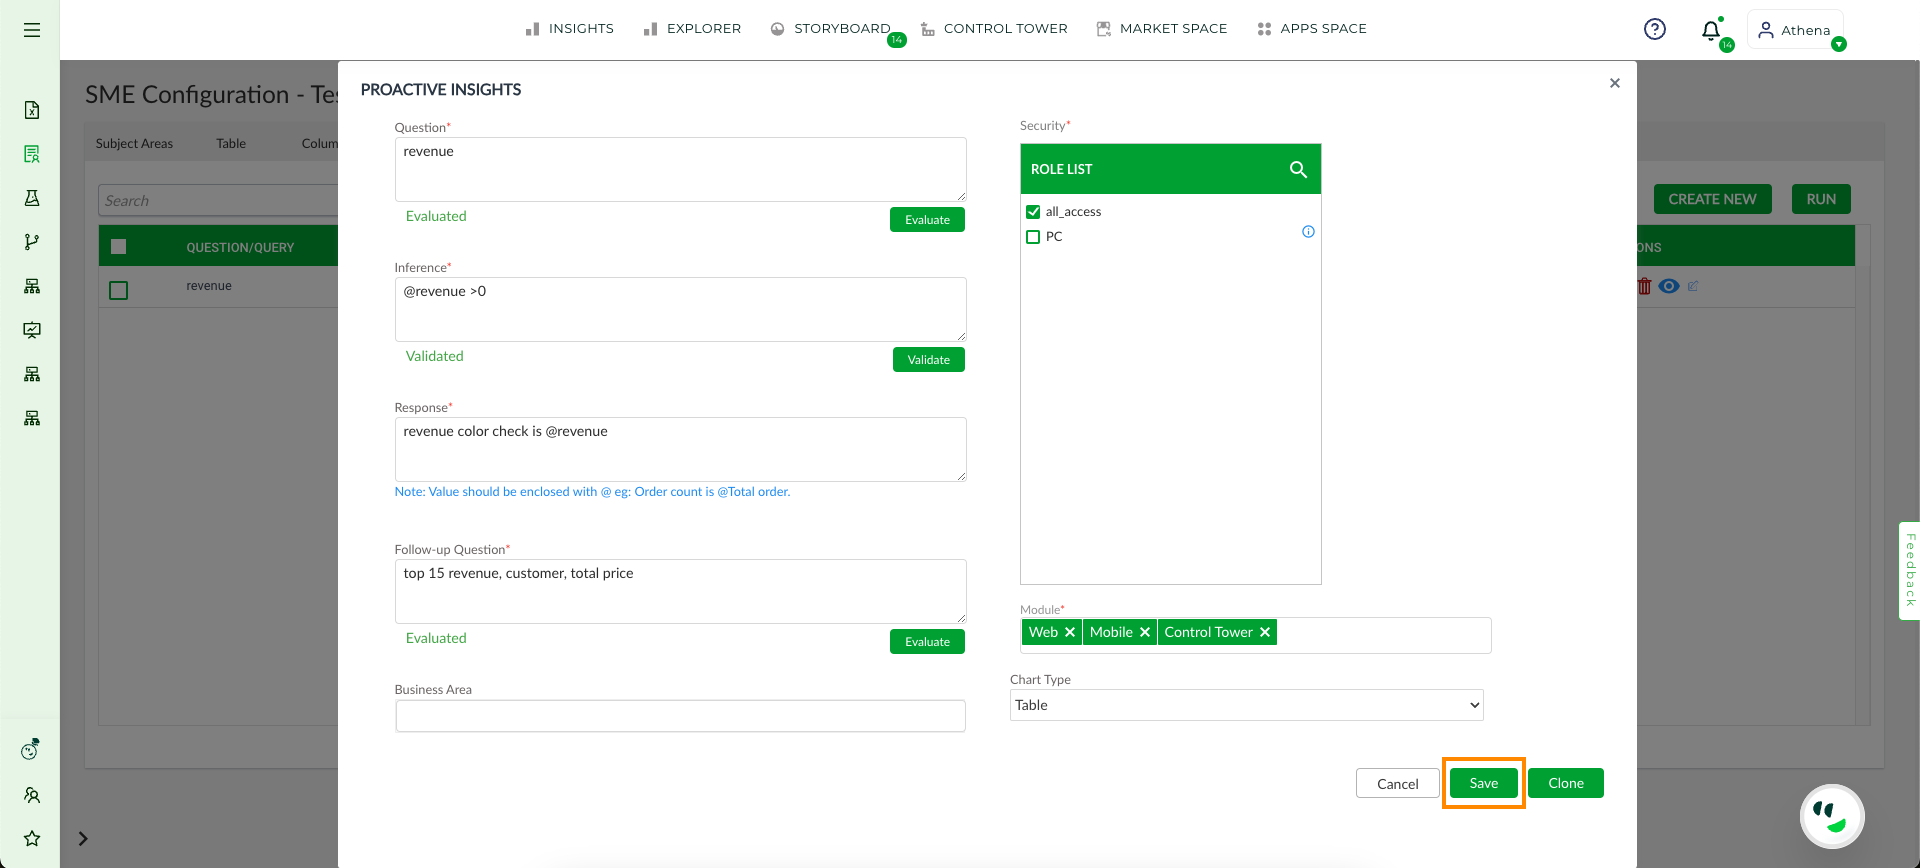
The Security Textbox displays all available roles associated with the data set, allowing users to grant permission to view insights by selecting the appropriate role and assigns multiple roles to insights. Users have the option to assign the created insights to specific modules that they choose in the Module text box. The Module is to decide where the insights should be displayed.
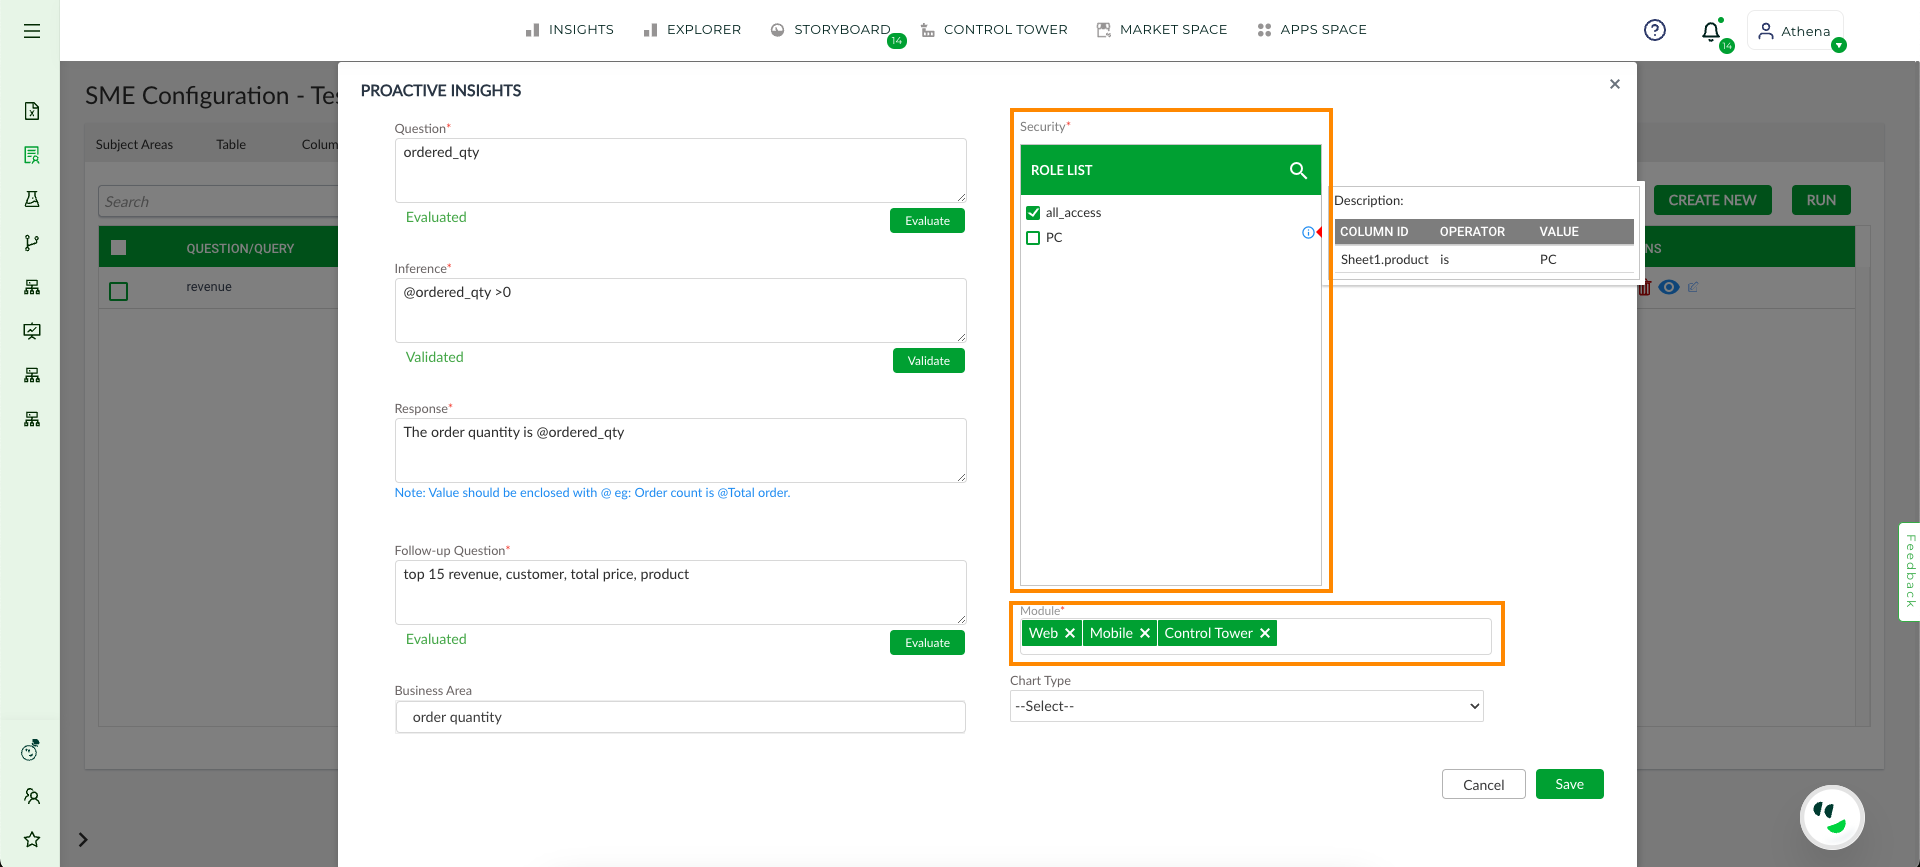
Security Module Save#
The Chart Type dropdown menu enables the user to select a specific chart representation or table format for their Insight. After providing the necessary details click the Save button to create a new Insight.
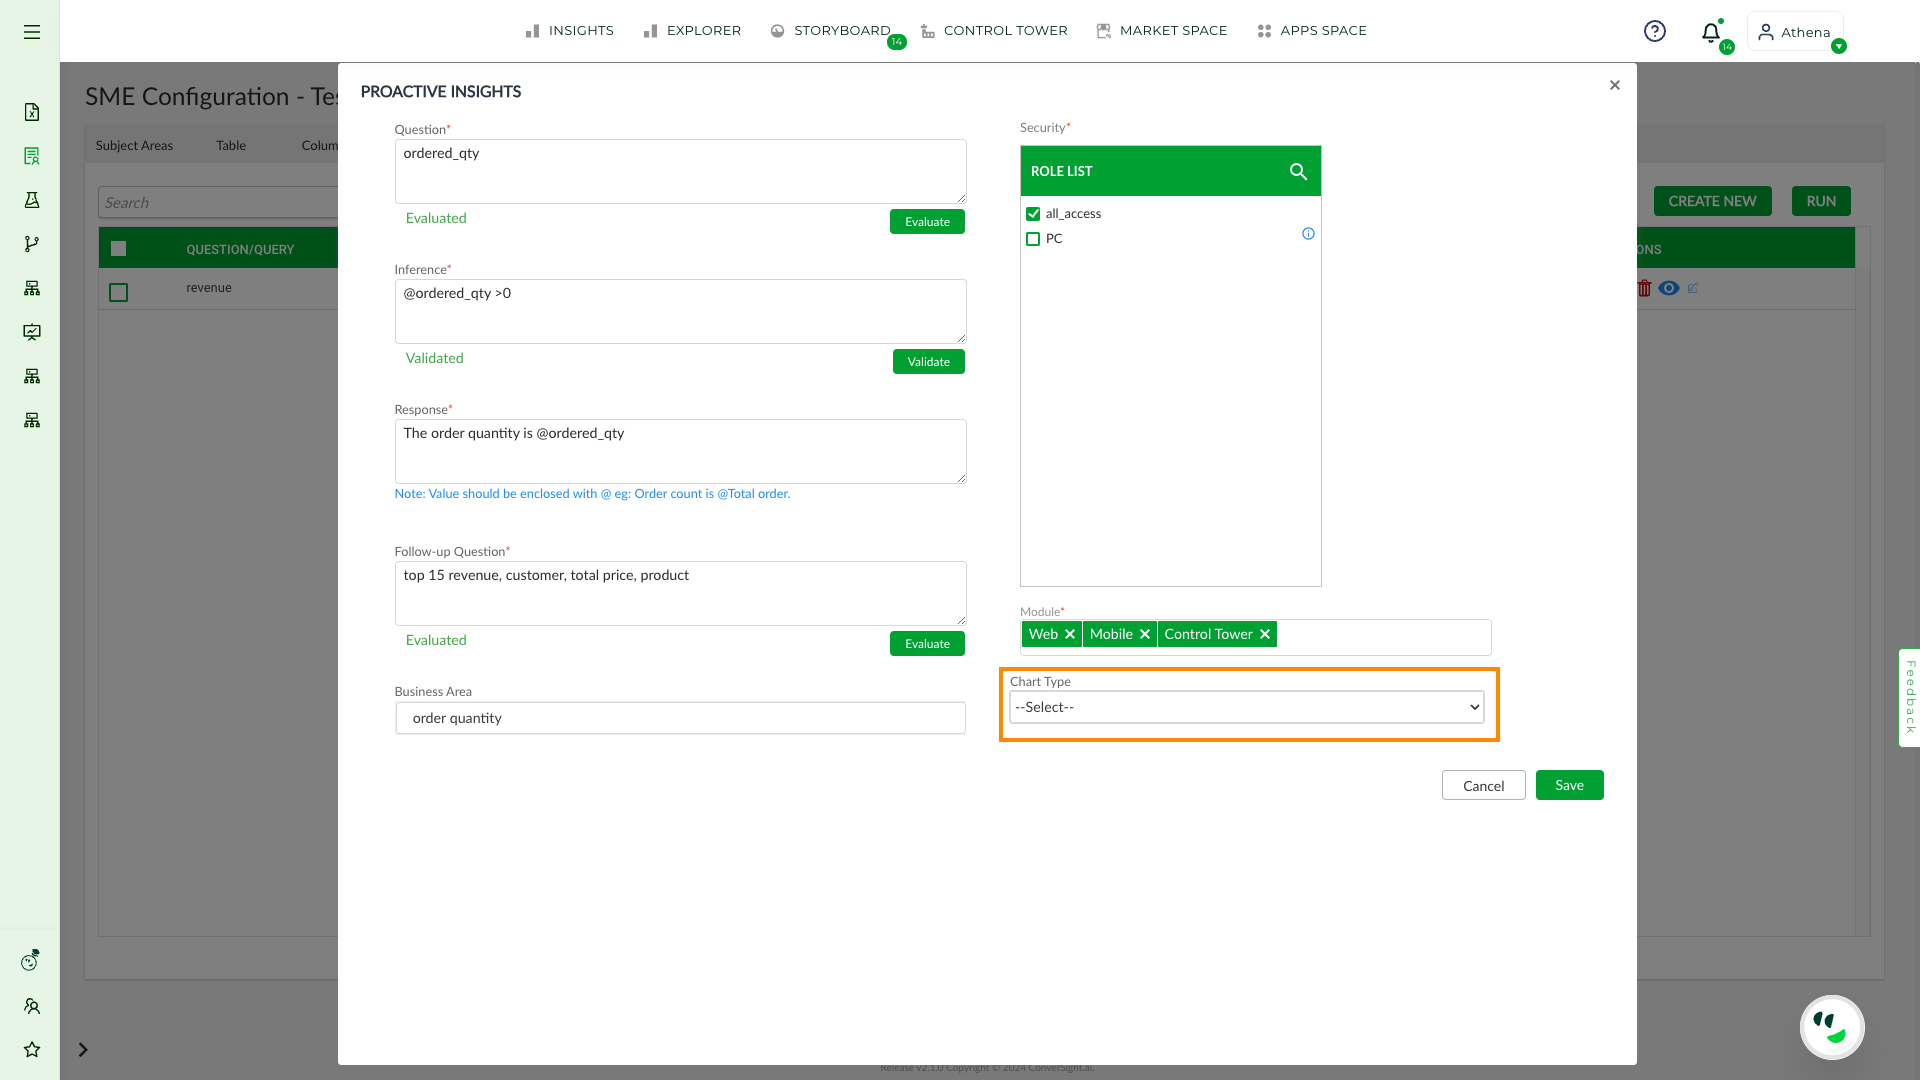
Chart Type#
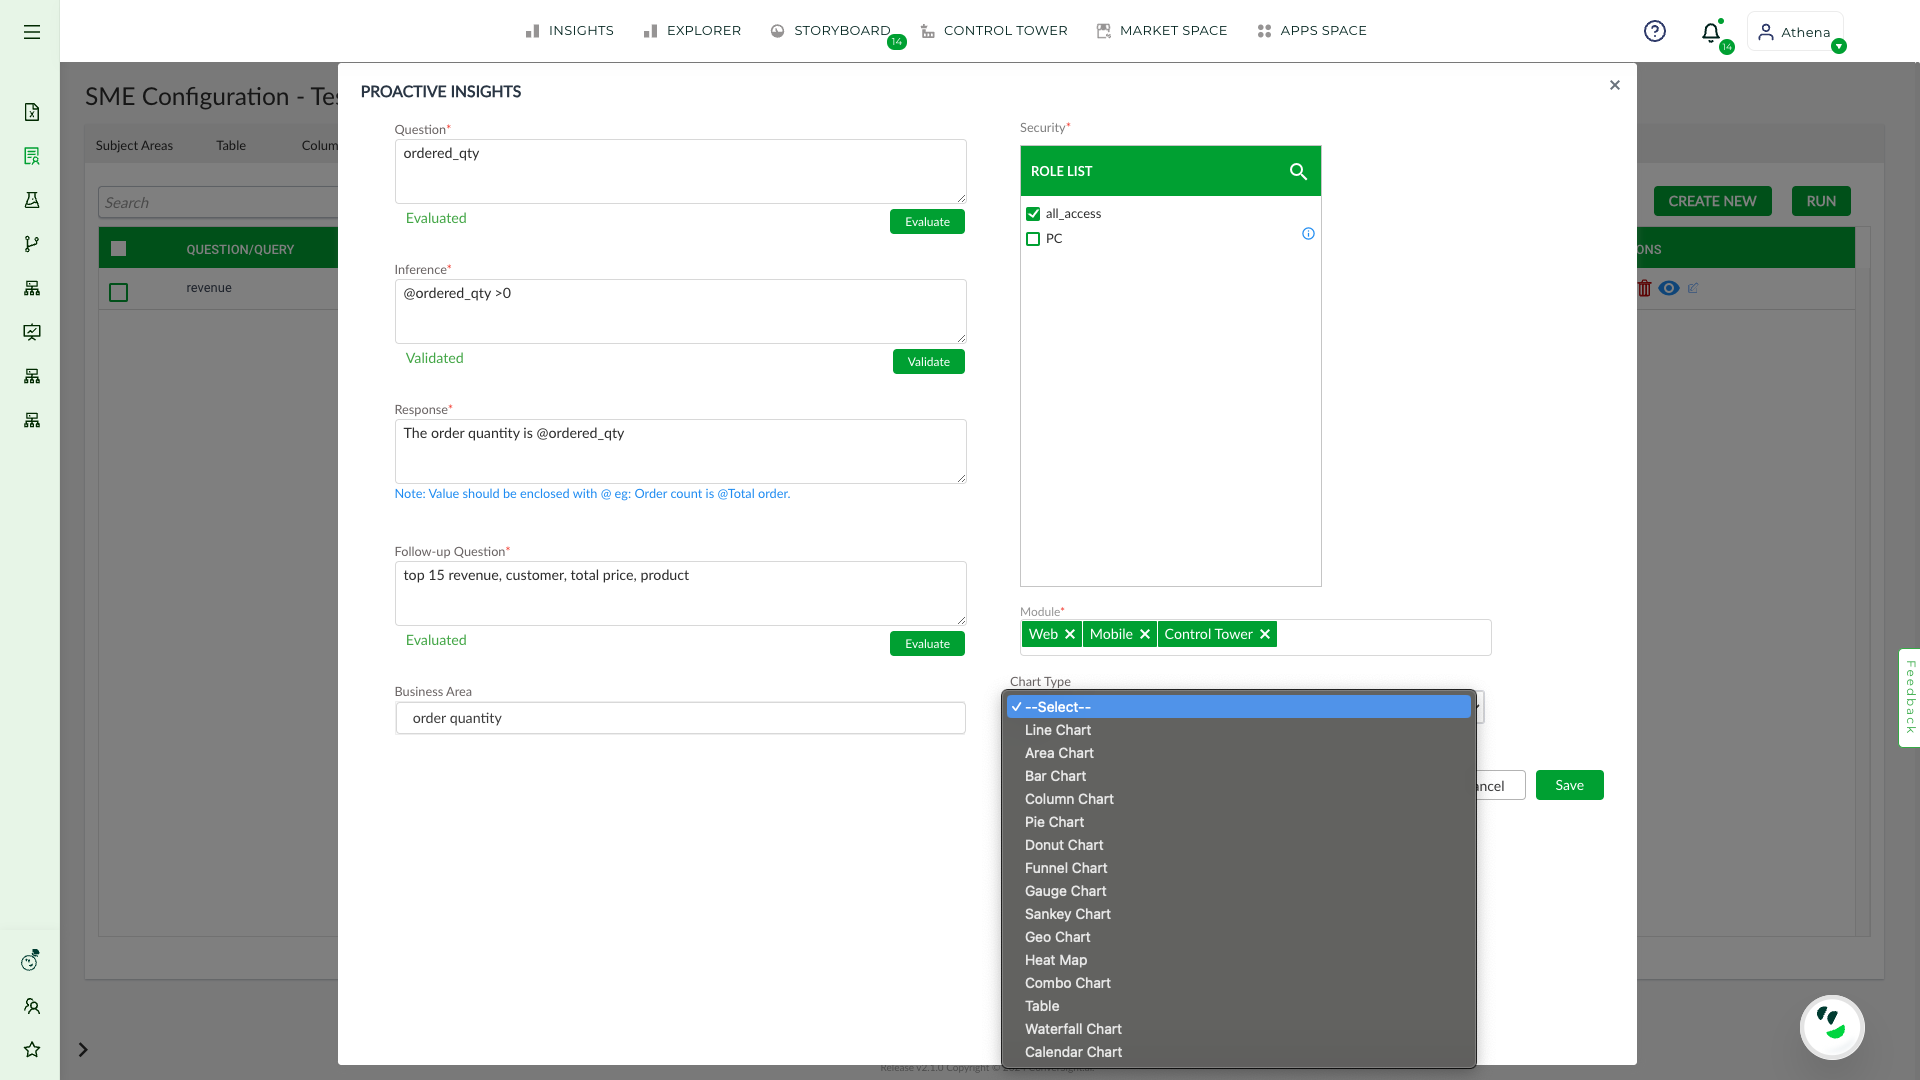
Chart Type#
Edit#
The user has the option to modify an existing insight by clicking on the Edit icon associated with that insight. This function also enables the user to create a copy of the existing insight. If a column containing evaluated or validated data is edited, the user must evaluate and validate the column again to save the changes.
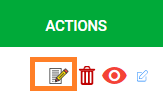
Edit#
Additionally, the user can easily clone an insight by simply clicking on the Clone button.
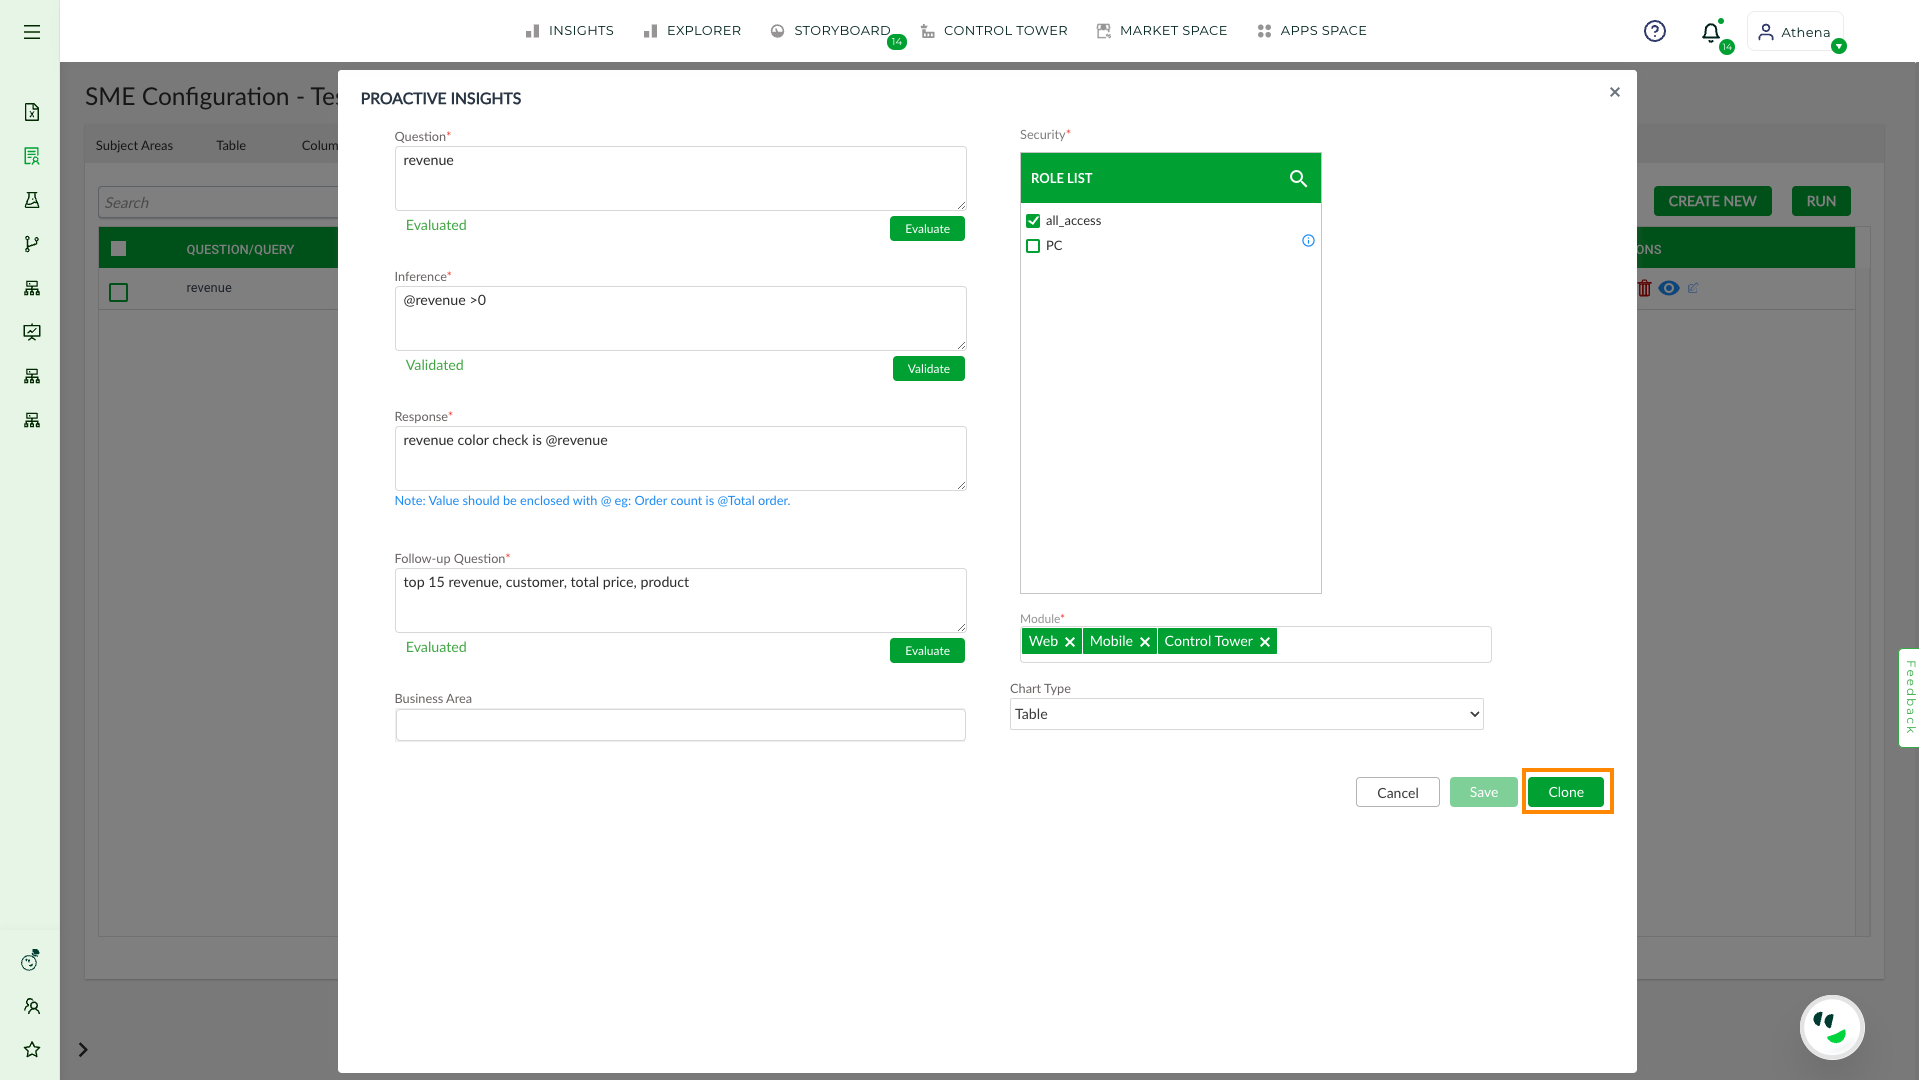
Clone#
Delete#
The Delete icon provides the user with the ability to delete an insight simply by clicking on it.
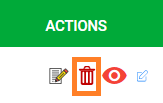
Delete#
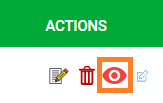
To Publish Proactive Insight Components#
To access the publish Proactive Insights Components, click on the Eye icon, which will direct you to the publish window. In this window, you can view the group and role access, the status of proactive insights for those groups or roles, the Executed response to display, the creation and last updated details. The status displayed is dependent on the access granted to the respective roles and groups. If the status is listed as “success”, you may activate the insight by toggling the activation button and then selecting PUBLISH. Insights are generated for each user’s individual based on their access roles and groups.
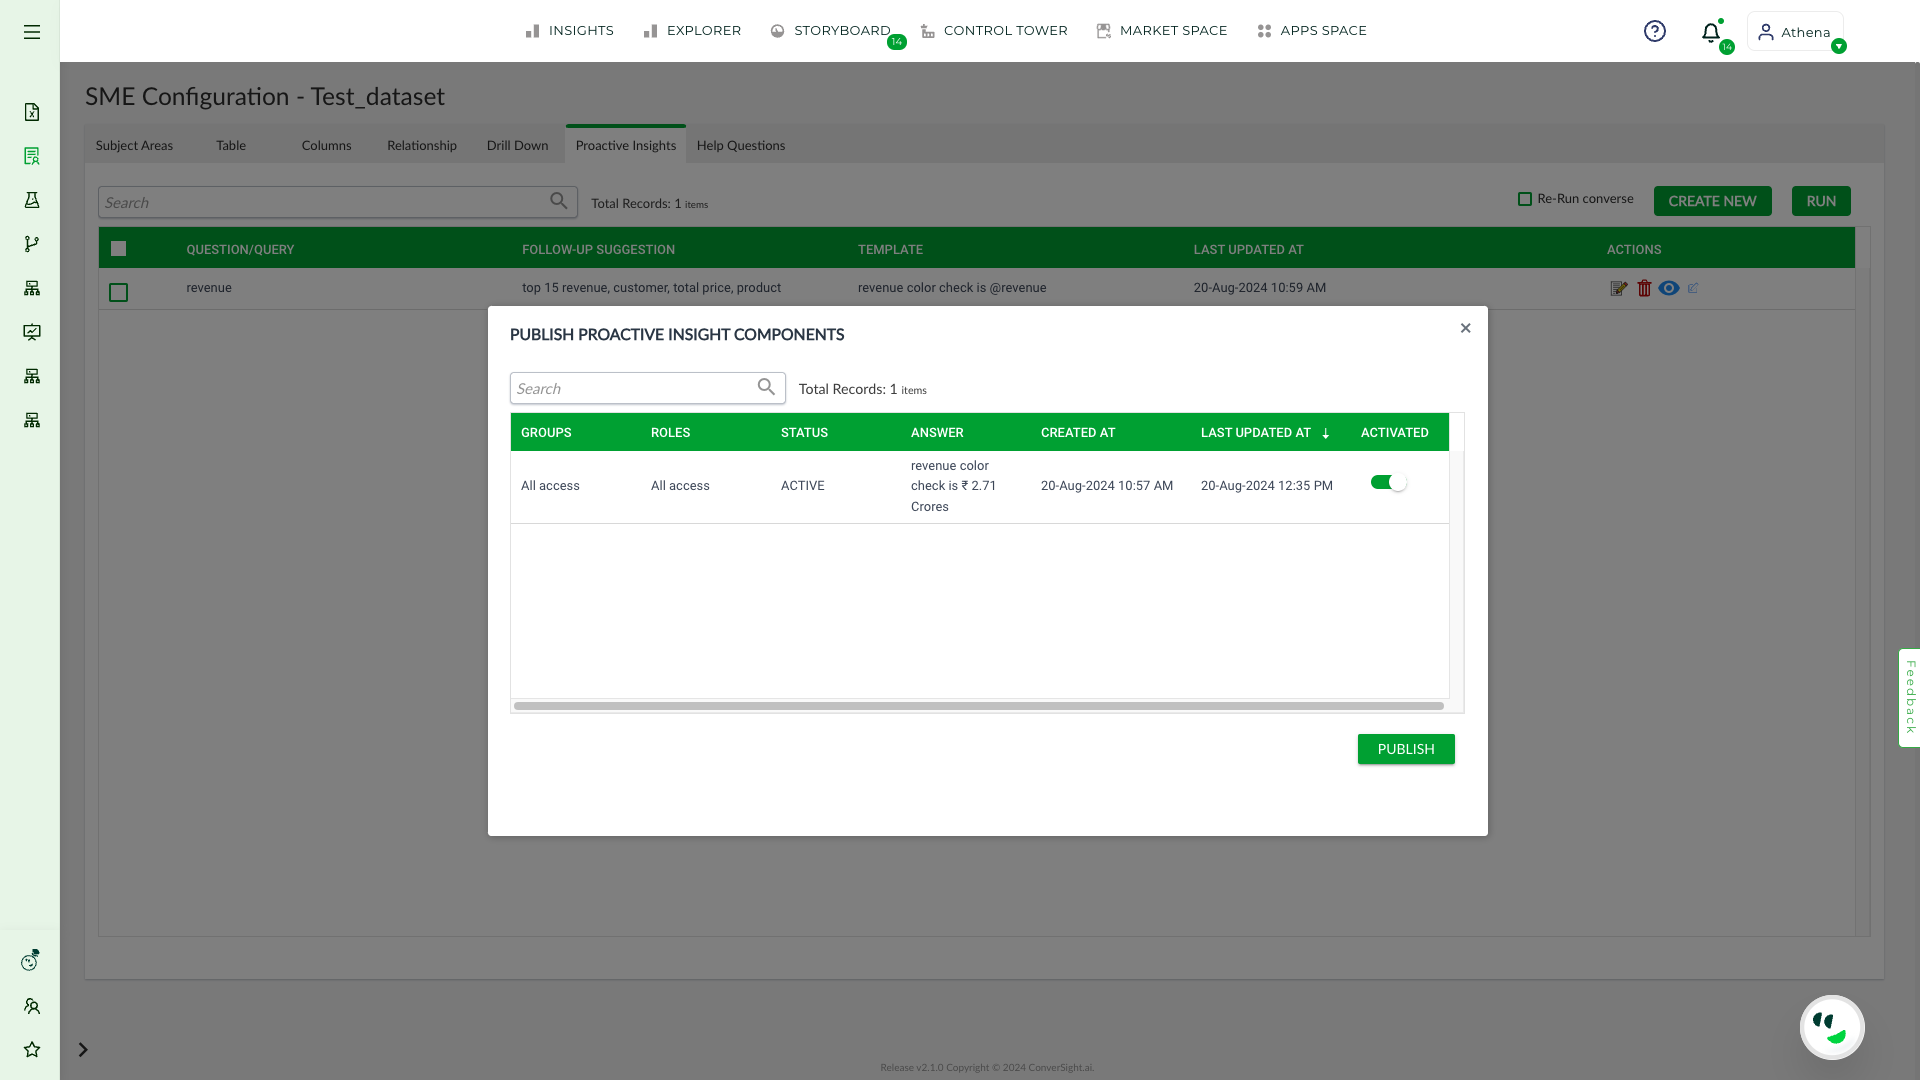
Publish#
Tag#
Tags are employed to classify insights and determine their appropriate category or business area to display. The addition of Tags to your insight is possible by clicking on the edit icon.
Tag#
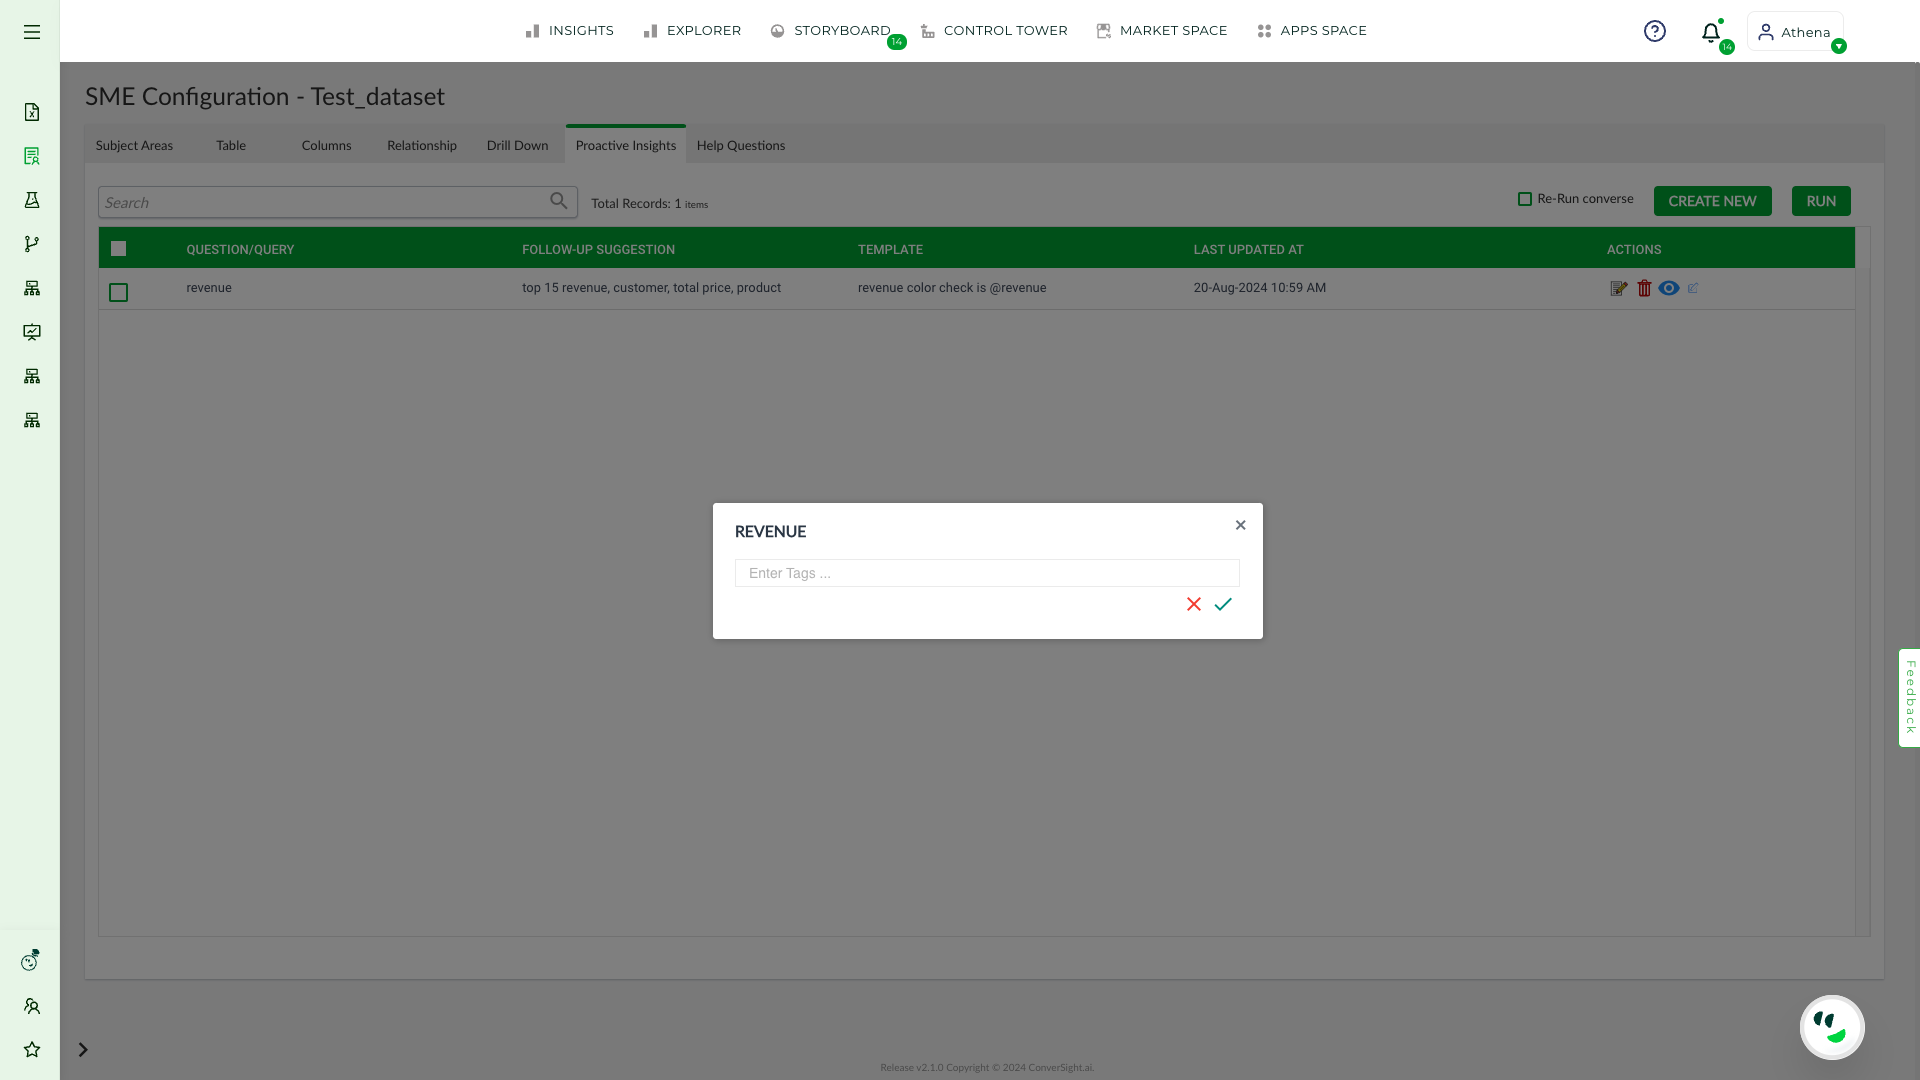
New Tag#
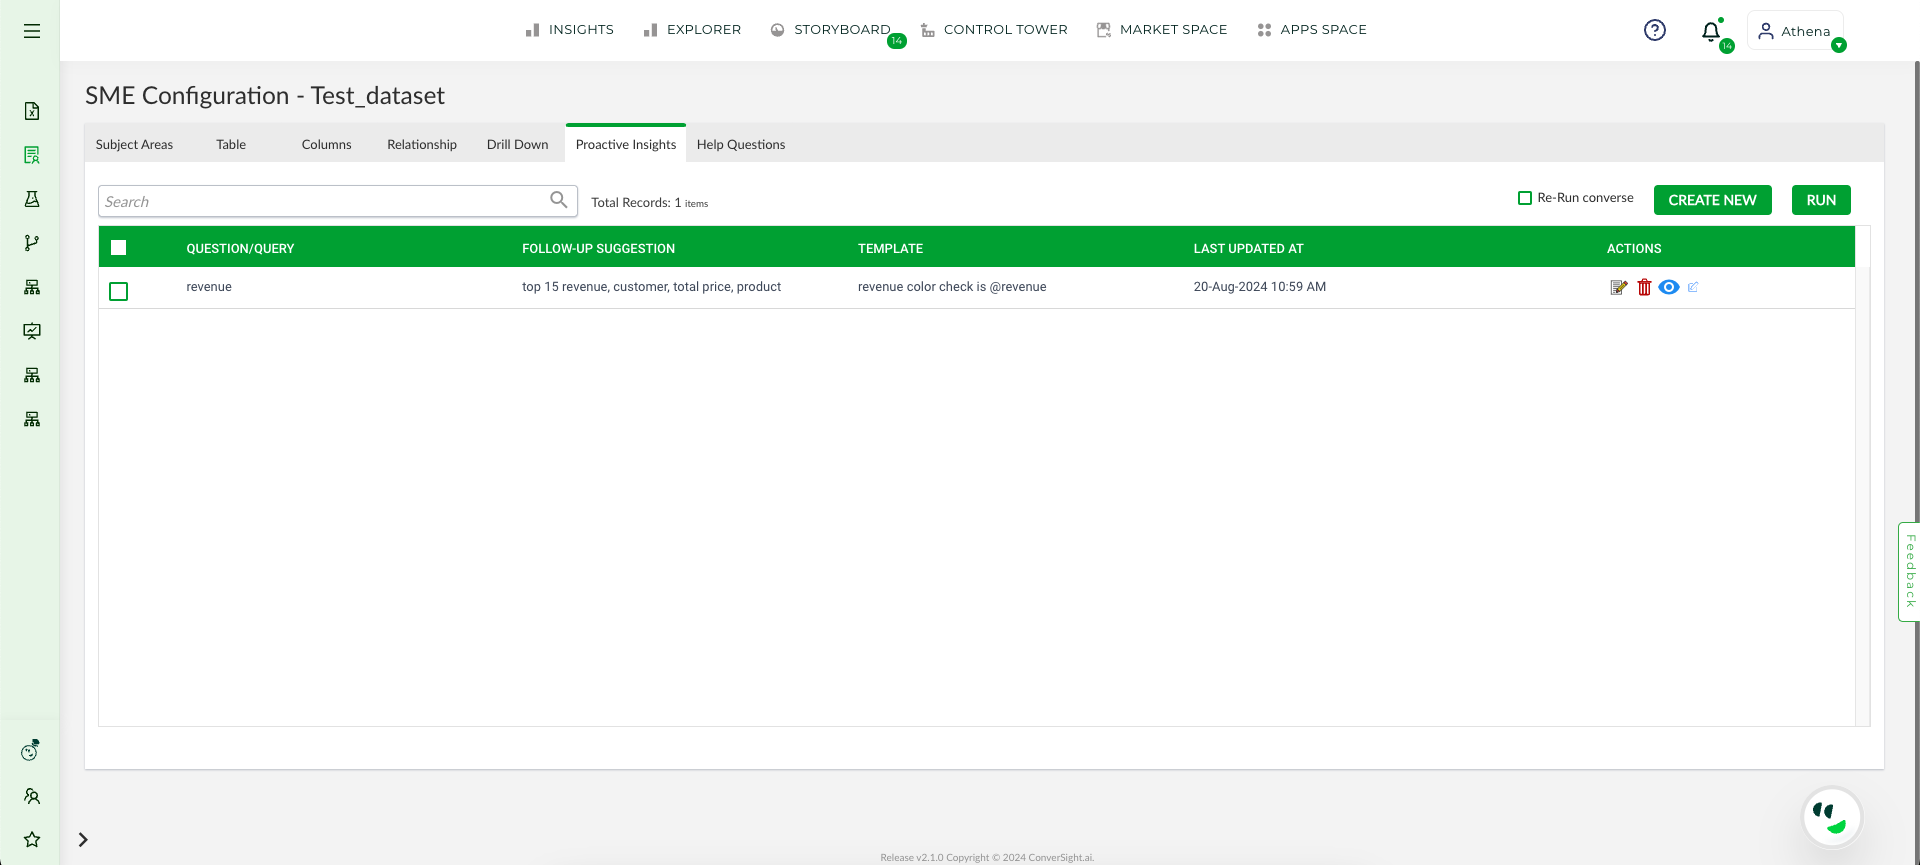
Run a Proactive Insight#
If you wish to run proactive insights from the current status, you can select the desired insight from the table and then click on Run. On the other hand, if you wish to re-run the insight from the first of its status, select the insight and check the box labelled Re-Run Converse and then click on the Run button.
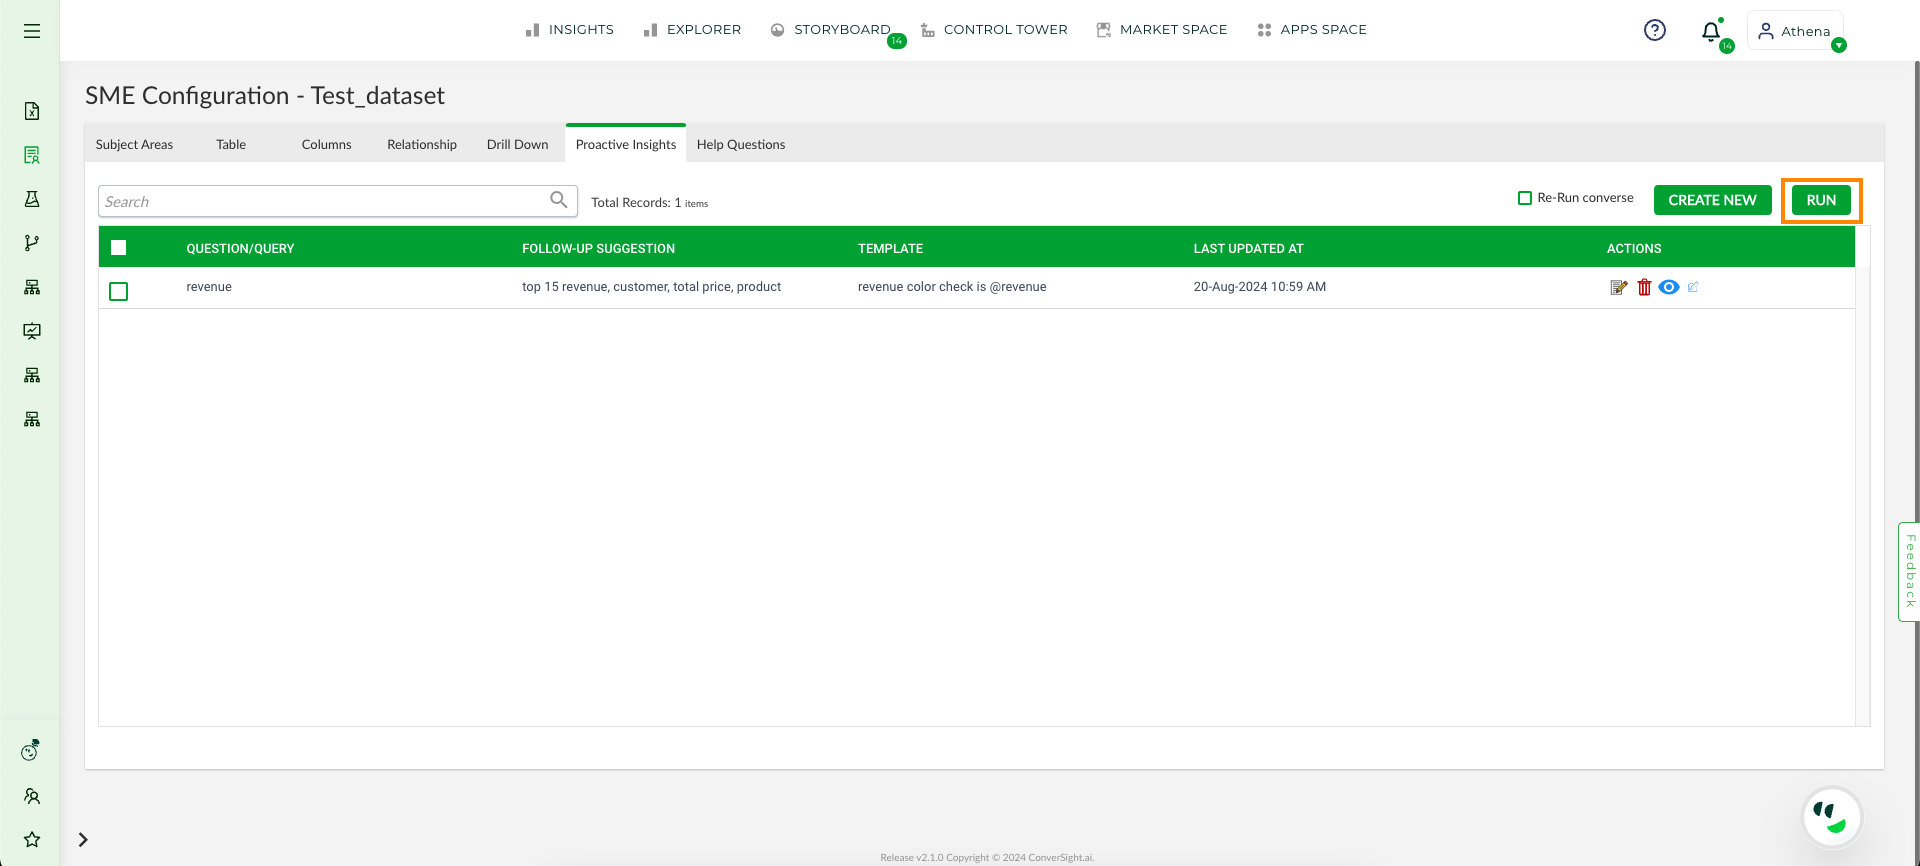
Run#
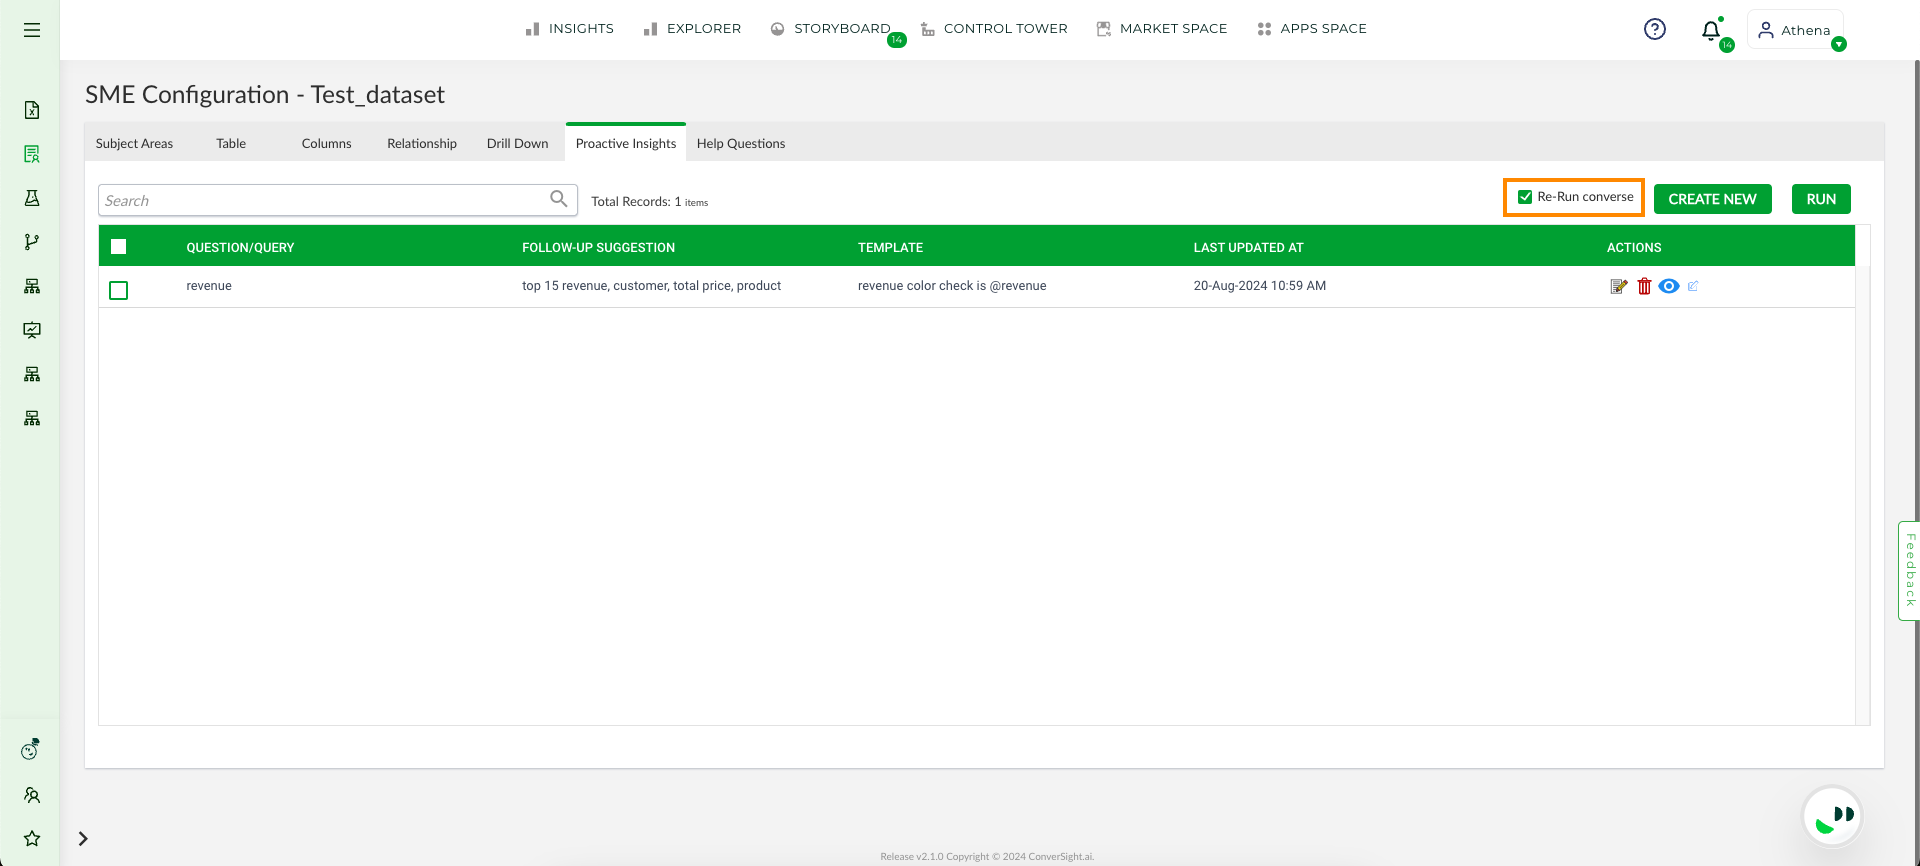
Re-Run Converse#
Edit an existing Insight#
To edit an existing insight, follow the steps outlined below. This process will allow you to refine and update your insights to ensure they accurately reflect the most current and relevant data.
Navigate to the Proactive Insights tab to view the list of insights you’ve previously created.
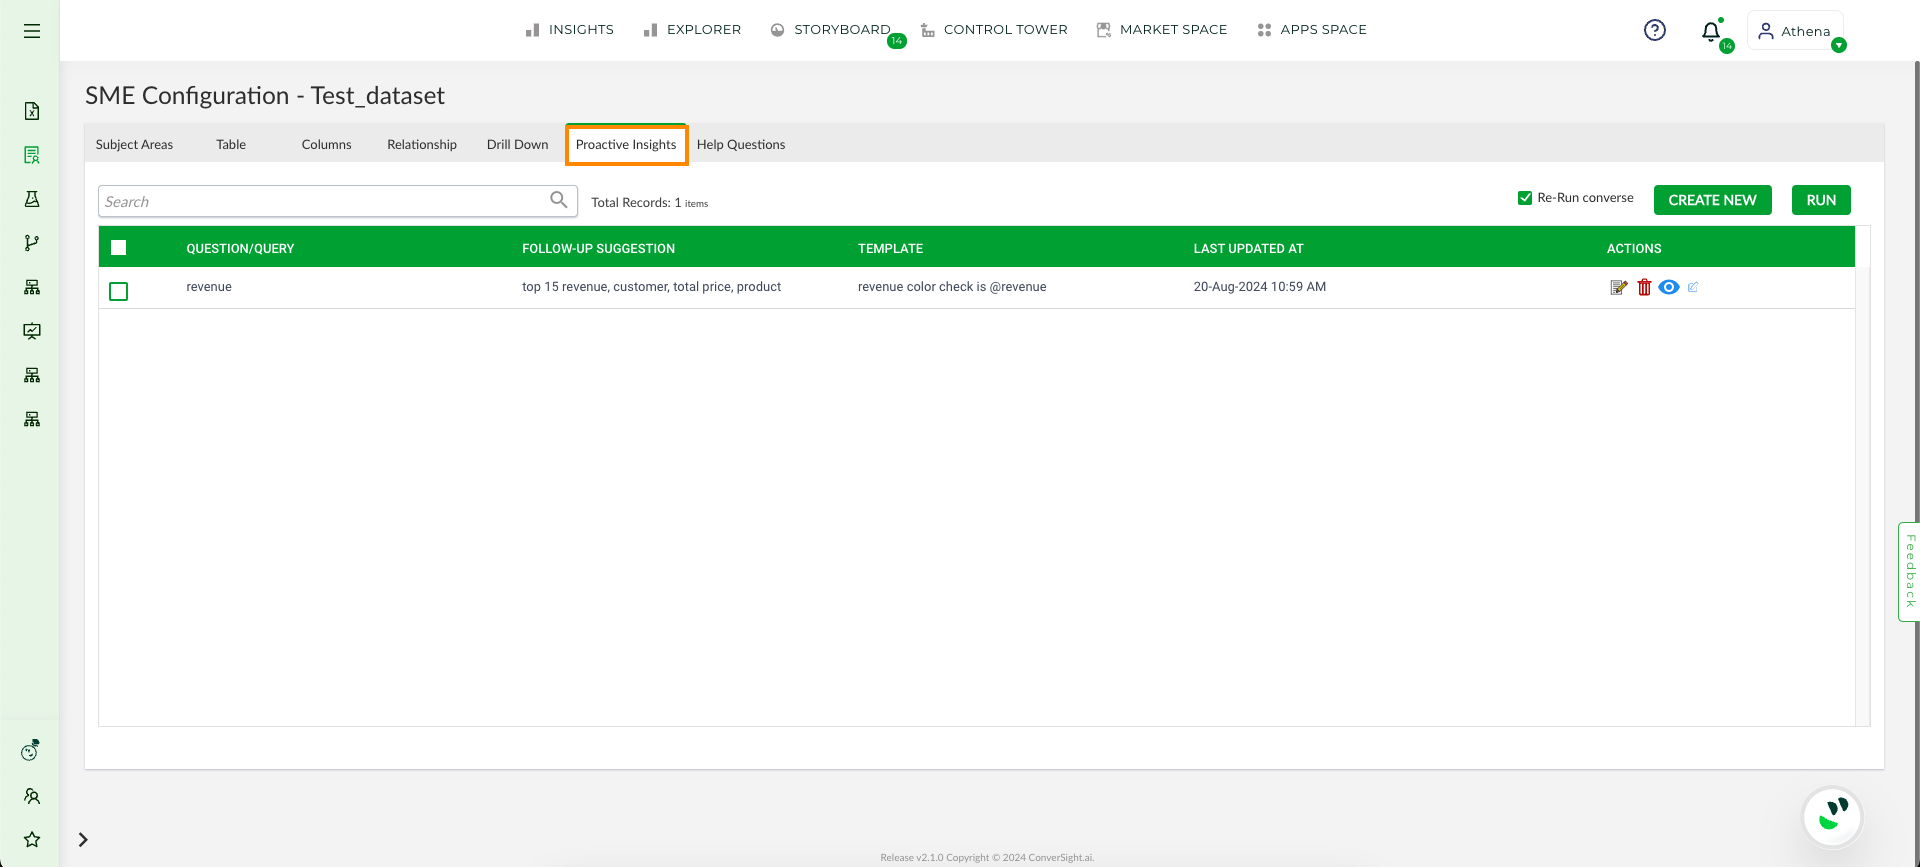
Proactive Insights#
Select the insight you wish to edit and click the Edit icon in the Action column.

Edit Icon#
Modify your insights as needed by reviewing and adjusting them according to your requirements.
Modifications#
Once you’ve made the necessary edits, click the Save button to finalize your changes.
Save Button#
After saving, select the checkbox of the Insight and click on the Run button.
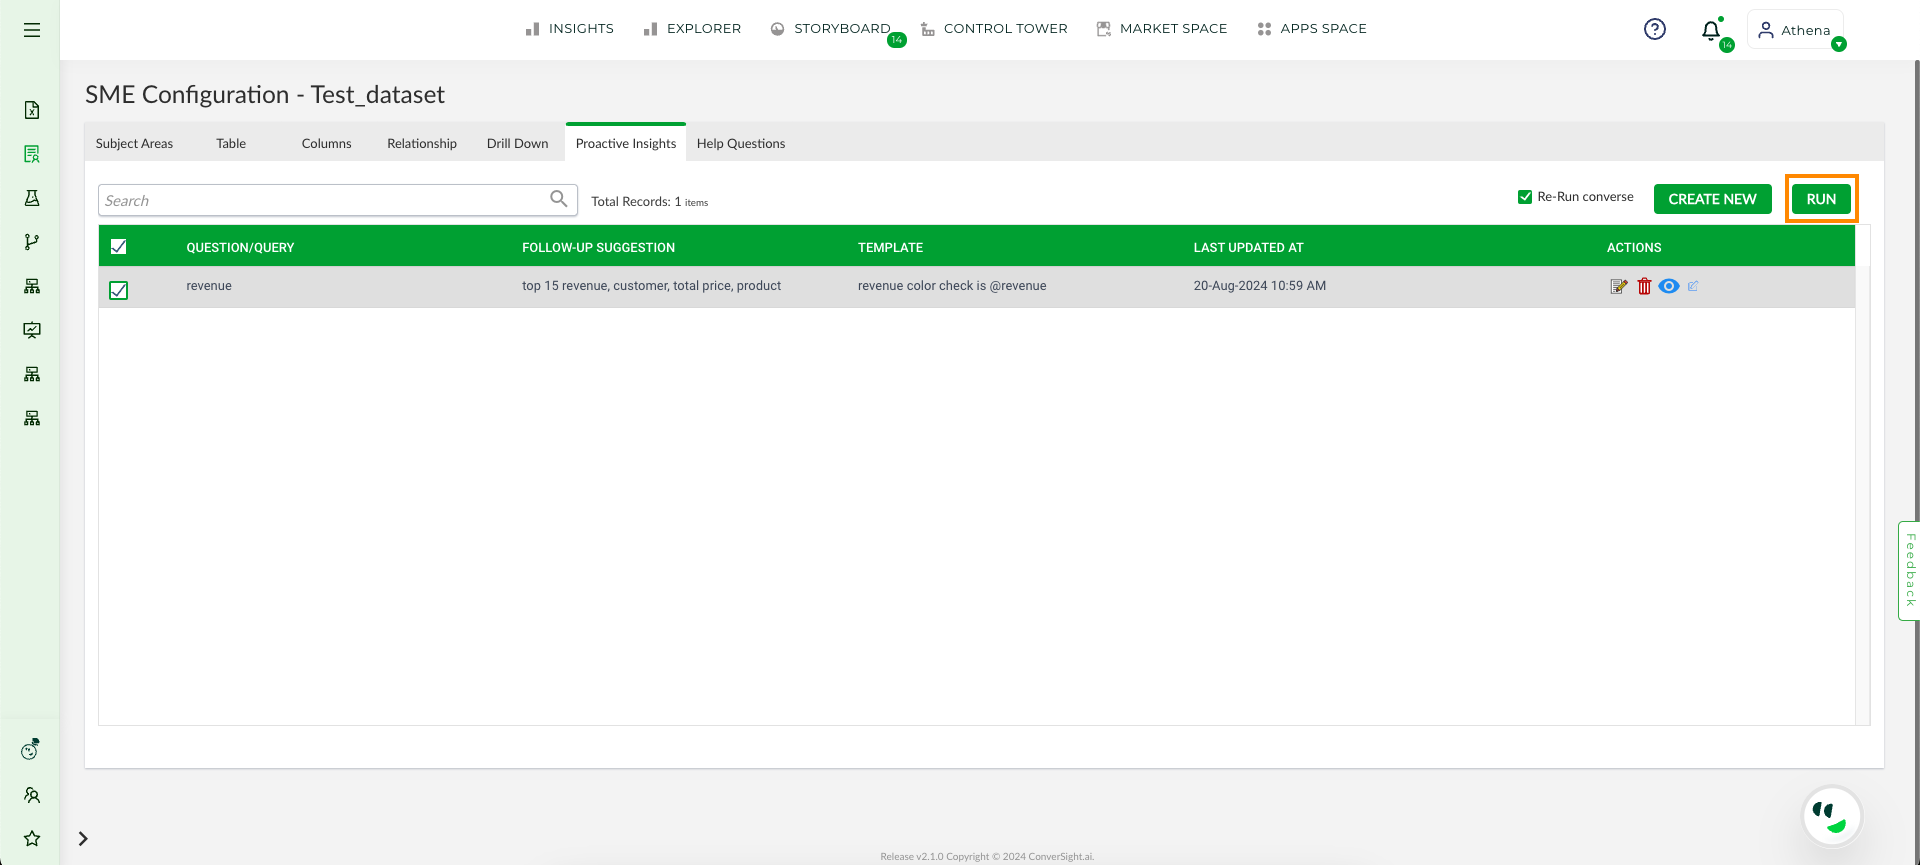
Run Button#
The updated insights will be reflected on the Insights page.
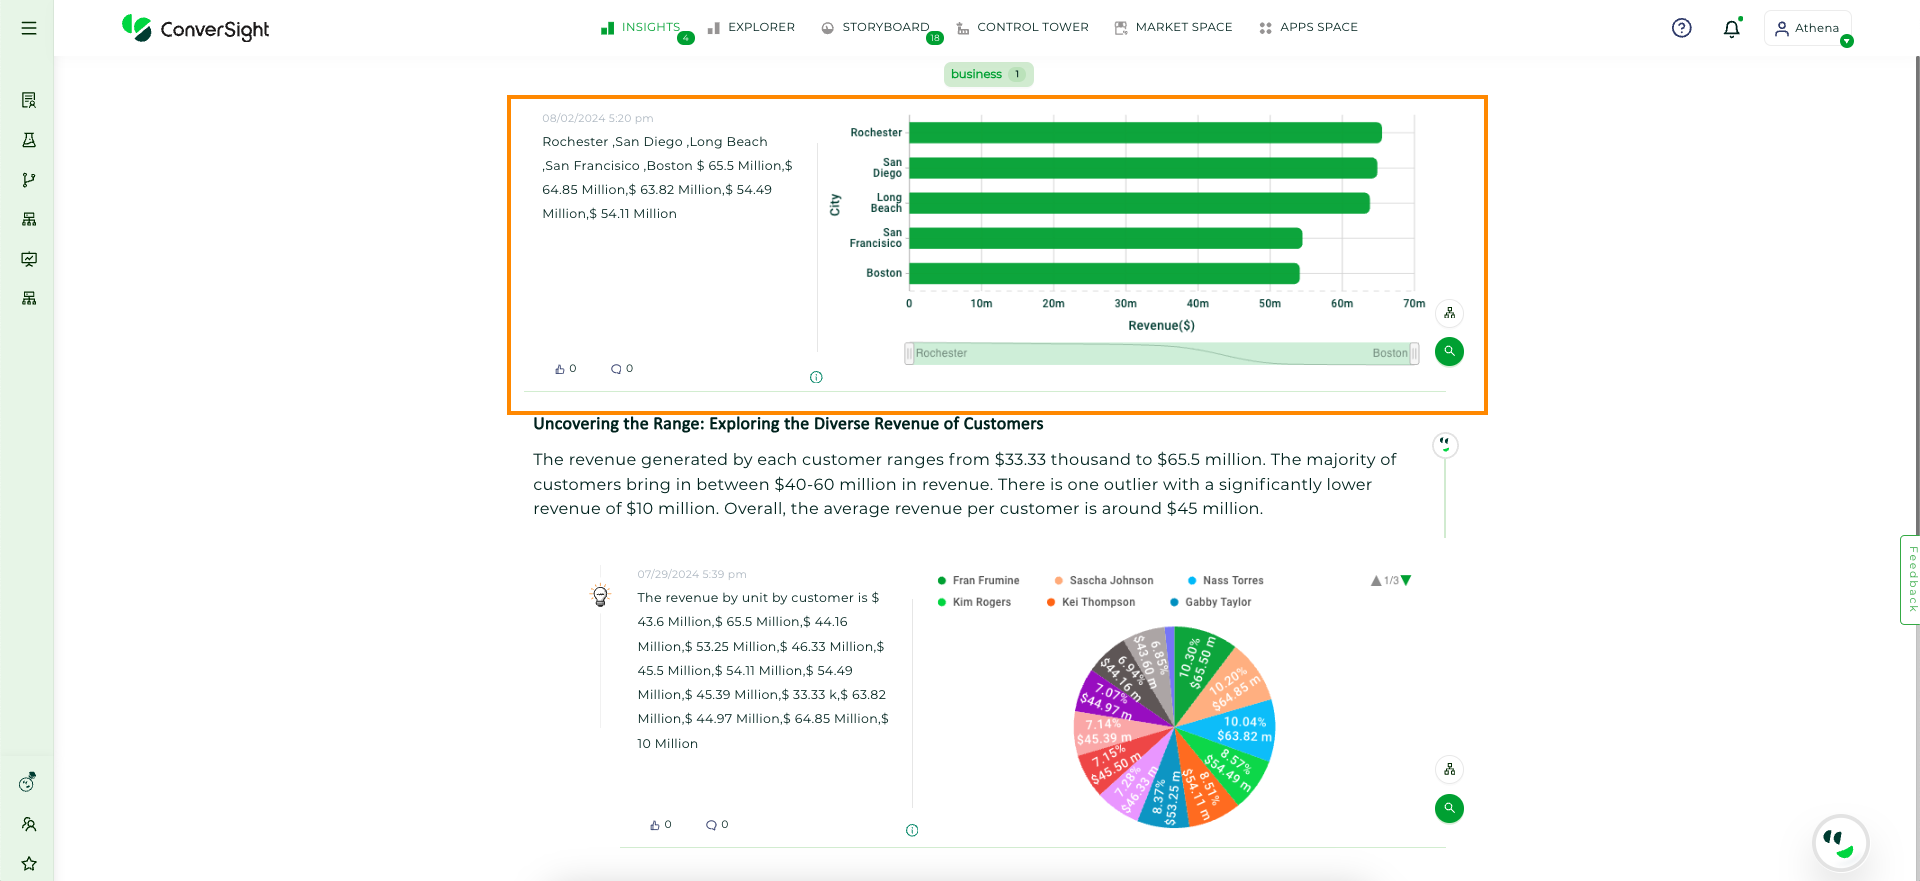
Previous Insight#
Updated Insight#
Help Questions#
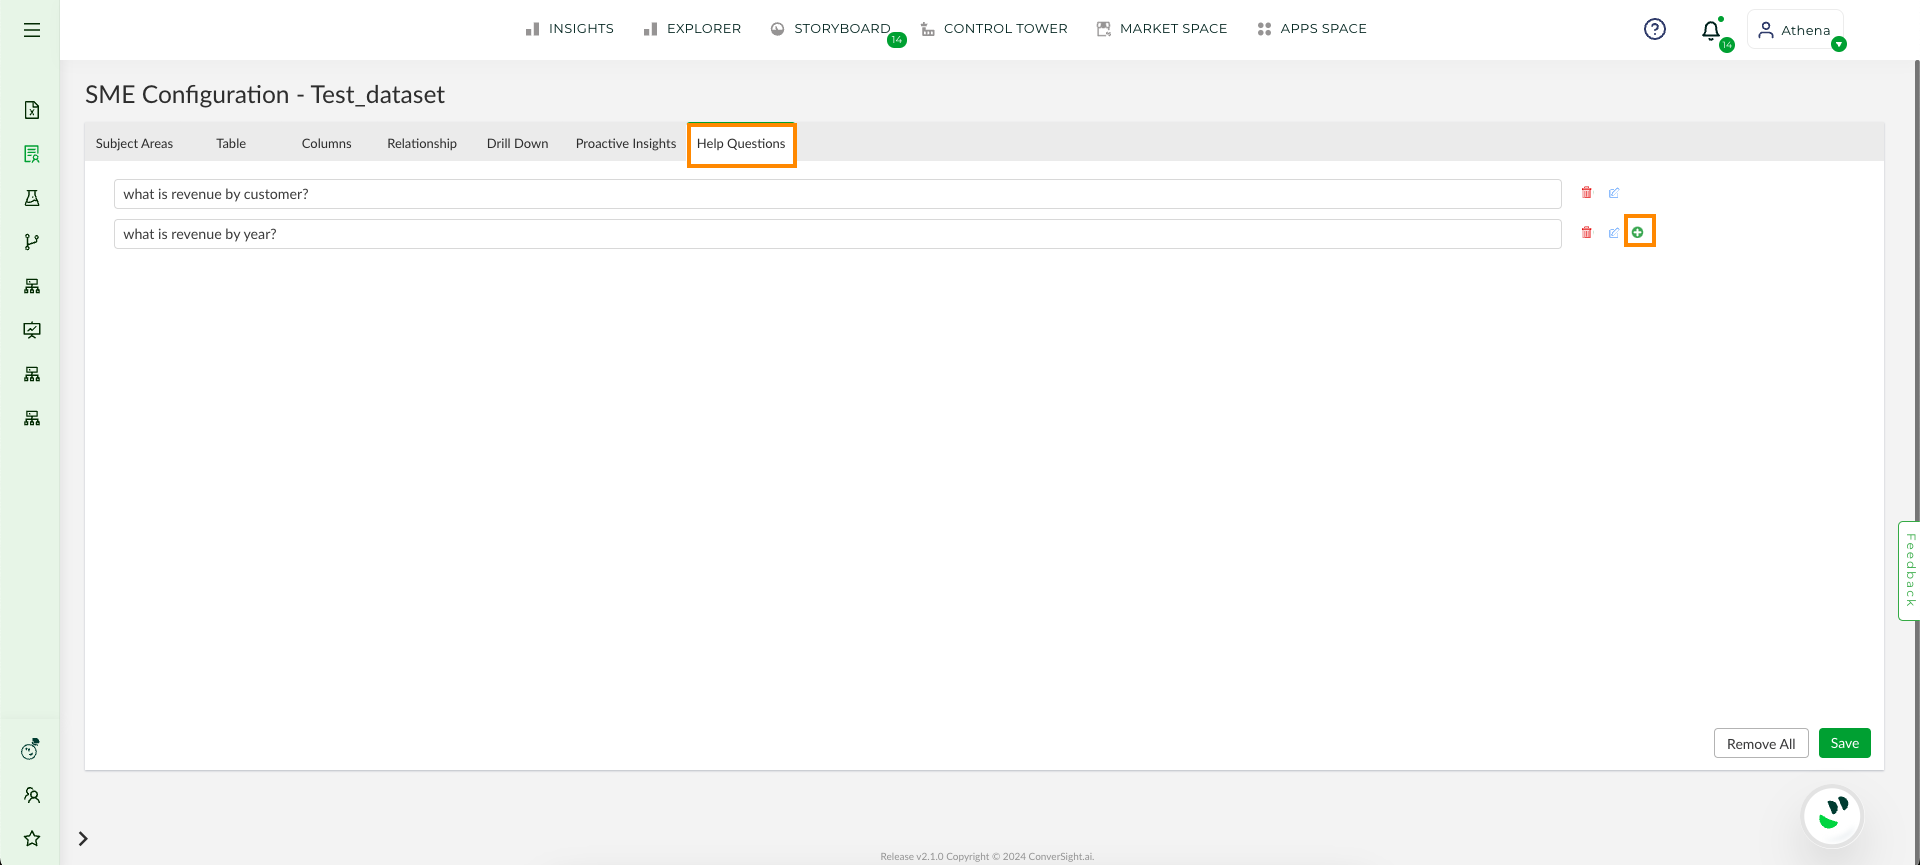
The Help Questions tab is designed to aid the user in understanding the different types of questions that can be asked to Athena. Additionally, the user has the ability to expand the list of questions by clicking on the plus icon and adding their own questions.
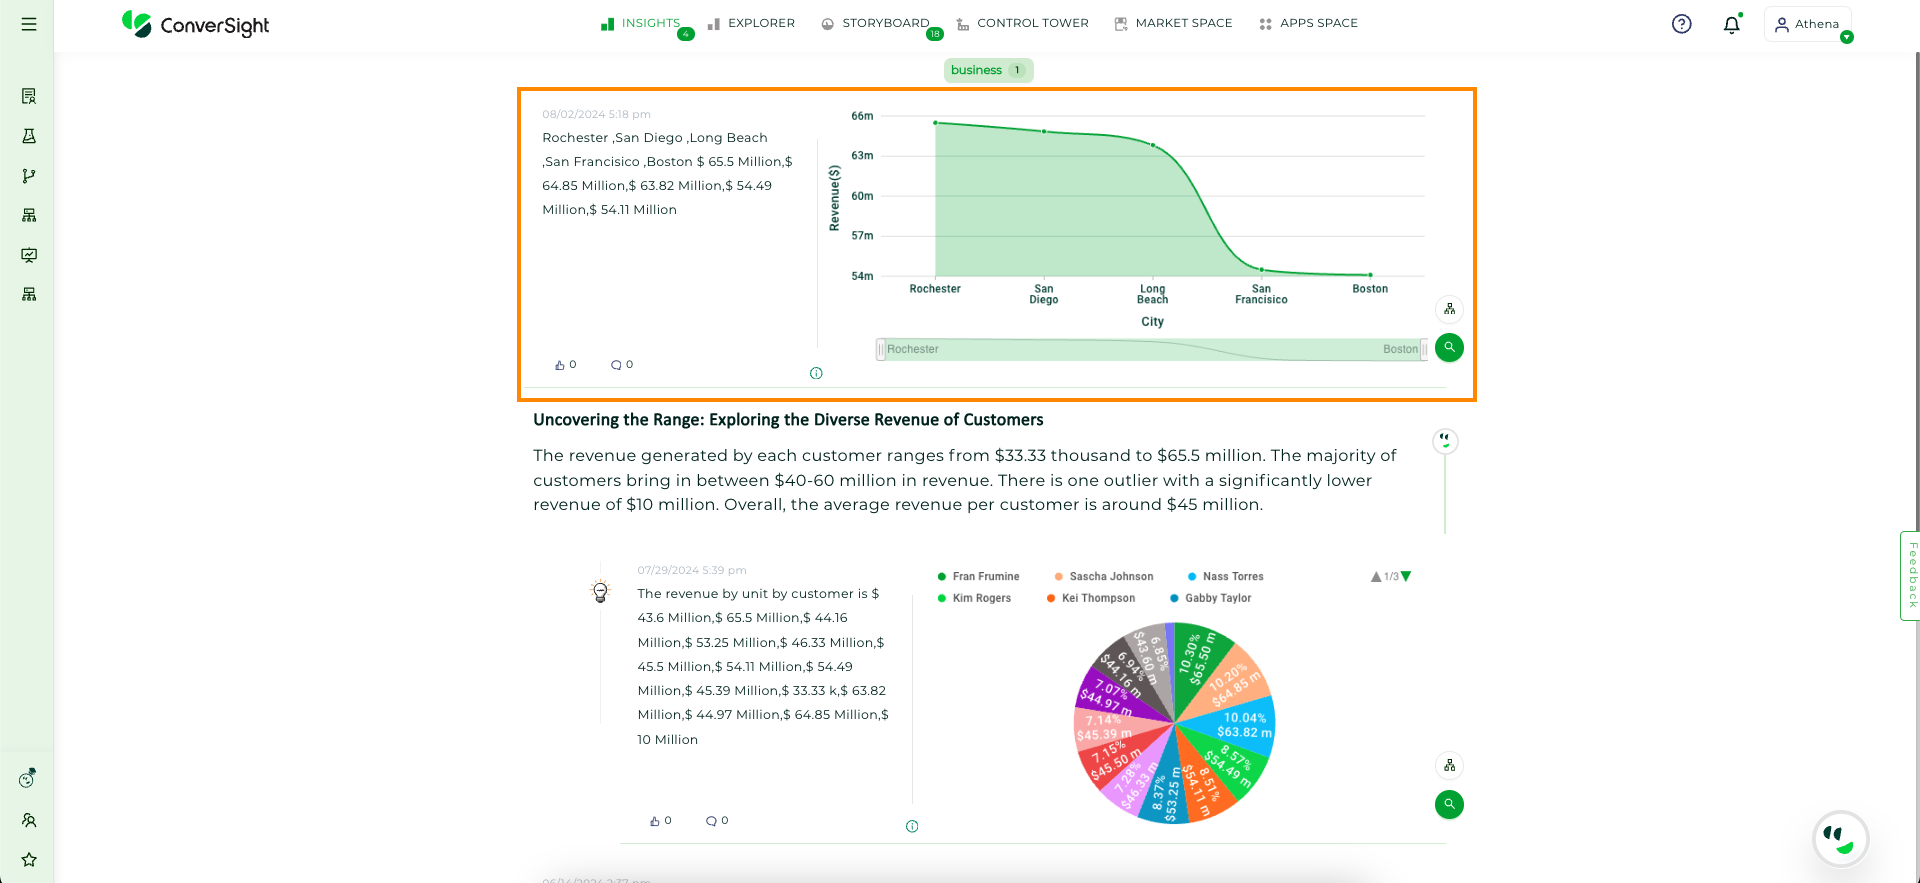
Help Question Tab#
In addition to adding their own questions, the user can also add Tags to their questions by selecting the Tag icon and assigning relevant tags. These tagged questions will then be displayed under the respective tags for better organization and clarity of which category the question belongs to.
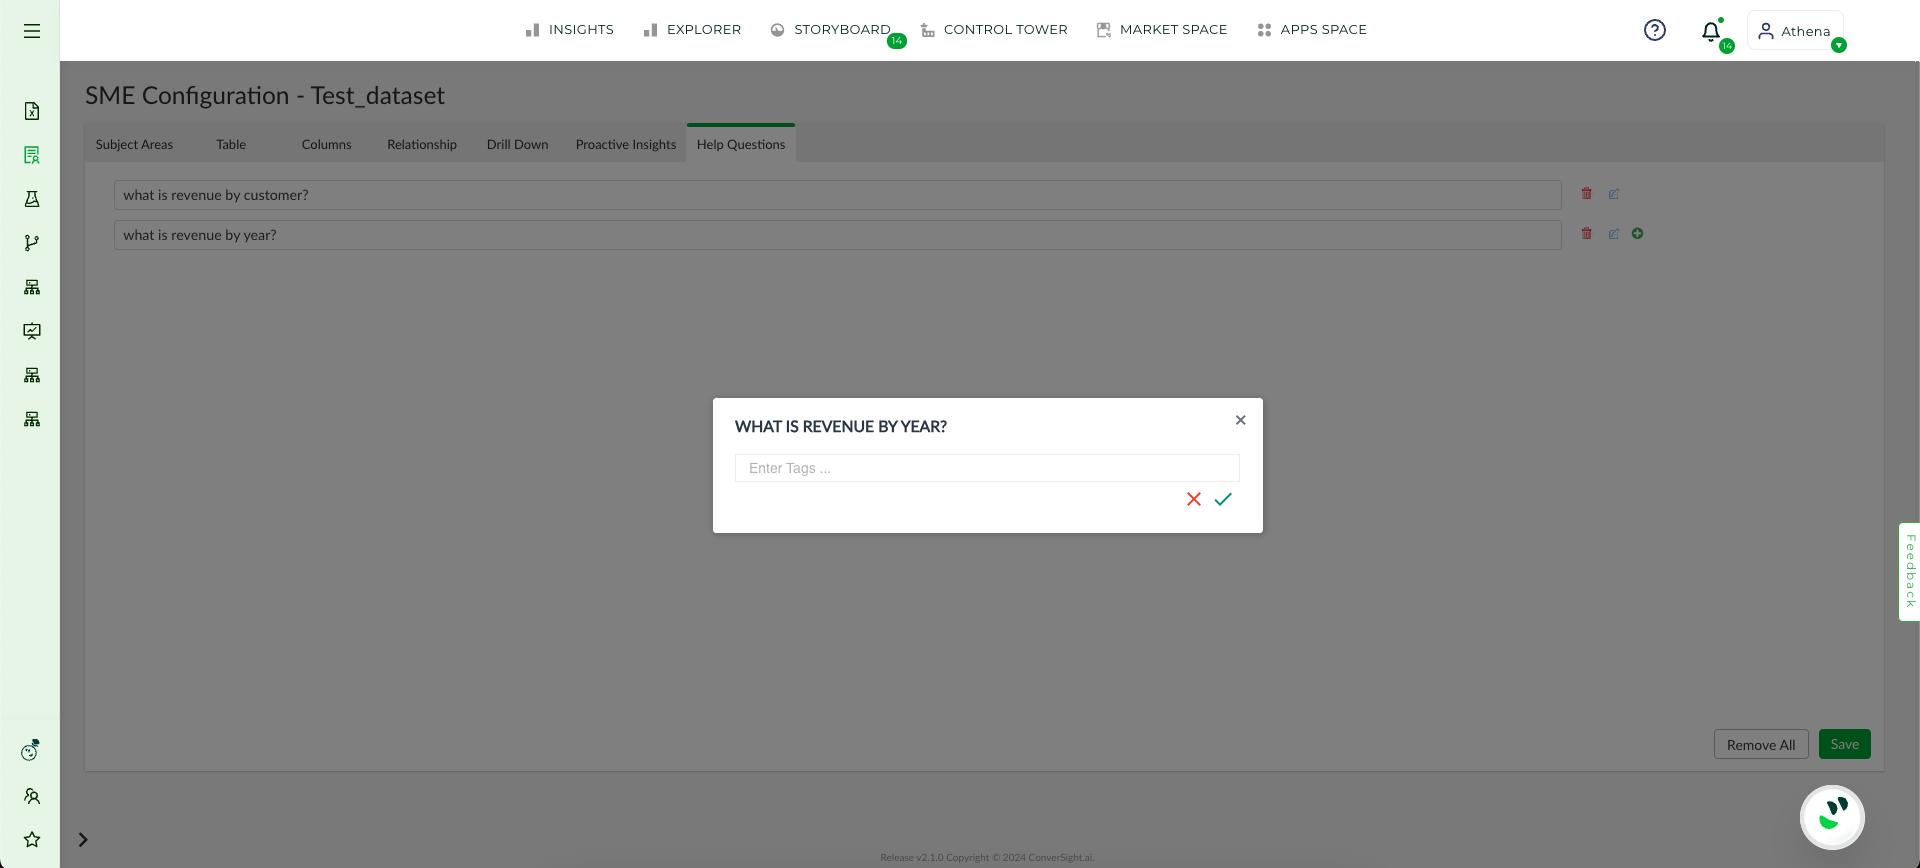
Tags#
If you wish to delete a specific question, you can do so by clicking on the trash icon associated with that question. Alternatively, if you wish to delete all questions, you can click on the Remove All button.

Remove All#
After adding a question or making any other changes, the user can save their modifications by selecting the Save button.
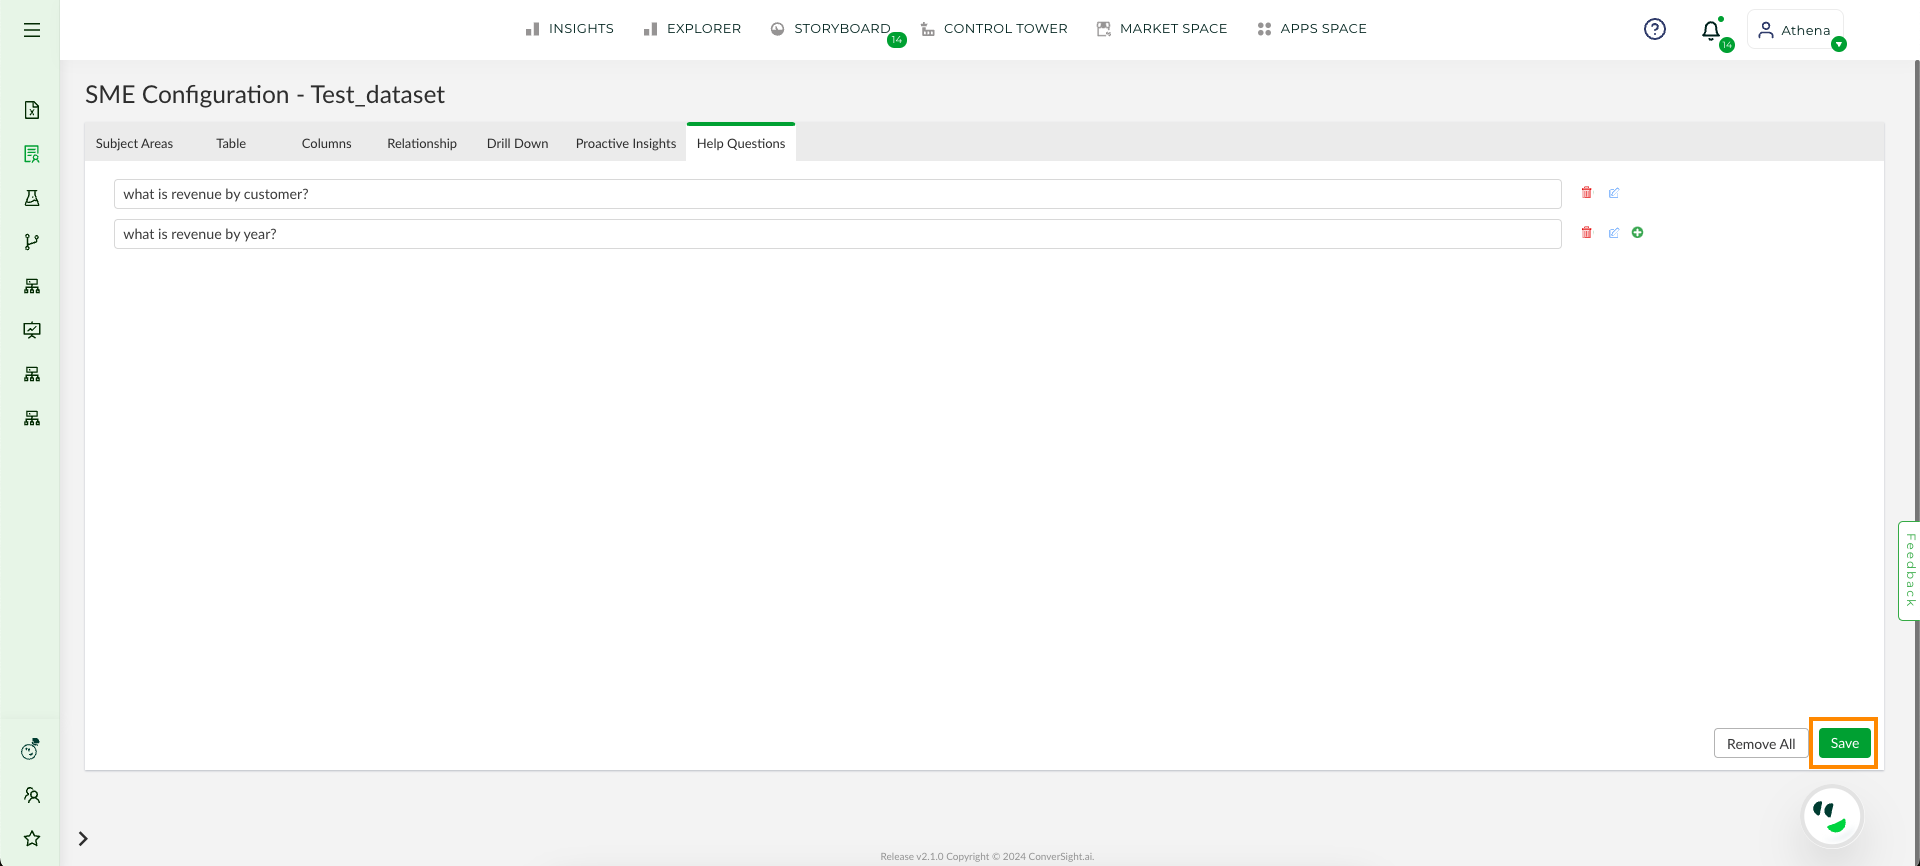
Save#
Relationship#
To establish the relationship between data tables, navigate to the Relationship tab. The tab consists of a scrollable list of tables and their columns on the left-hand side.
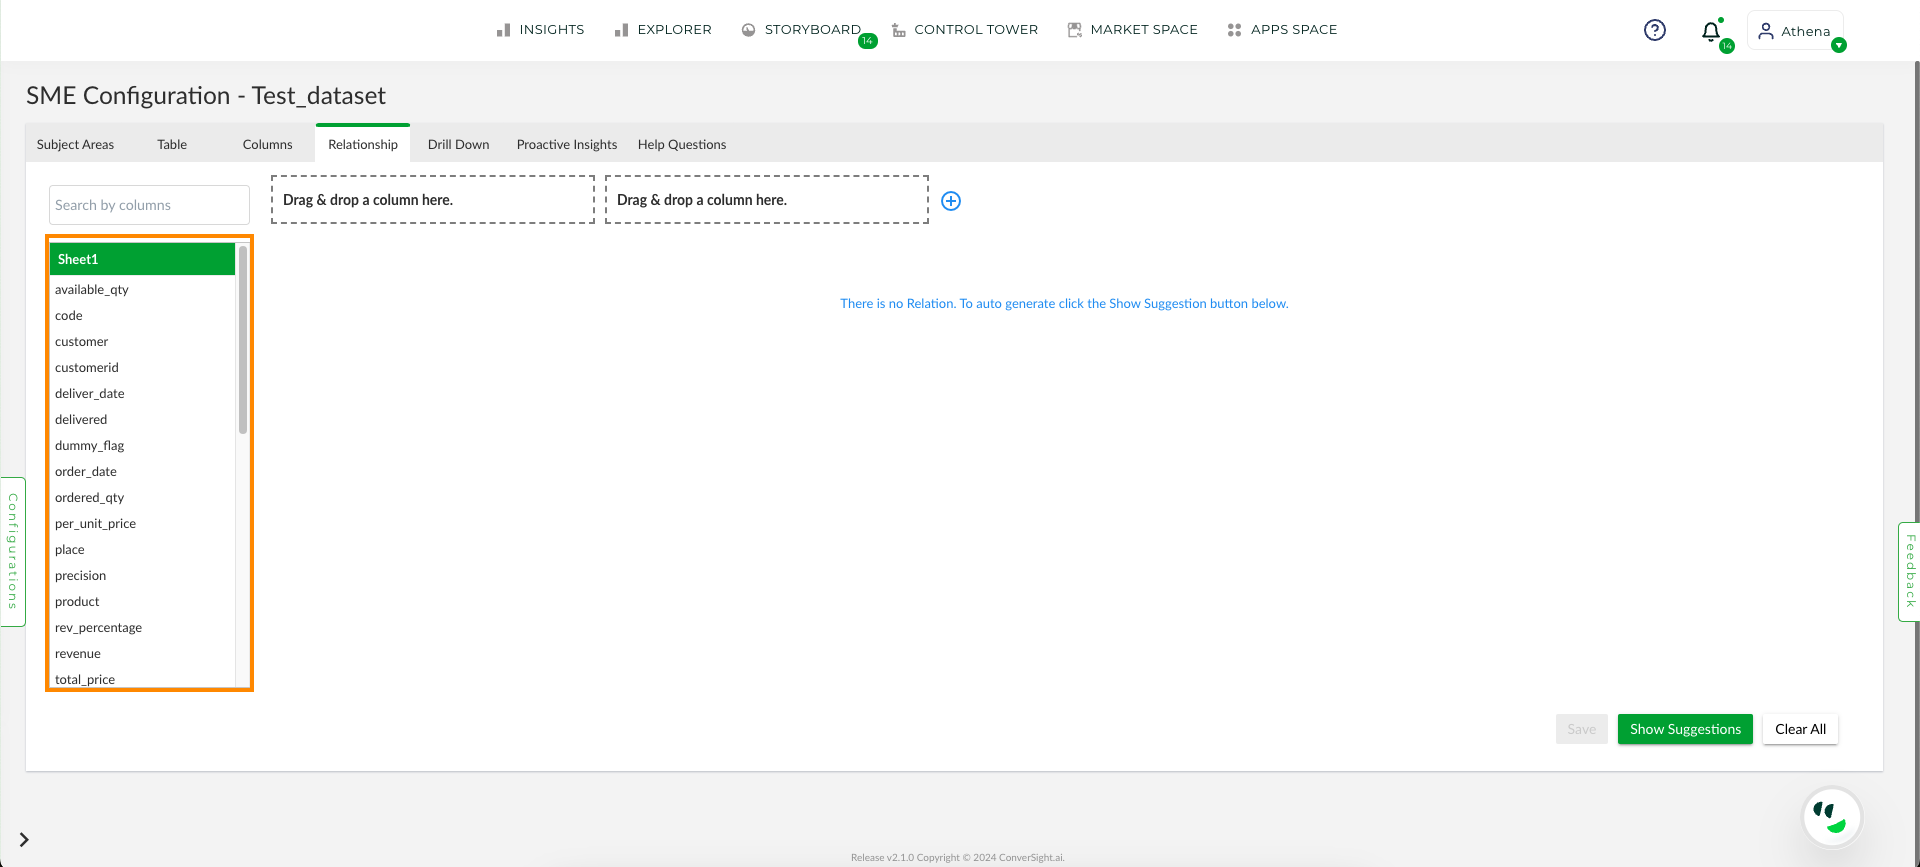
Relationship Tab#
To watch the video, click on Creating Relationships among tables.
NOTE
The utilization of metric and date columns for creating relationships is restricted.
There are two drag and drop areas for two columns, which can be used to form a relationship between tables.
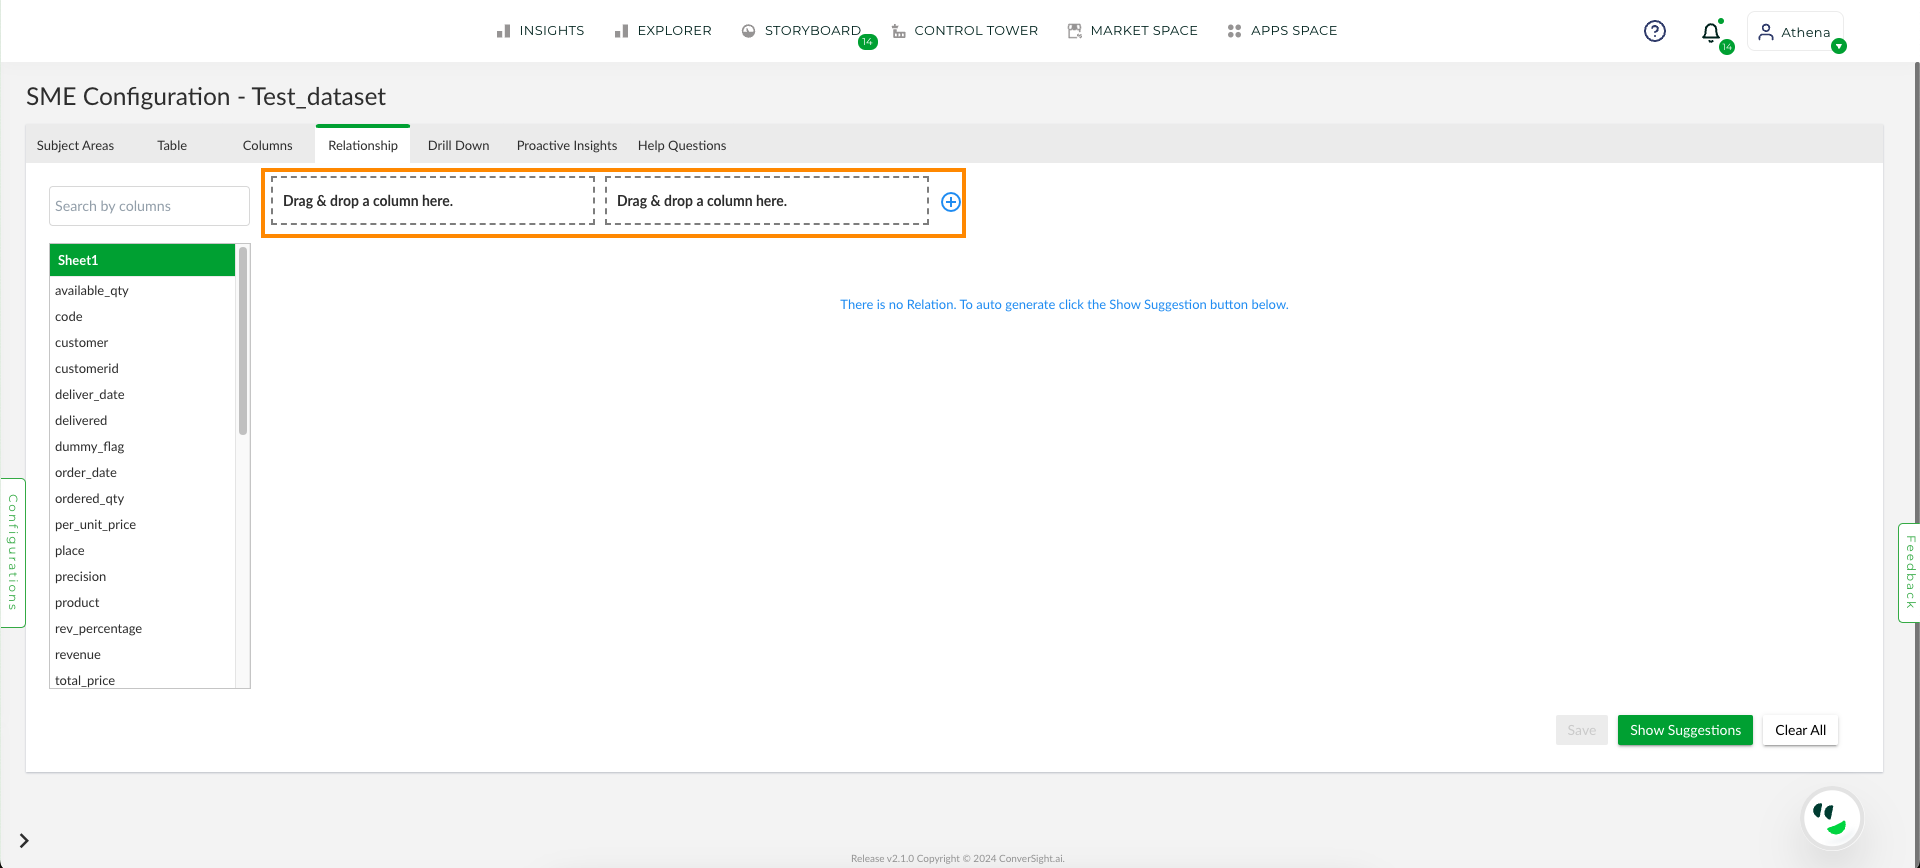
Drag and Drop#
NOTE
The creation of Relationships between columns within the same table is restricted.
In addition to dragging and dropping tables to form a relationship, the user can also select which join operation should be performed on the common columns between the two tables and the default join is inner join. This operation allows for more flexibility and control over the relationship being created.
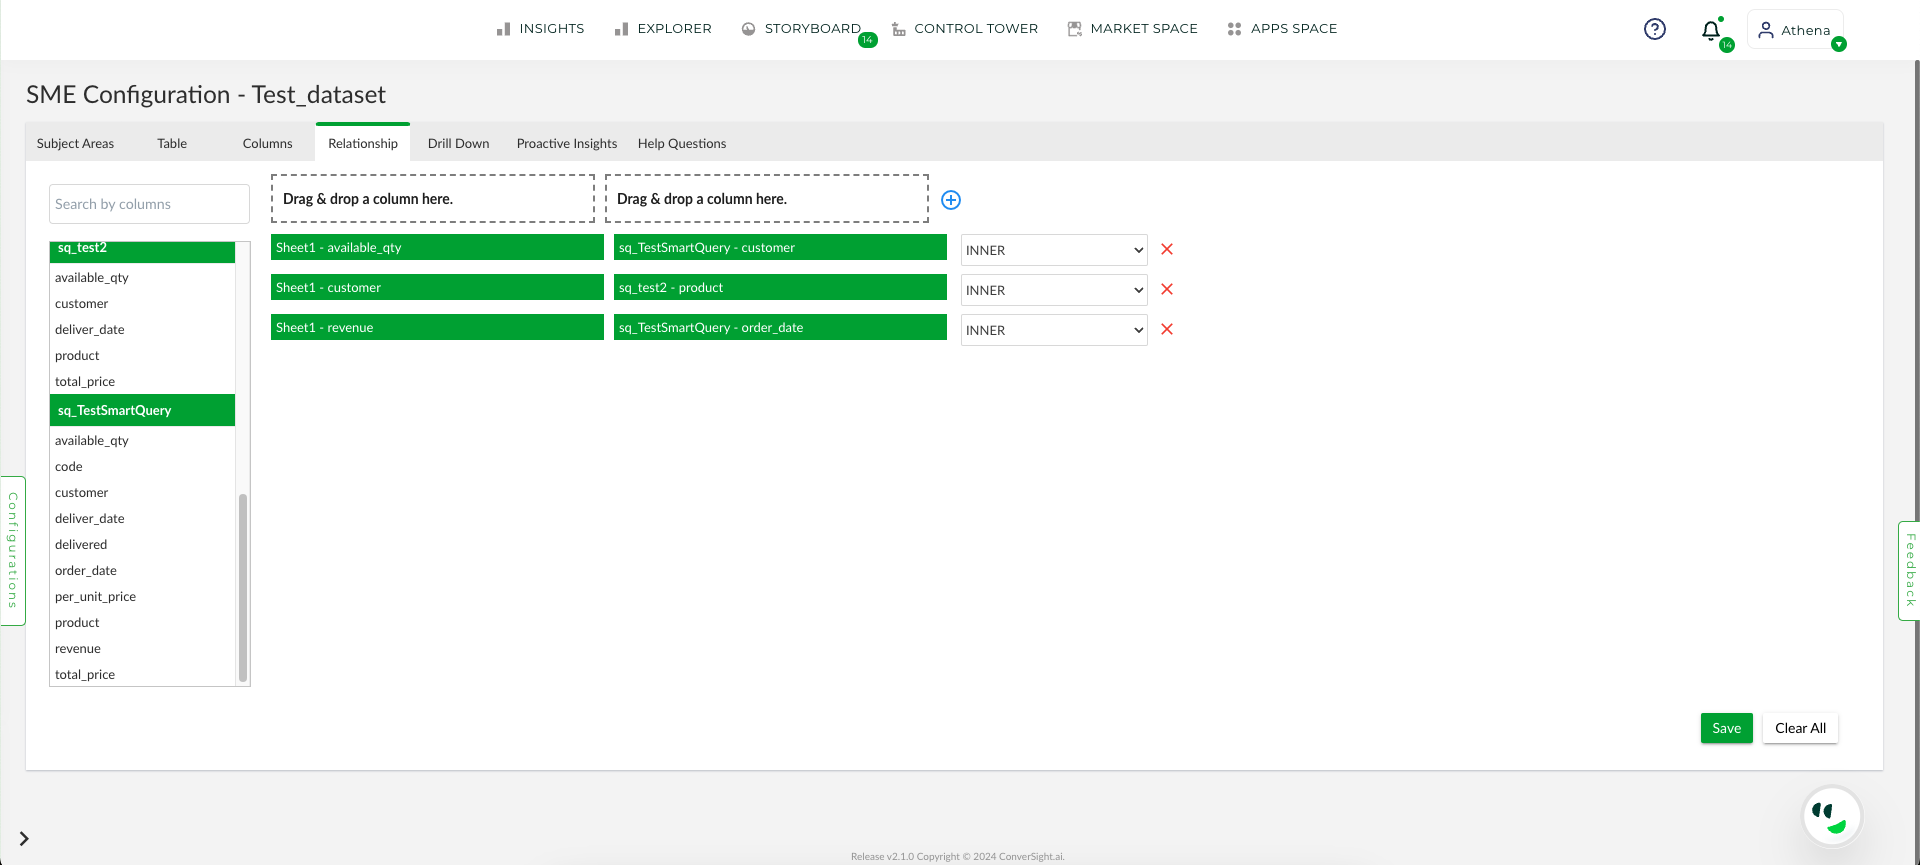
Drag and Drop#
NOTE
Circular joins are prohibited due to the potential for infinite iterations during querying.
Additionally, there is a Show Suggestions option that recommends columns that have something in common.
Show Suggestion Button#
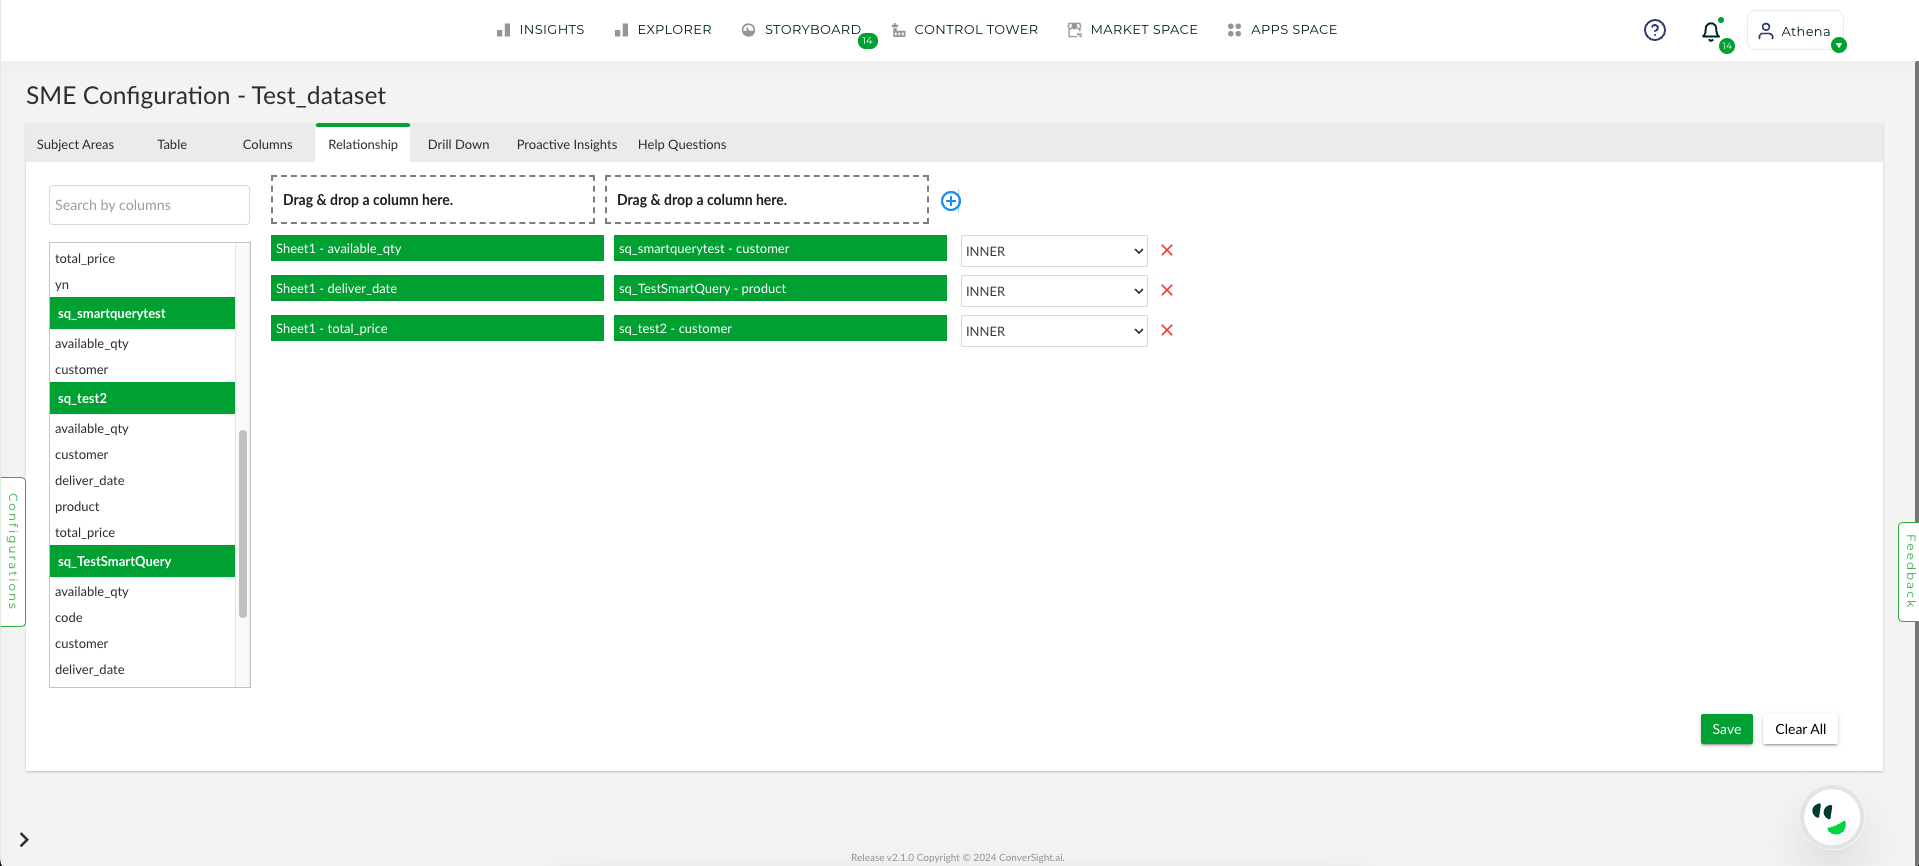
Show Suggestion#
If needed, the user can clear all relationships that have been attempted by selecting the Clear All option.
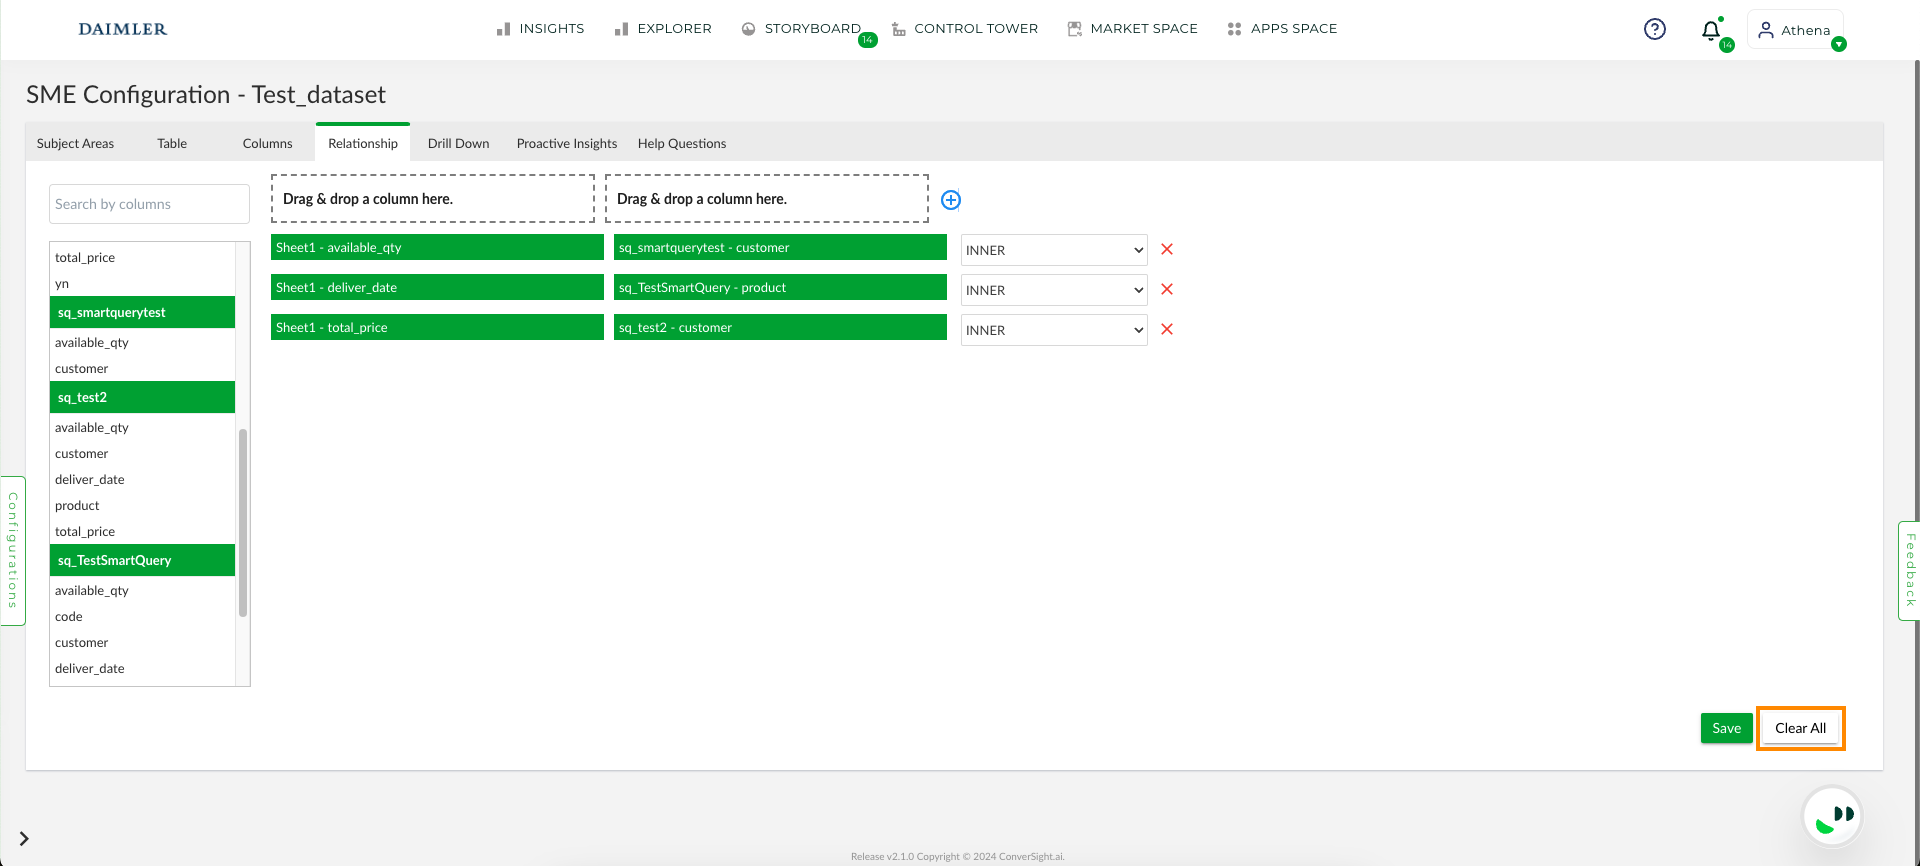
Clear All#
User can save the change, just by clicking the Save button.
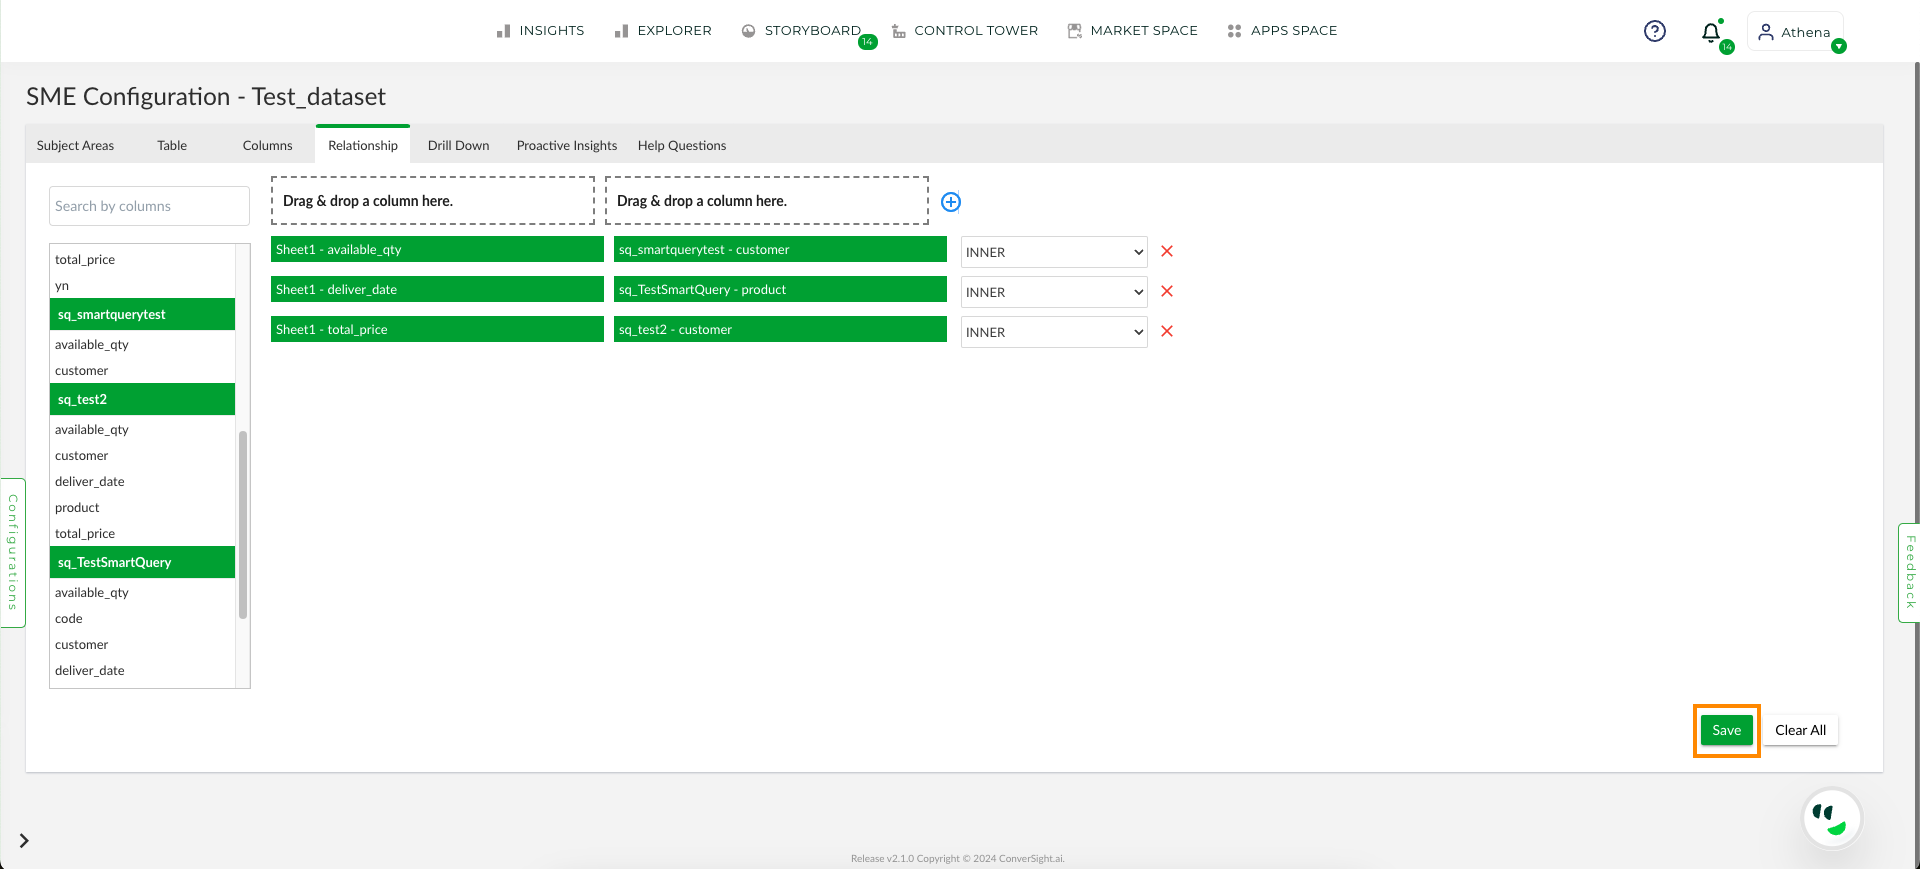
Save#
The Relationship tab is a crucial feature that empowers Athena to map and retrieve data with utmost efficiency, based on the closest relationships established between different tables. In this process, Athena assigns scores to the relationship formed between tables, with a higher score indicating a closer relationship and a lower score indicating a weaker one. Ultimately, Athena displays results based on the highest scores generated by relationships between columns.
Monitor the status in the Activity Status column in the Data Workbench under Data Management. Once the status changes from Configure SME to Active, your SME configuration is complete and ready for use.
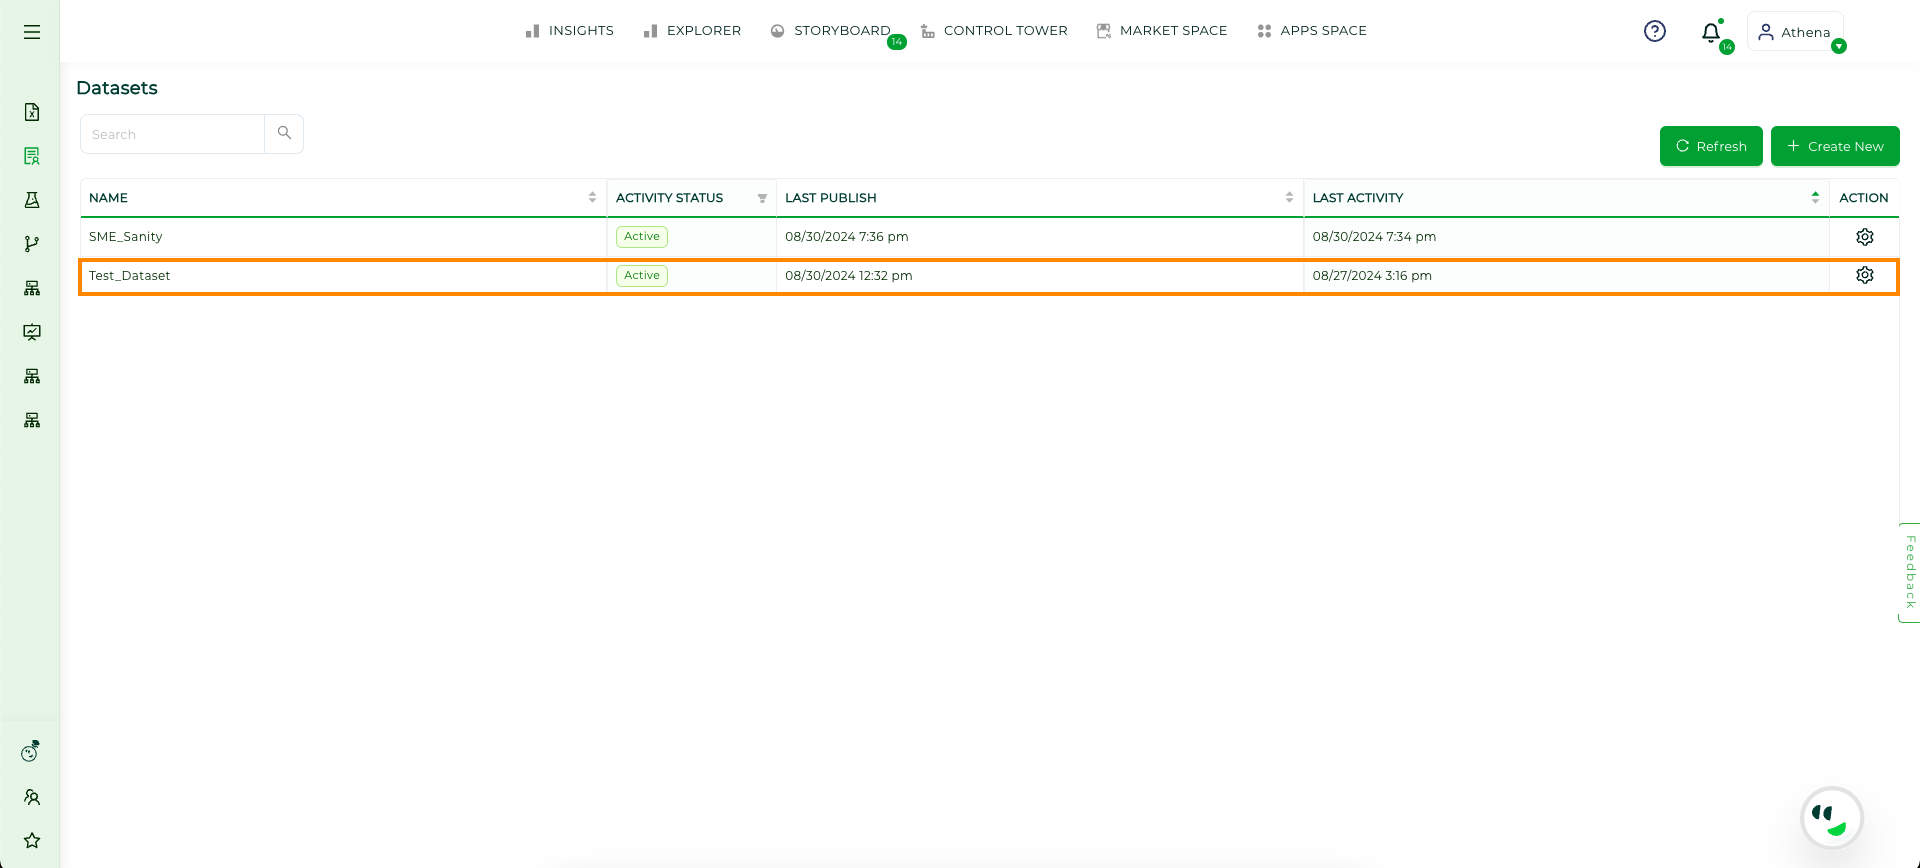
Activity Status#