Storyboard Customization#
Customizing a storyboard allows you to tailor the presentation of your data to better suit your needs. By rearranging insights, changing chart types and applying filters, you can create a more organized and relevant view that highlights key information and improves decision-making. This flexibility ensures that your storyboards are not only visually appealing but also aligned with your specific analytical goals and business context.
Arrange Insights#
To organize the insights within the storyboard, Click and Drag each insight to your desired position. This allows you to customize the layout to better suit your needs.
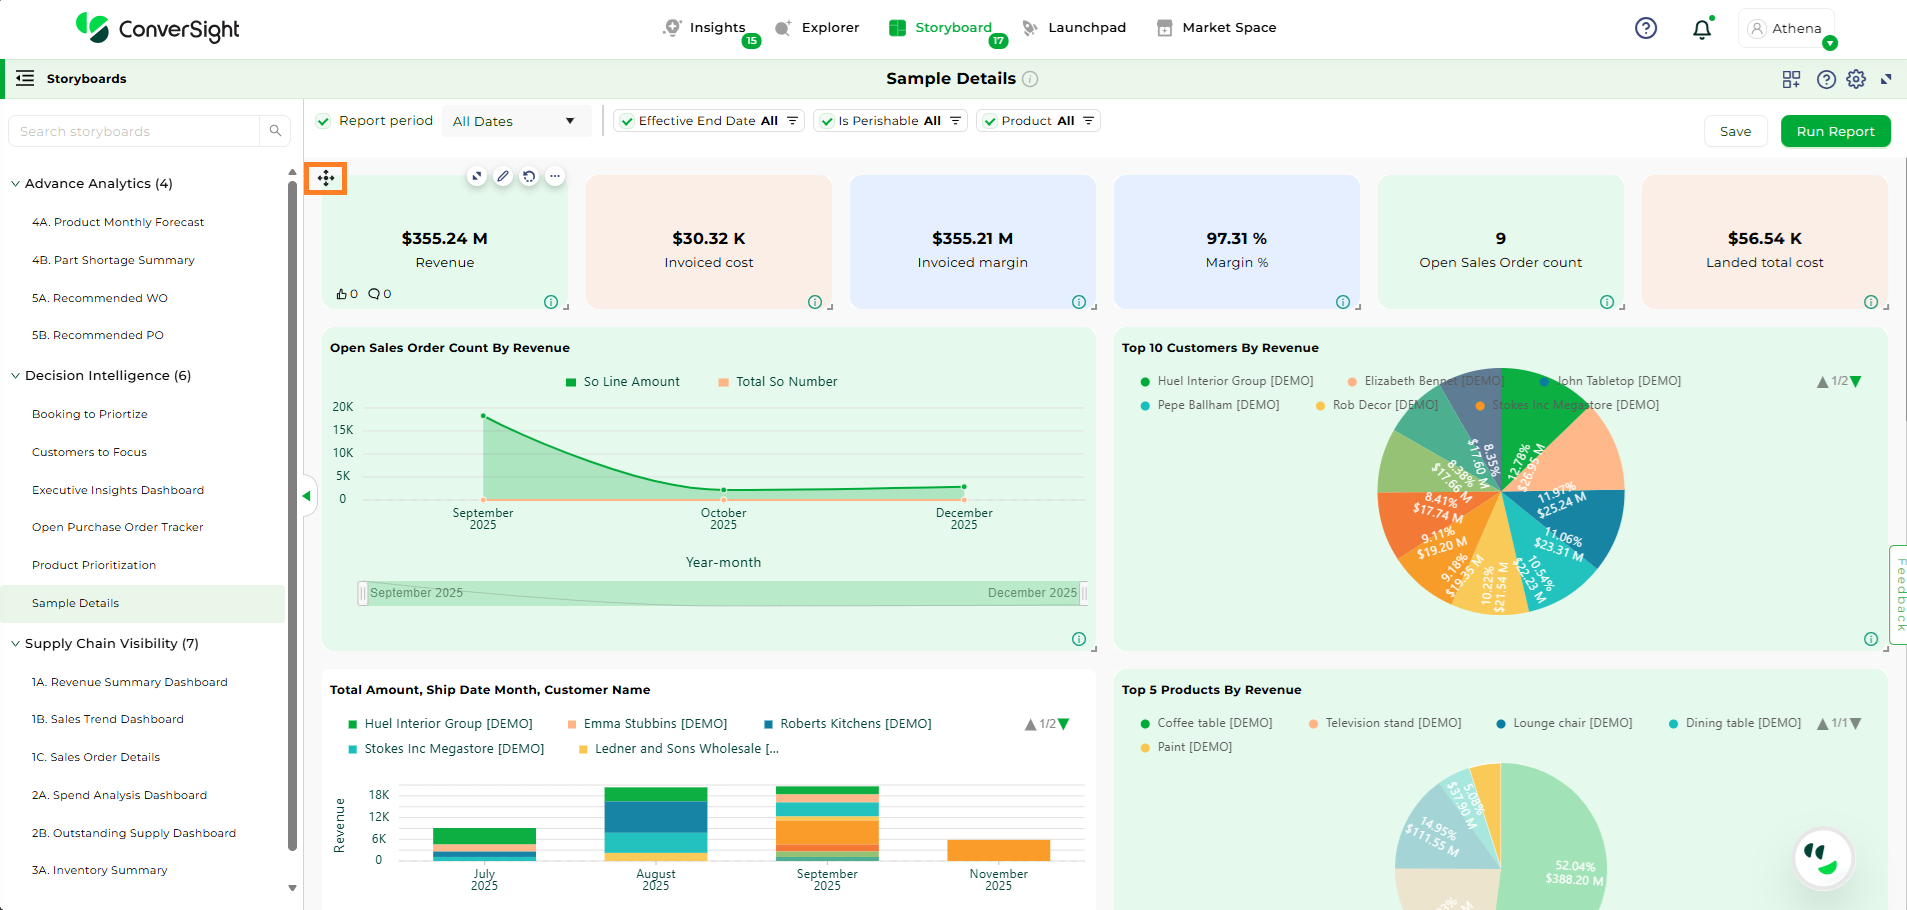
Arranging Insights#
You can also resize the insights by using the Resize icon, making them larger or smaller as required.
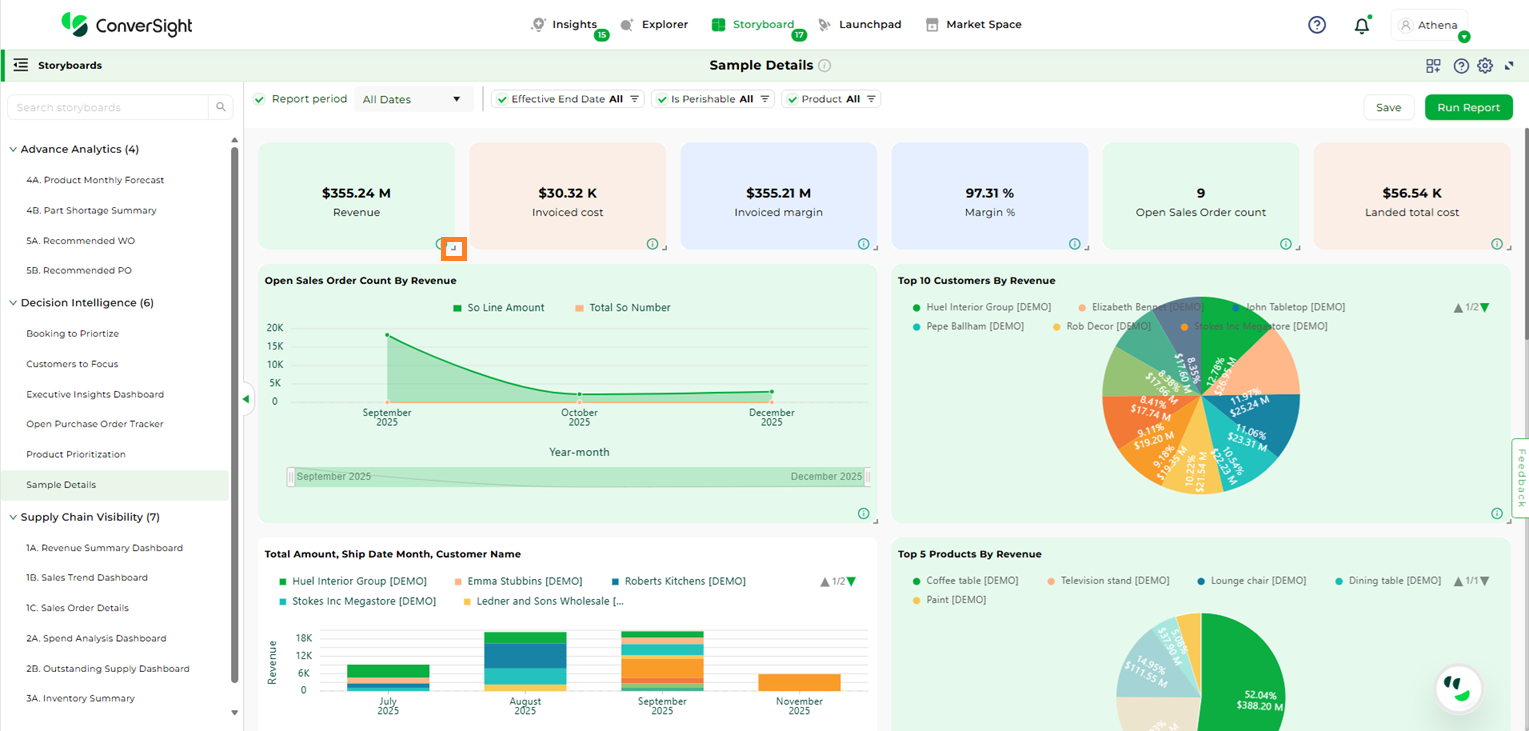
Resizing Insights#
Change Chart Types#
To change the type of chart used for any insight, click on the Expand icon. This action will display all available chart types, allowing you to choose and apply the one that best suits your needs.
Expand#
Browse through the options, select the chart type that best represents your data and click the Save icon to apply your changes.
Save Changes#
Applied Filters#
Applied Filters allow users to view and understand the filters currently applied to a storyboard, providing clarity on how the data is refined. These filters operate at the storyboard component level, ensuring consistent filtering across all tables and charts and helping users focus on key insights without applying filters to each component individually. Clicking the Applied Filter icon opens the filter panel, which displays all filters applied to the selected storyboard component, giving a clear view of the data being presented.
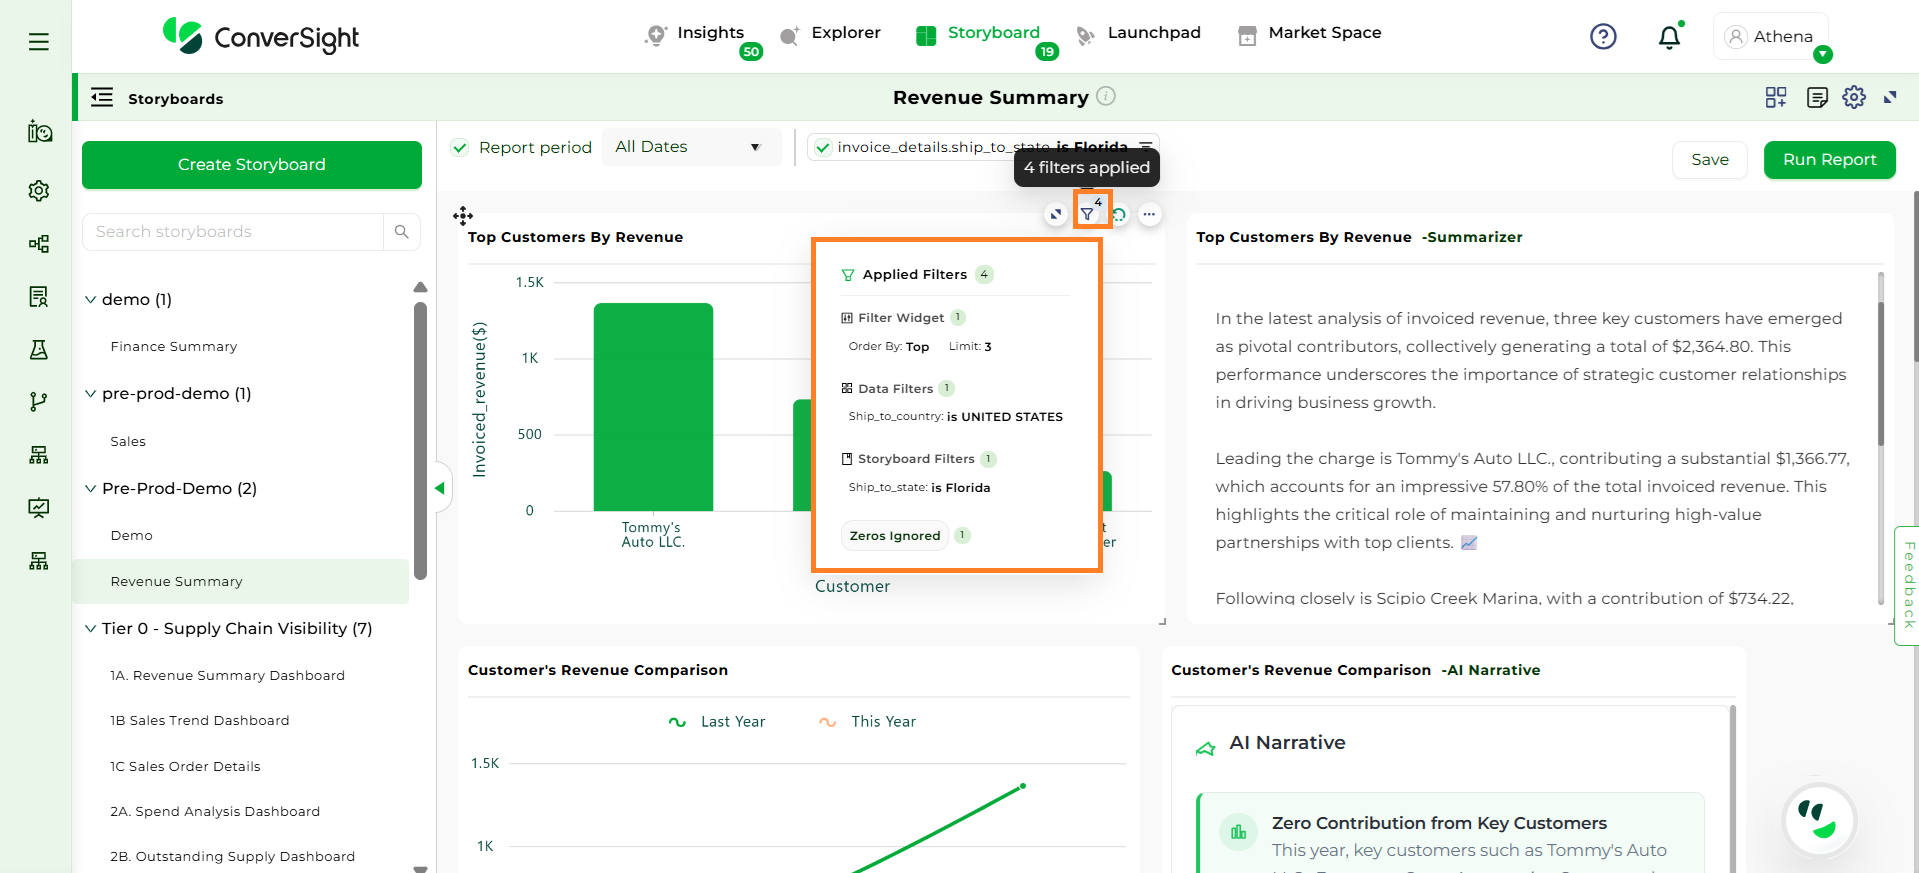
Applied Filters#
Refreshing Insights#
Clicking the Refresh icon on any insight to regenerate it with the latest available data, ensuring real-time accuracy.
Refreshing Insights#
Information#
The Information icon provides contextual information about the data being displayed. Hovering over the icon show details—such as the last data refresh time—so users can quickly understand the status and relevance of the information shown.
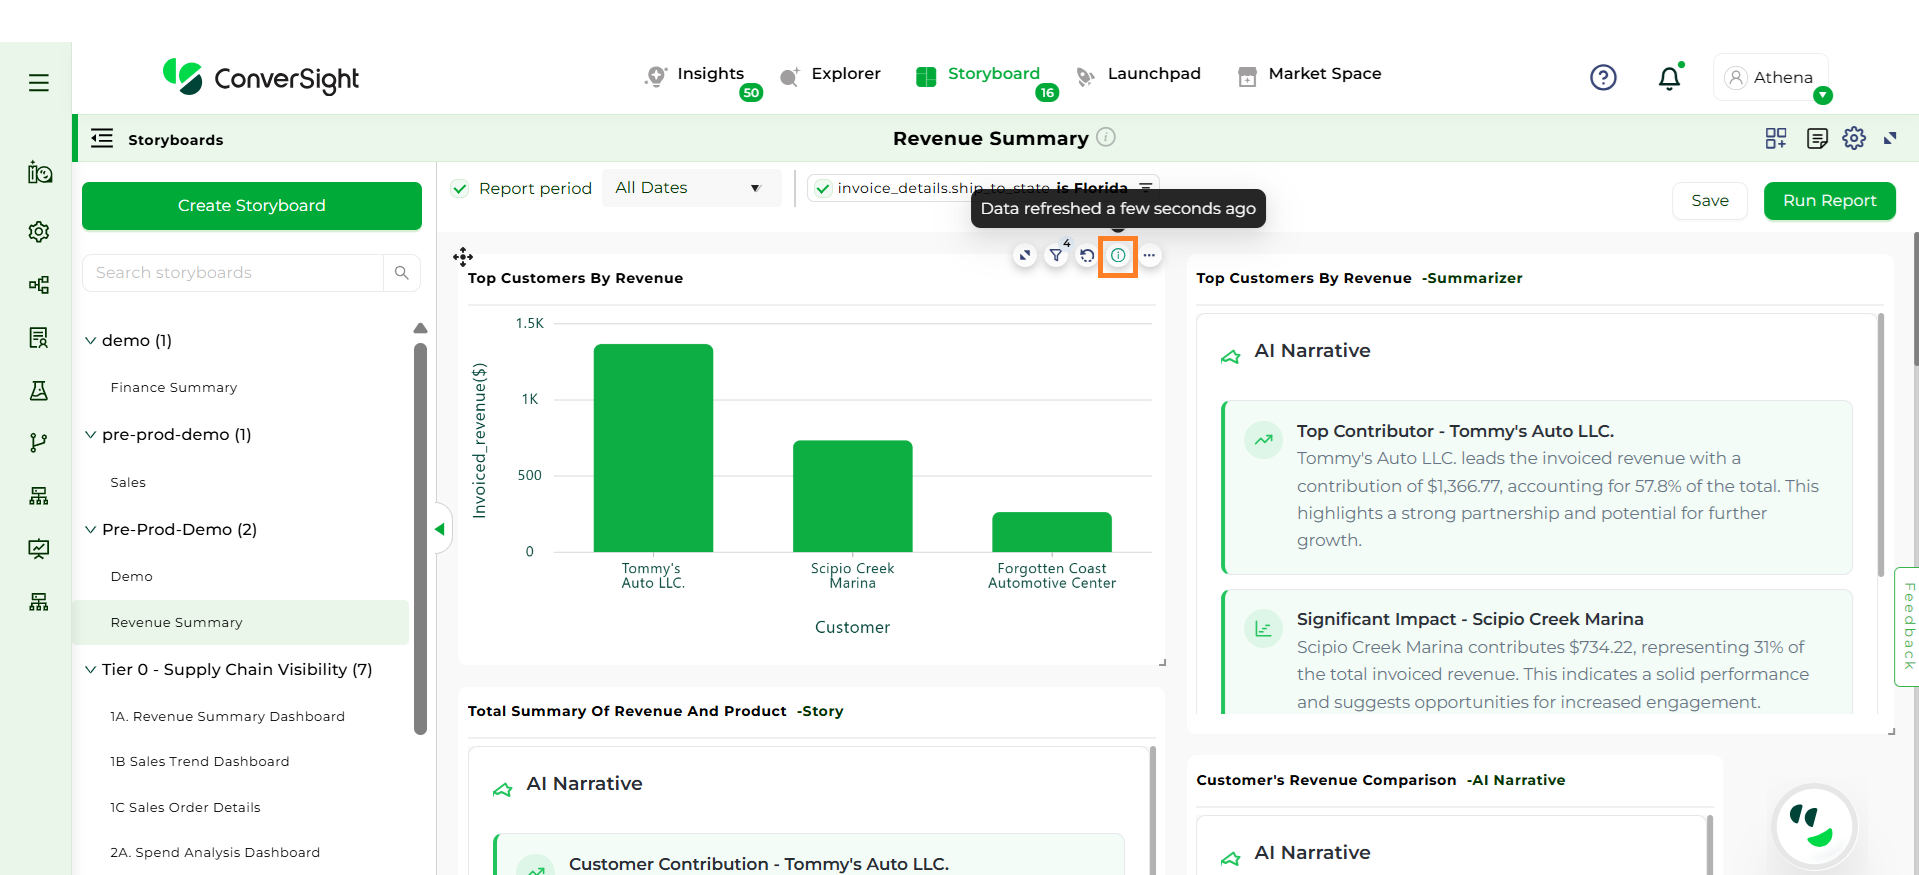
Information#
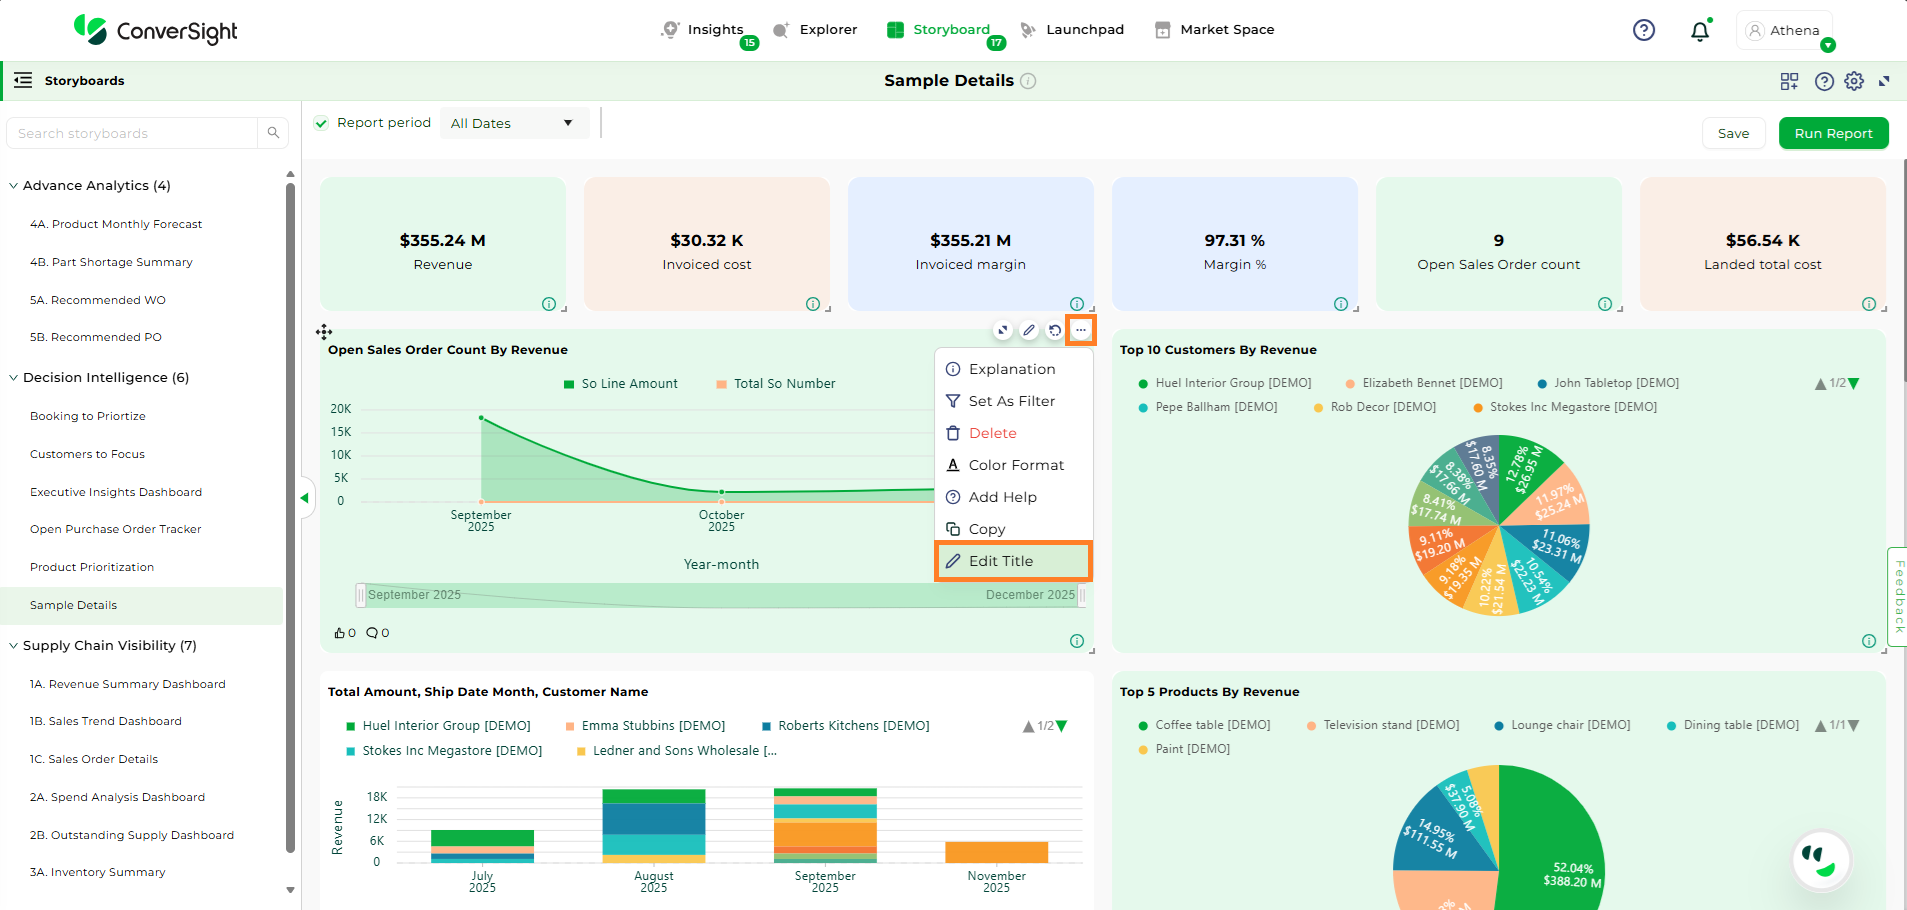
By clicking on  , on an insight provides access to multiple actions, including:
Explanation
Set As Filter
Delete
Color Format
Add Help
Copy
Edit Title
Explanation#
The Explanation option displays detailed information such as the Semantics, SQL Query, and SQL Form associated with the insight.

Explanation#
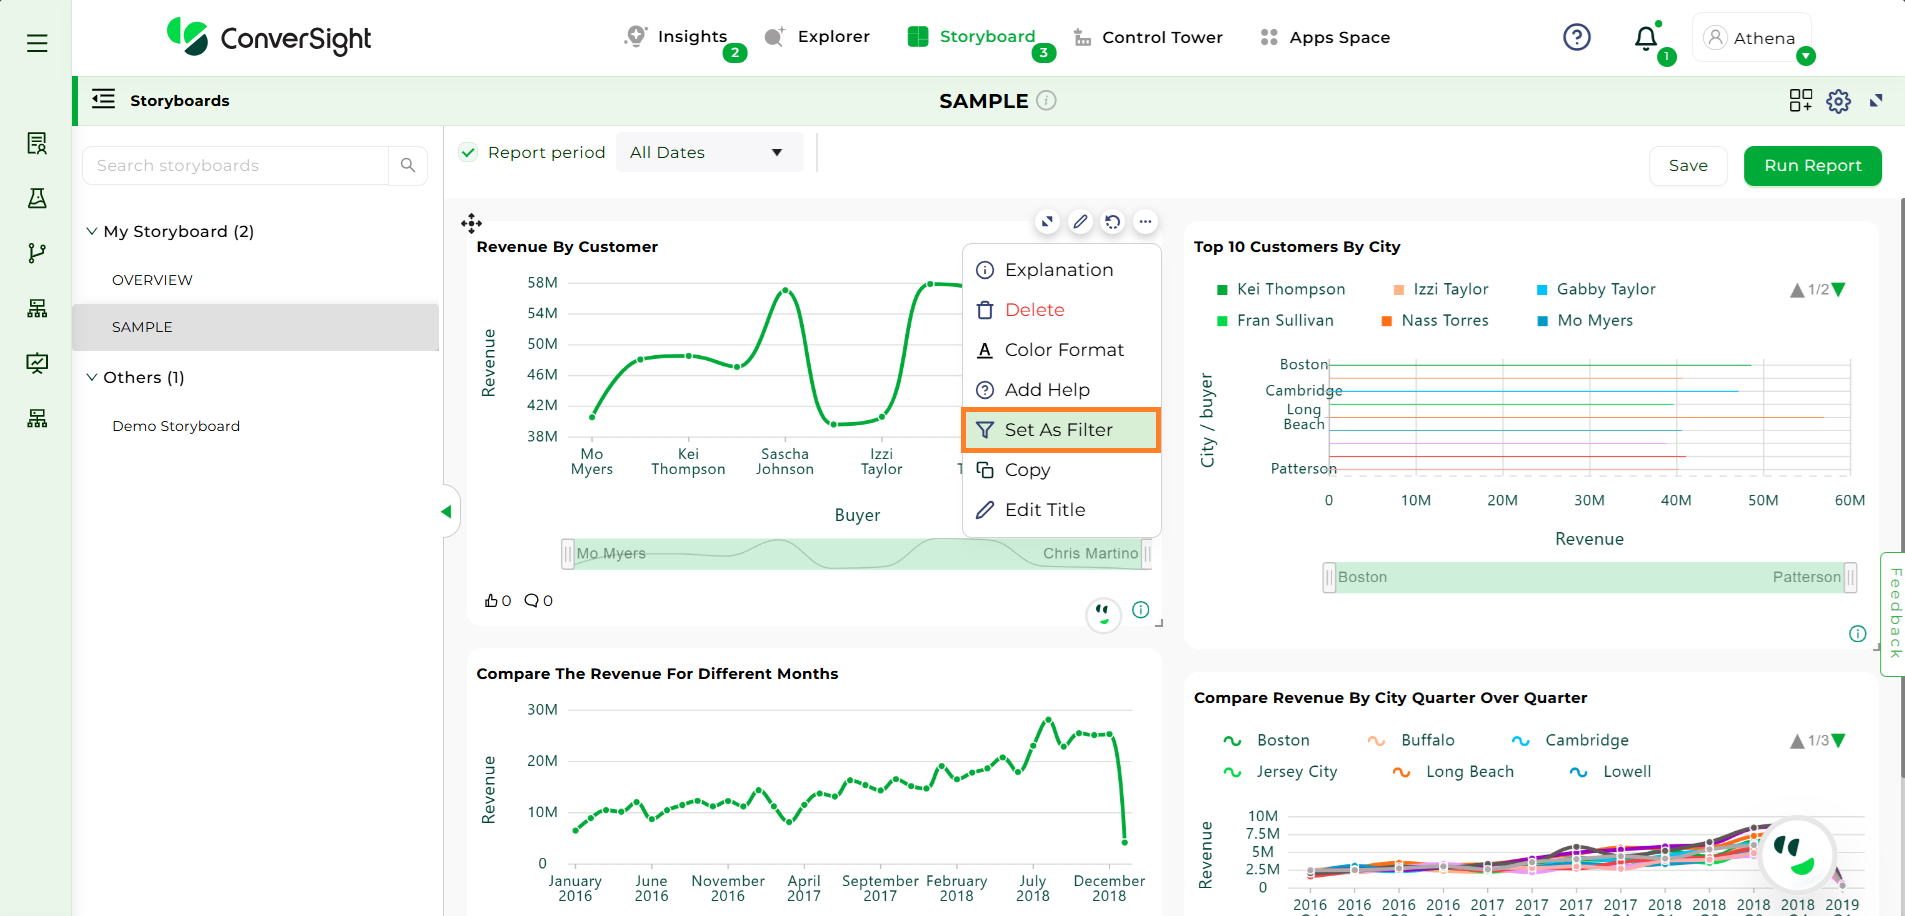
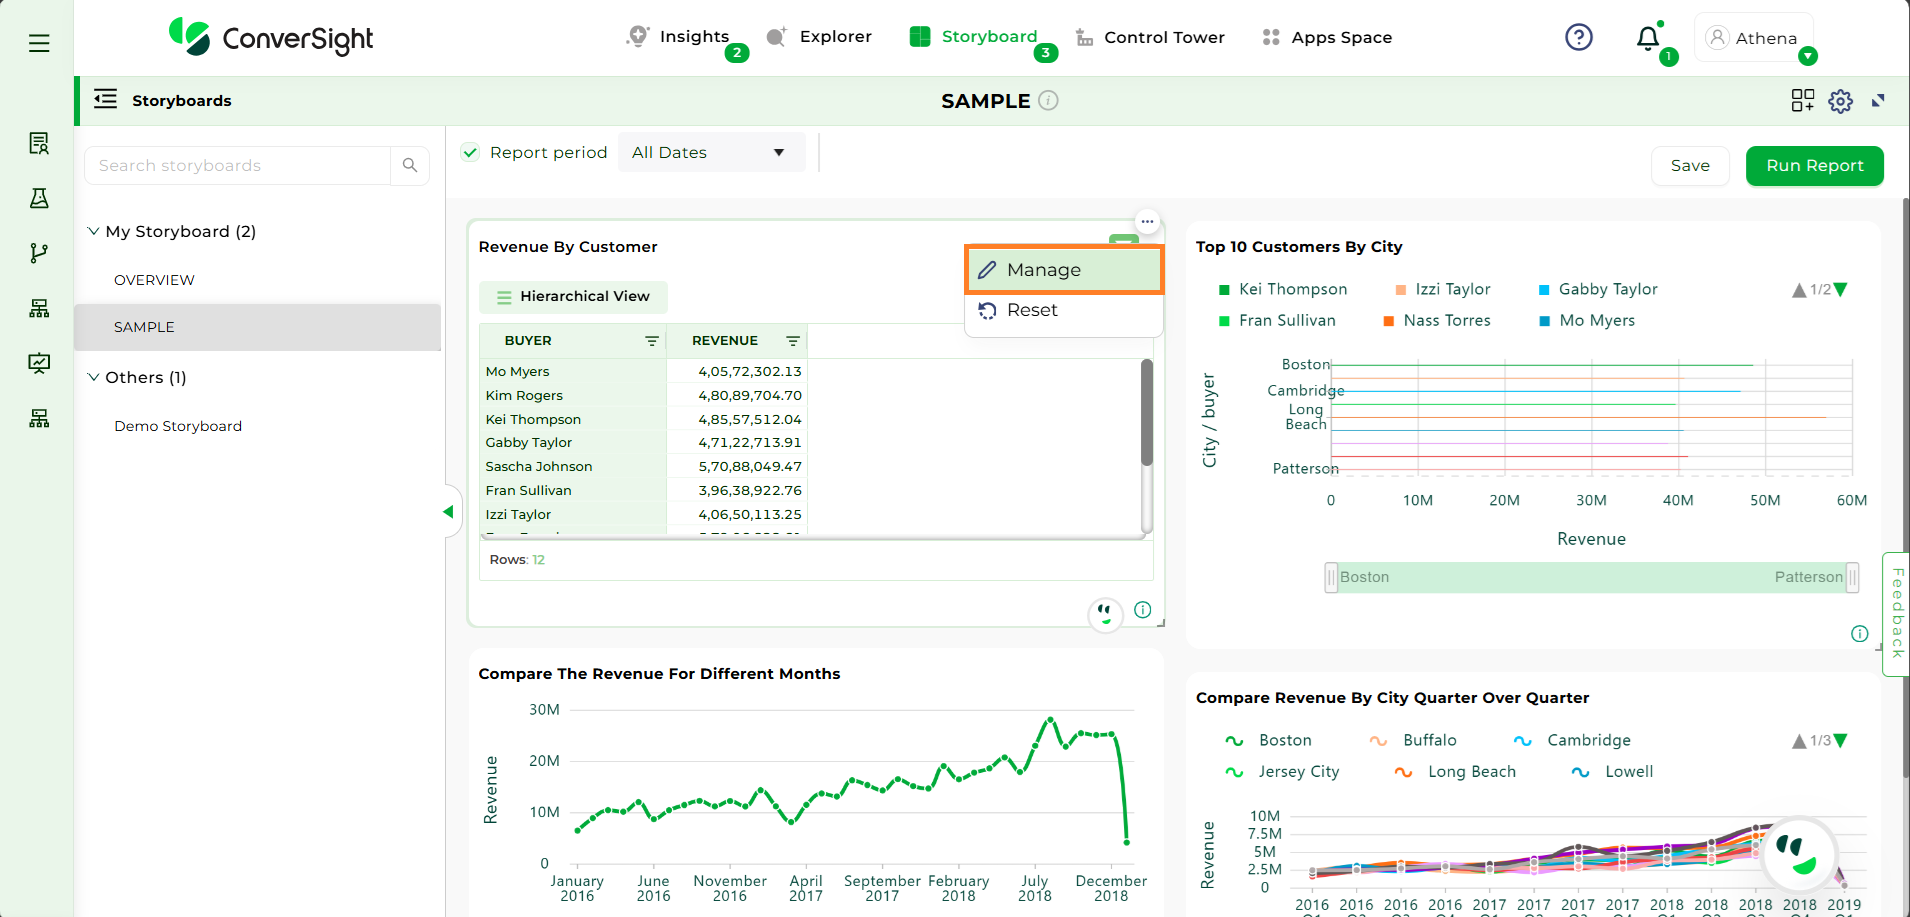
Set As Filter#
The Set As Filter option allows users to apply a column-specific filter across all insights within a storyboard. This feature is available only for insights in table format.
Set As Filter#
If an insight is not currently in table format, selecting “Set As Filter” from the dropdown menu will trigger a popup, prompting the user to convert the insight into a table before the filter can be applied.
Click on the “Yes” button to convert the selected insight into table format.
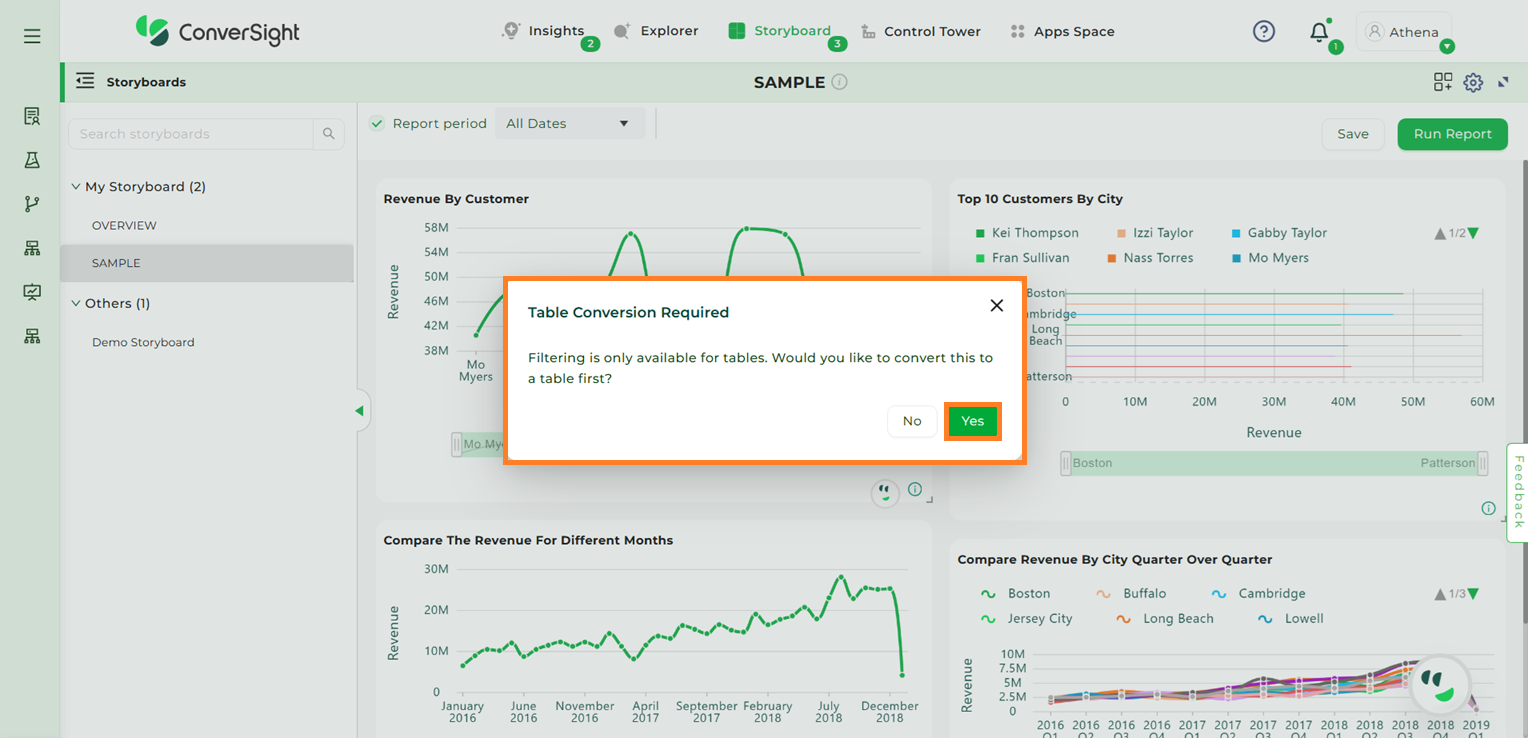
Set As Filter#
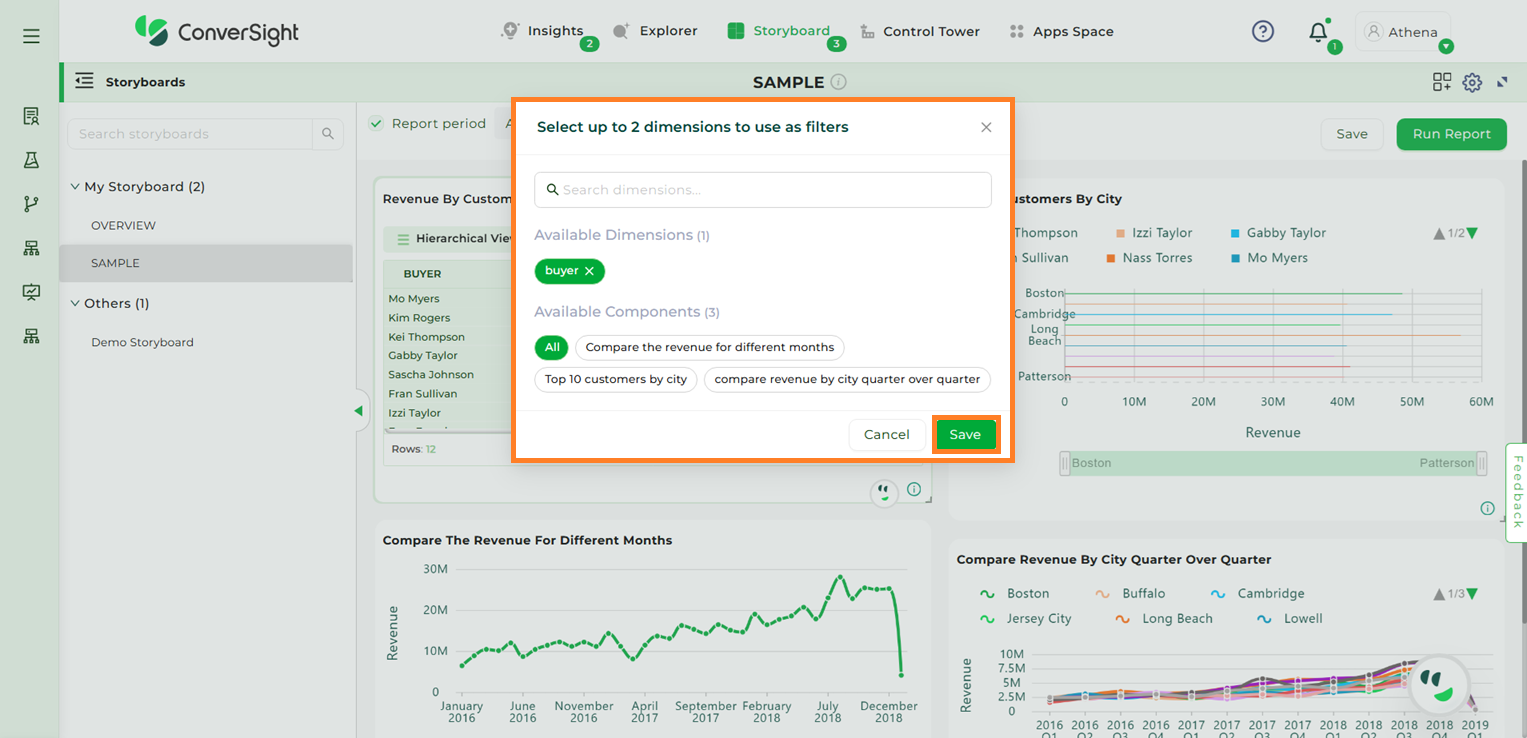
When you click “Yes”, the insight is automatically converted into table format. A new popup will then appear, prompting you to select the Dimension or Component to apply as the filter.
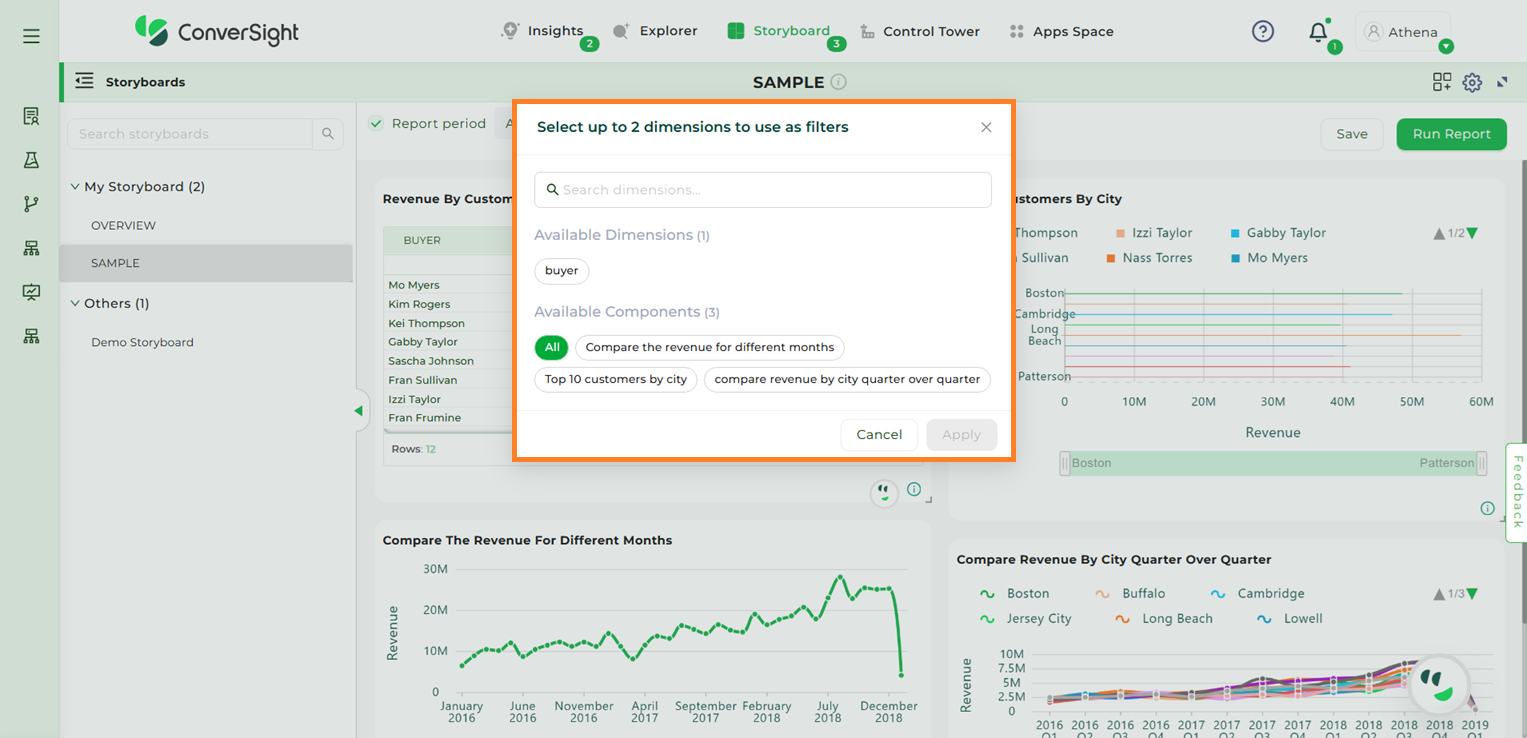
Selecting Dimensions#
To use a dimension column as a filter, select the desired column from the “Available Dimensions” section.
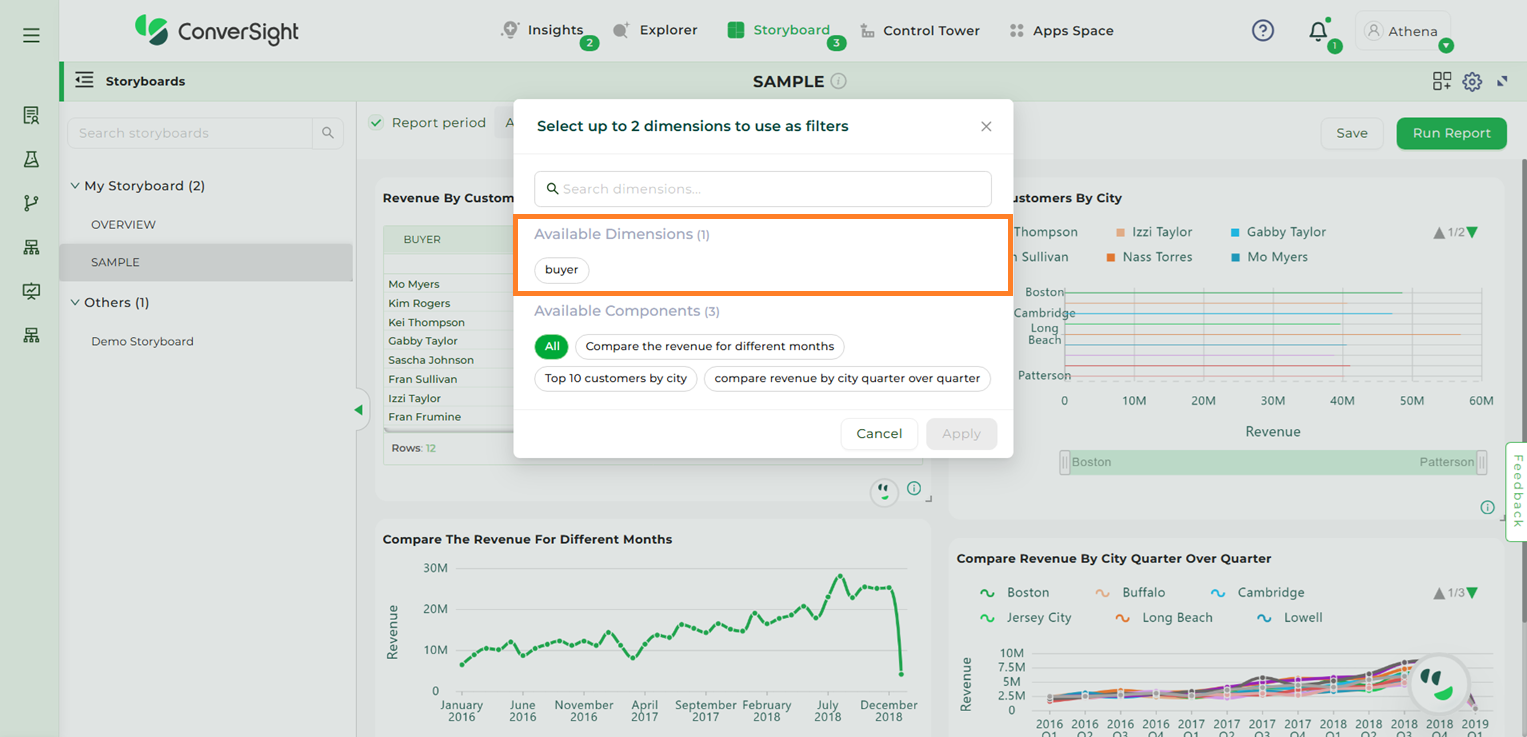
Available Dimensions#
Users can select components from the Available Components section in the storyboard. Choosing the All option will apply the filter to every component, but you also have the flexibility to apply it to a single component or any number of components of your choice.
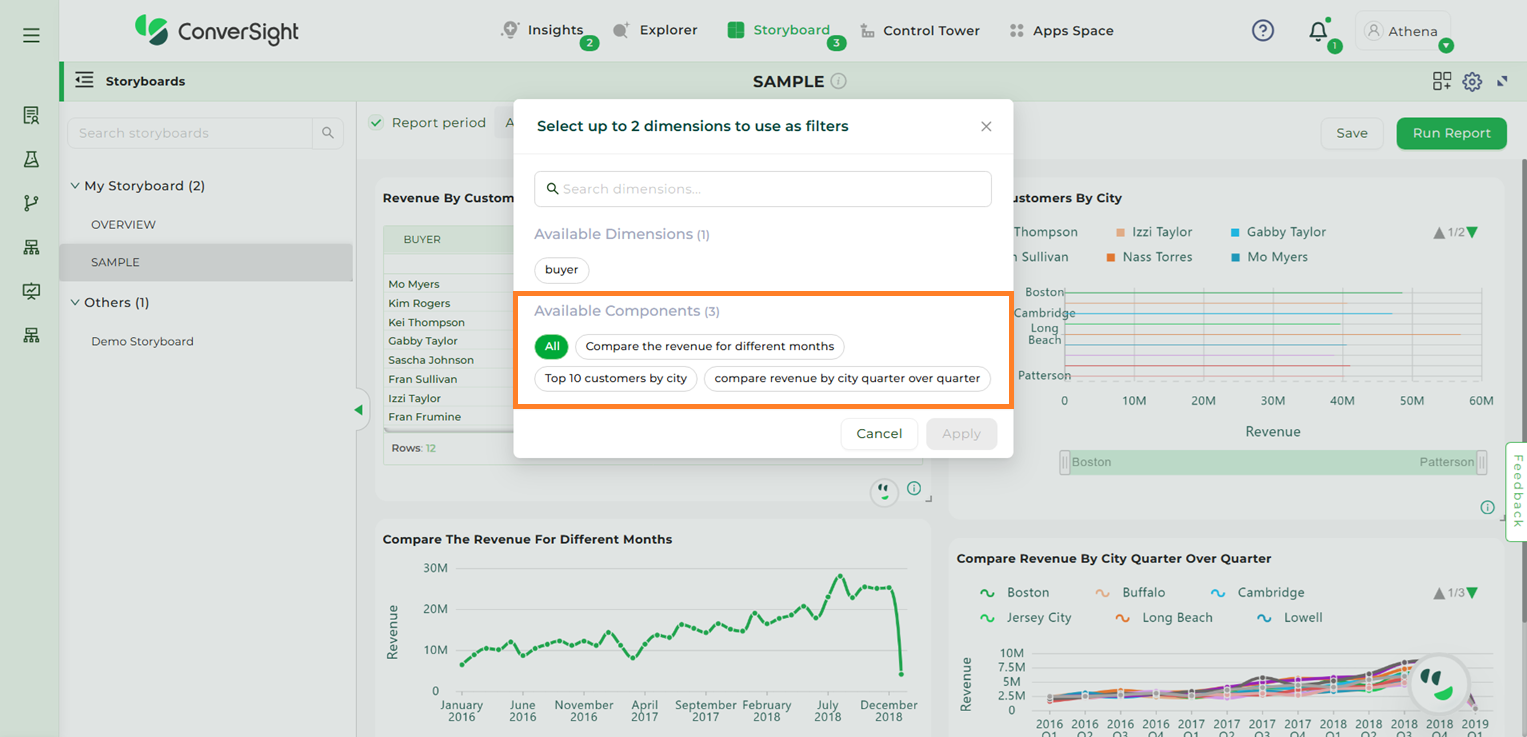
Available Dimensions#
After making your selection, click the “Apply” button to save the changes.
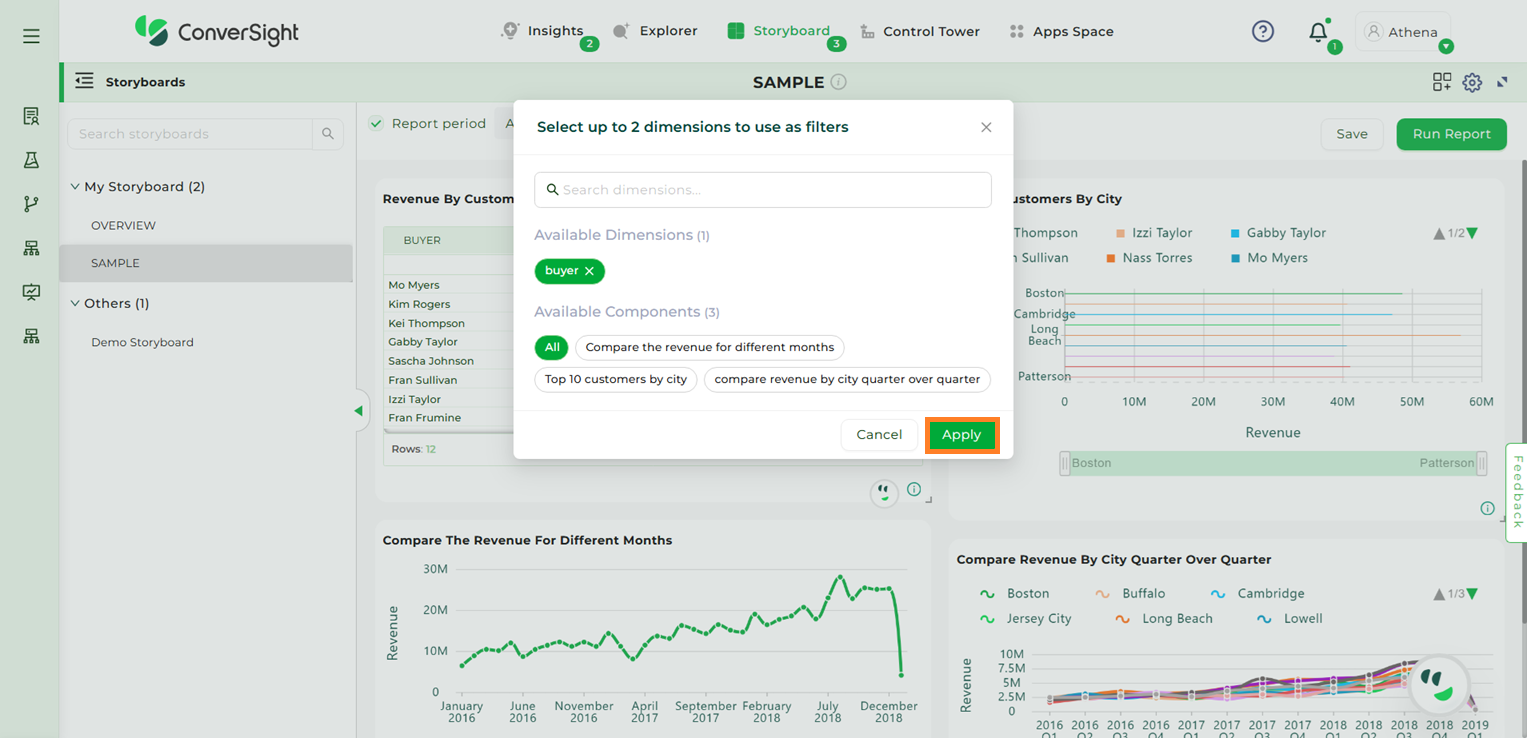
Apply#
The selected insight is now converted into a filter component, and a filter icon appears on the applied insight.
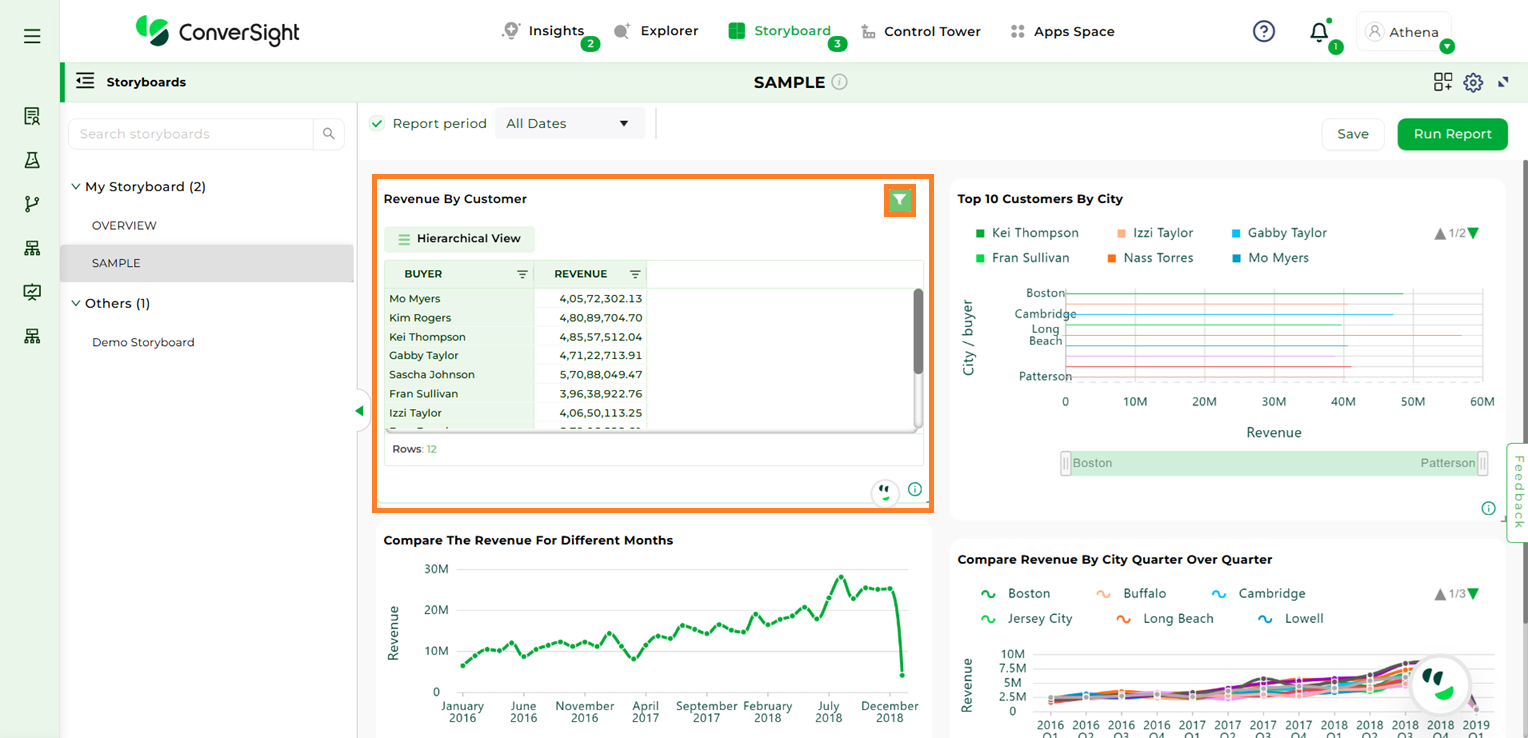
Apply#
To apply this filter to all storyboard components, click the desired row in the filter component. You will then see the filter applied across all components in the storyboard, along with the specific filter details. In this example, the filter applied is Item Name is Coffee table.
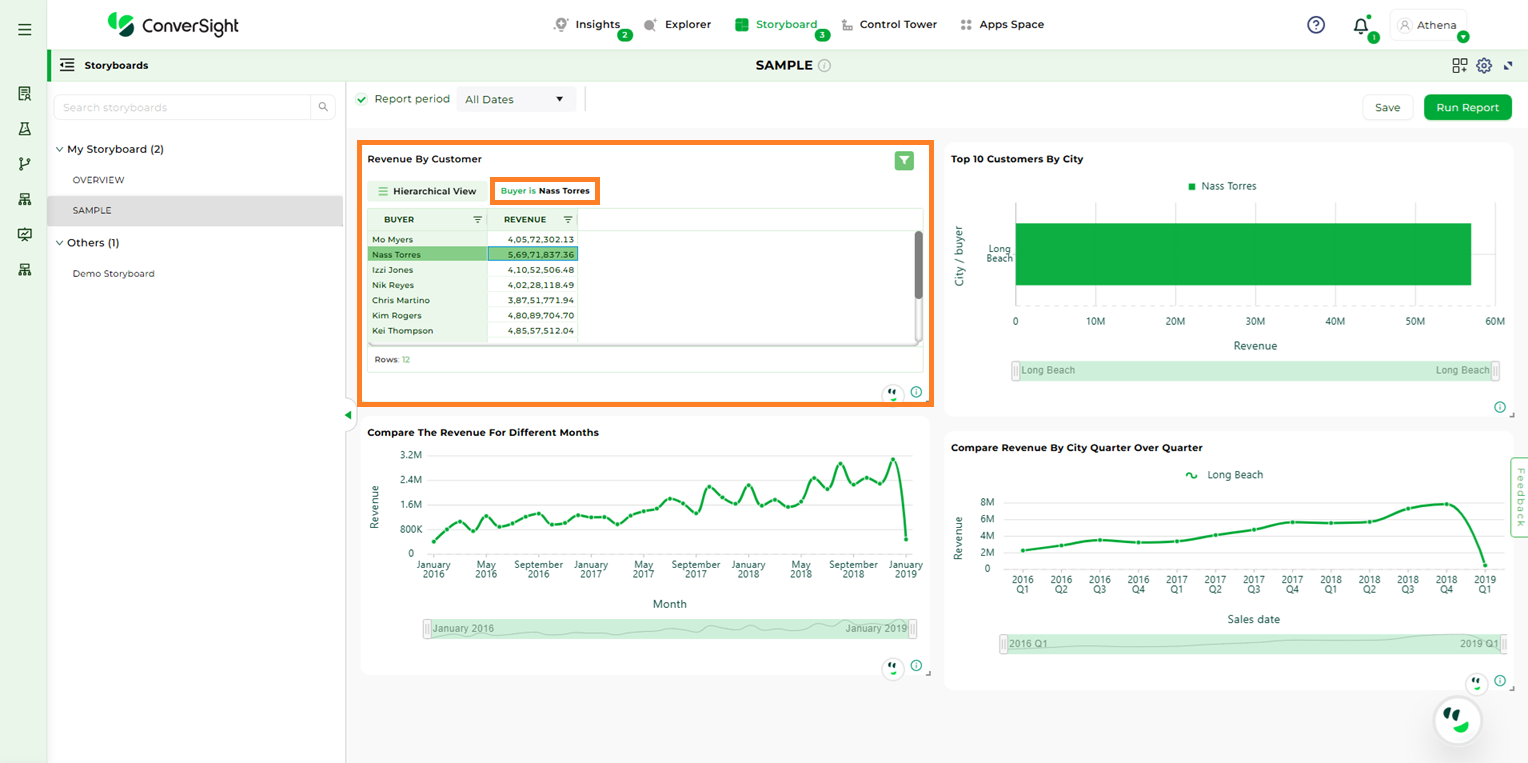
Apply#
Manage#
Selecting the “Manage” option allows you to edit the applied filter as needed.
Apply#
Once the changes are made, click “Save” to apply the modifications.
Save#
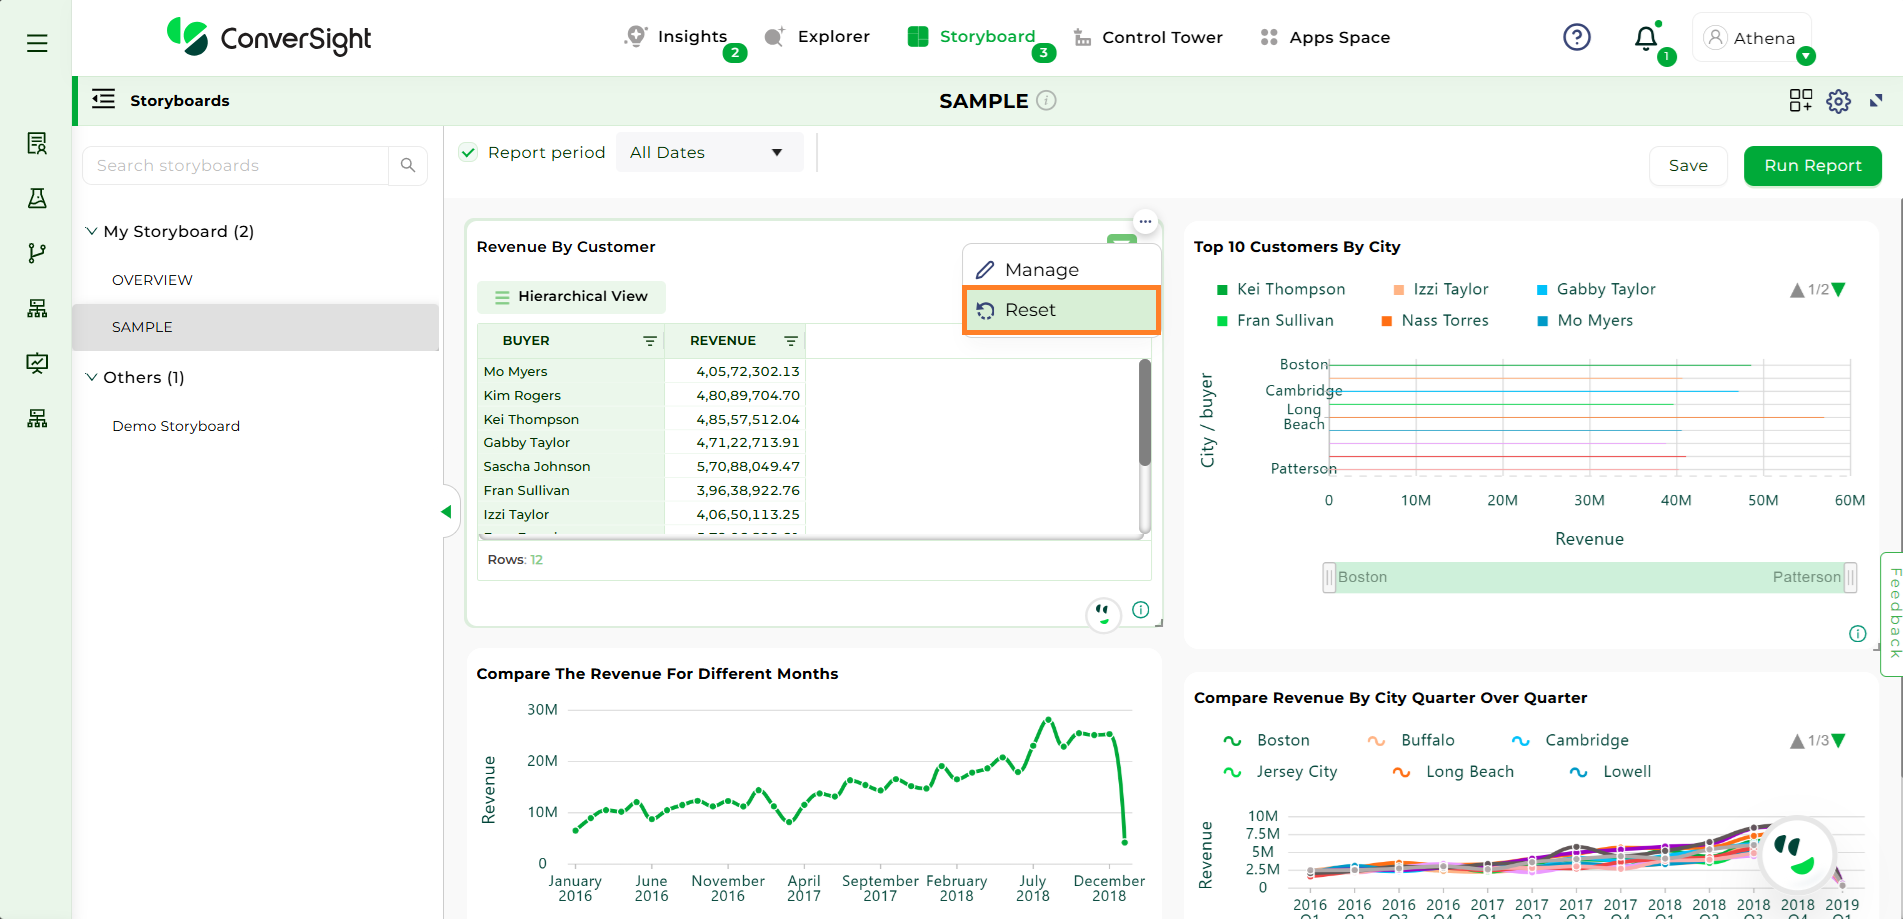
Reset#
The “Reset” option allows users to revert all filter component changes applied across the storyboard.
Reset#
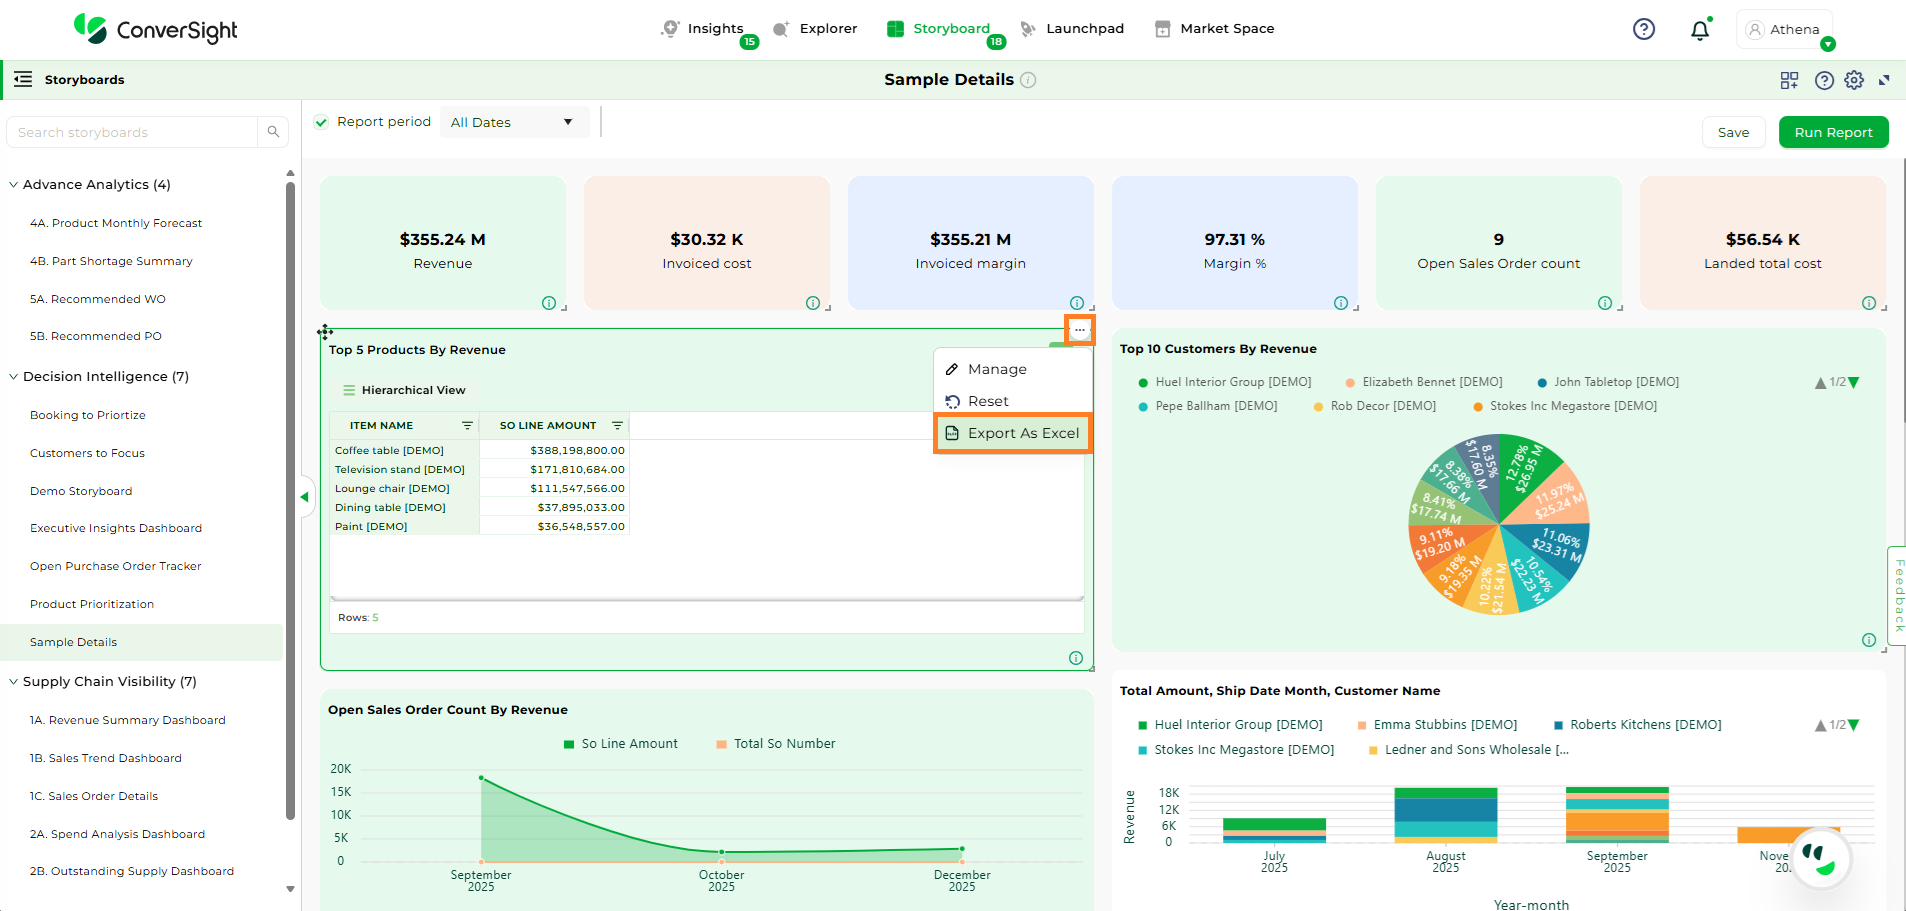
Export to Excel#
The Export to Excel option enables users to export that filter component in excel format.
Export to Excel#
Edit Title#
The Edit Title option allows users to modify the insight’s title or update its redirect navigation. Make the required changes and click ‘Submit’ to save them.
Edit Title#
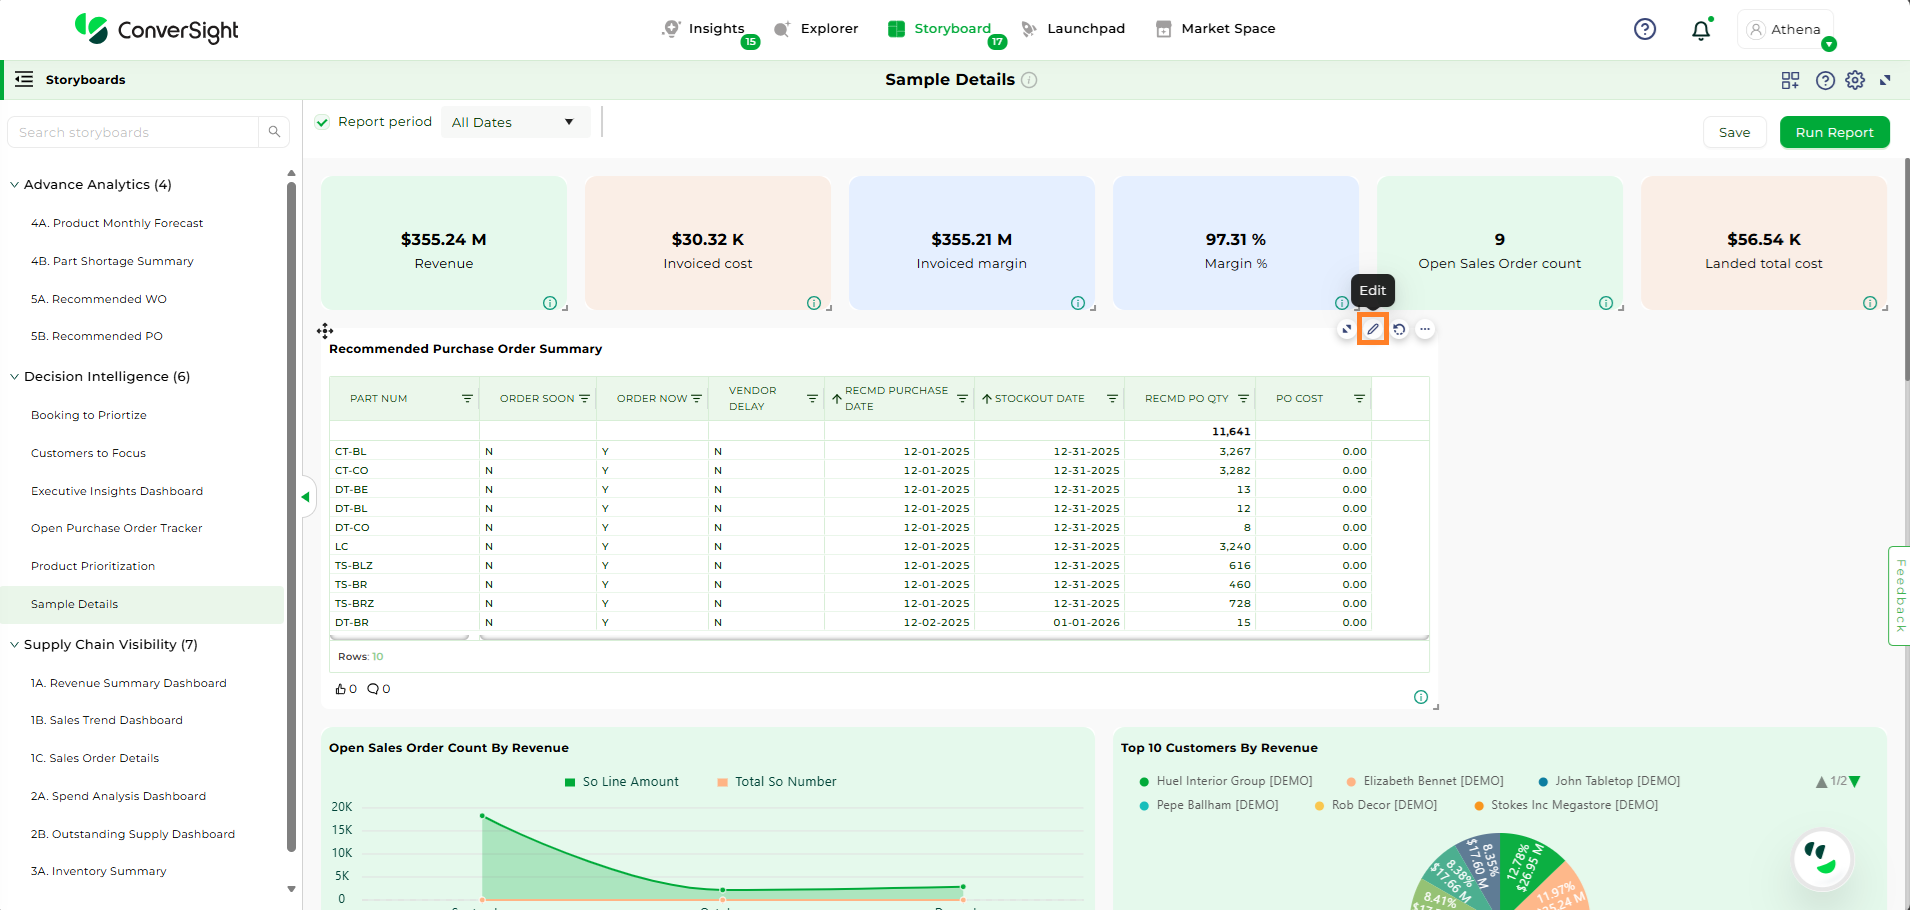
Edit Report#
Edit Report allows users to edit a specific component within a storyboard by opening it in Explorer. This provides direct access to the columns and settings of the component, making it easy to modify, update, and save changes without recreating the component.
The following are the steps:
Step 1: In Storyboard, select the component you want to edit and click the Edit Report icon. The component will then open in Explorer for editing.
Edit a Storyboard Component#
Explorer View#
Step 2: Modify or Add columns as needed, then click Run to apply changes.

Run Button#
NOTE
Any filters applied in the storyboard will not be retained or shown while editing the component in Explorer.
For components with Smart Columns, click the Edit icon to view the columns in the smart columns and edit the columns, as needed.
Smart Column#

Smart Column#
Step 3: Once all changes are done, click Save Changes to update the storyboard component.
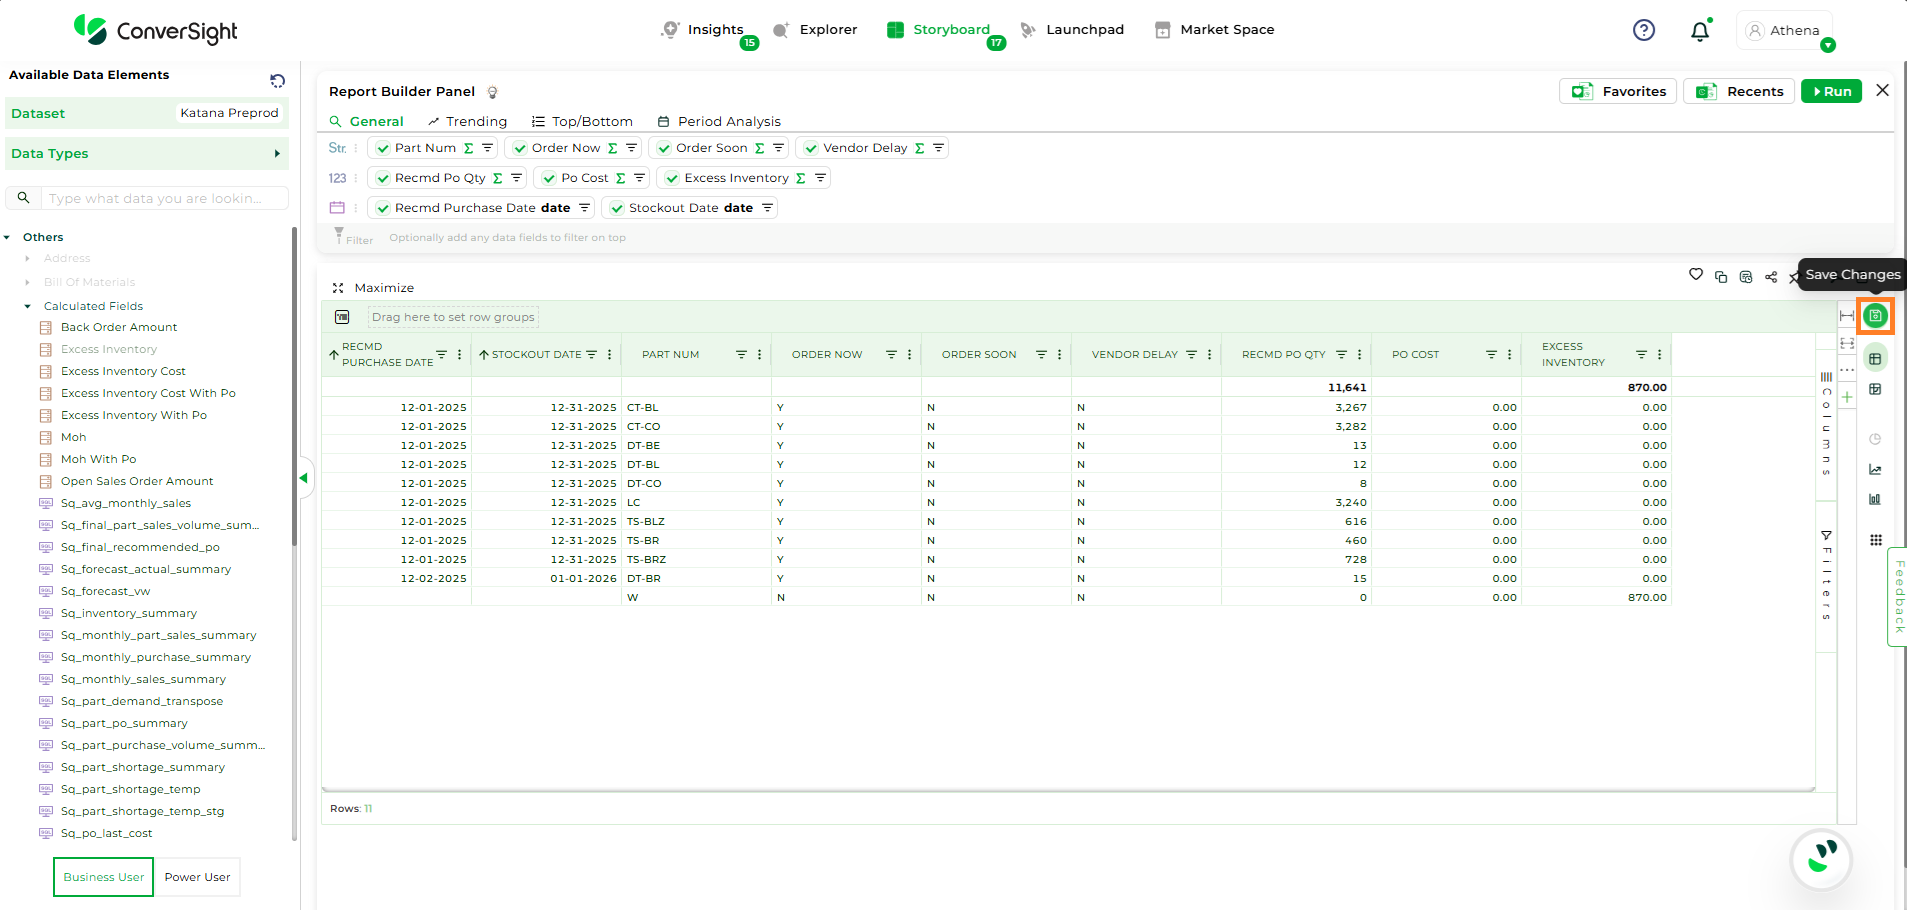
Save Changes#
Delete#
To remove an insight from the storyboard, select the Delete option. A confirmation prompt will appear—click Yes to proceed with deletion.
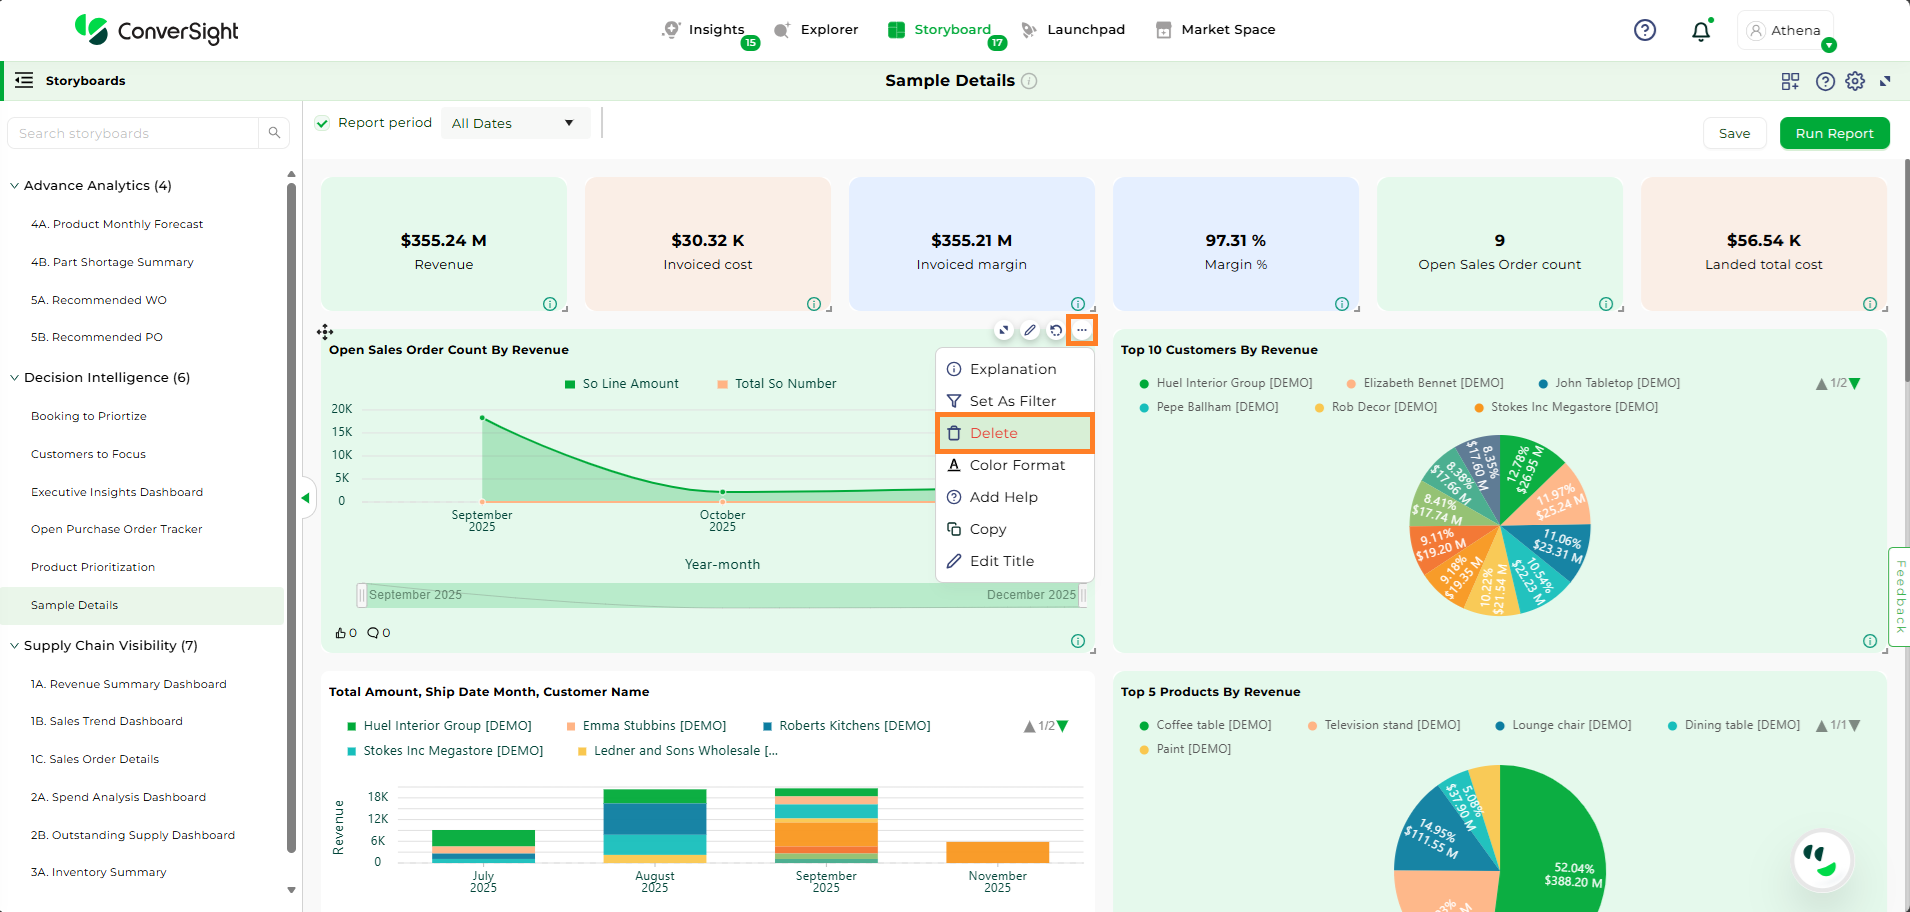
Delete#
Color Format#
The Color Format option enables users to apply basic and conditional color formatting based on predefined rules to certain columns. After configuring the desired formatting, click Save to apply the changes.

Color Format#
Add Help#
The Add Help option allows users to include supporting information or context to enhance the understanding of the insight.
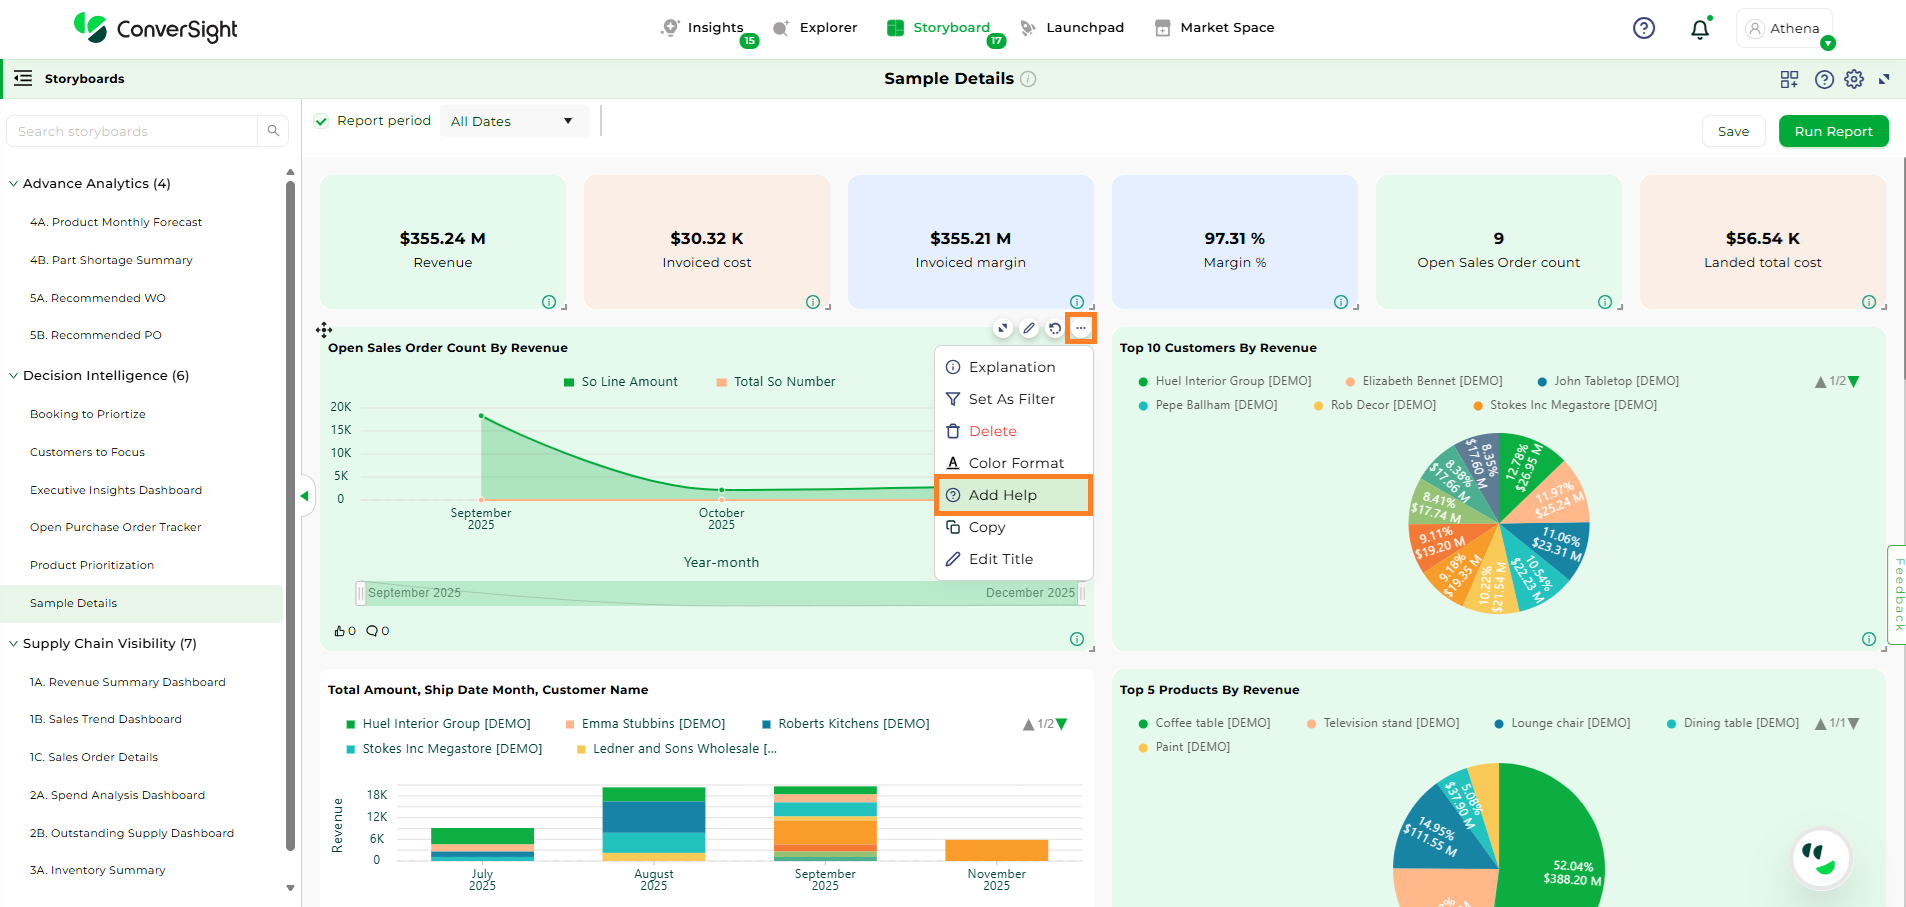
Add Help#
Copy#
The Copy option allows users to duplicate an insight from one storyboard to another. After selecting the target storyboard, click Submit to complete the action.

Copy Insight#
To watch the video, click on Storyboard Customization.