Automated Insights#
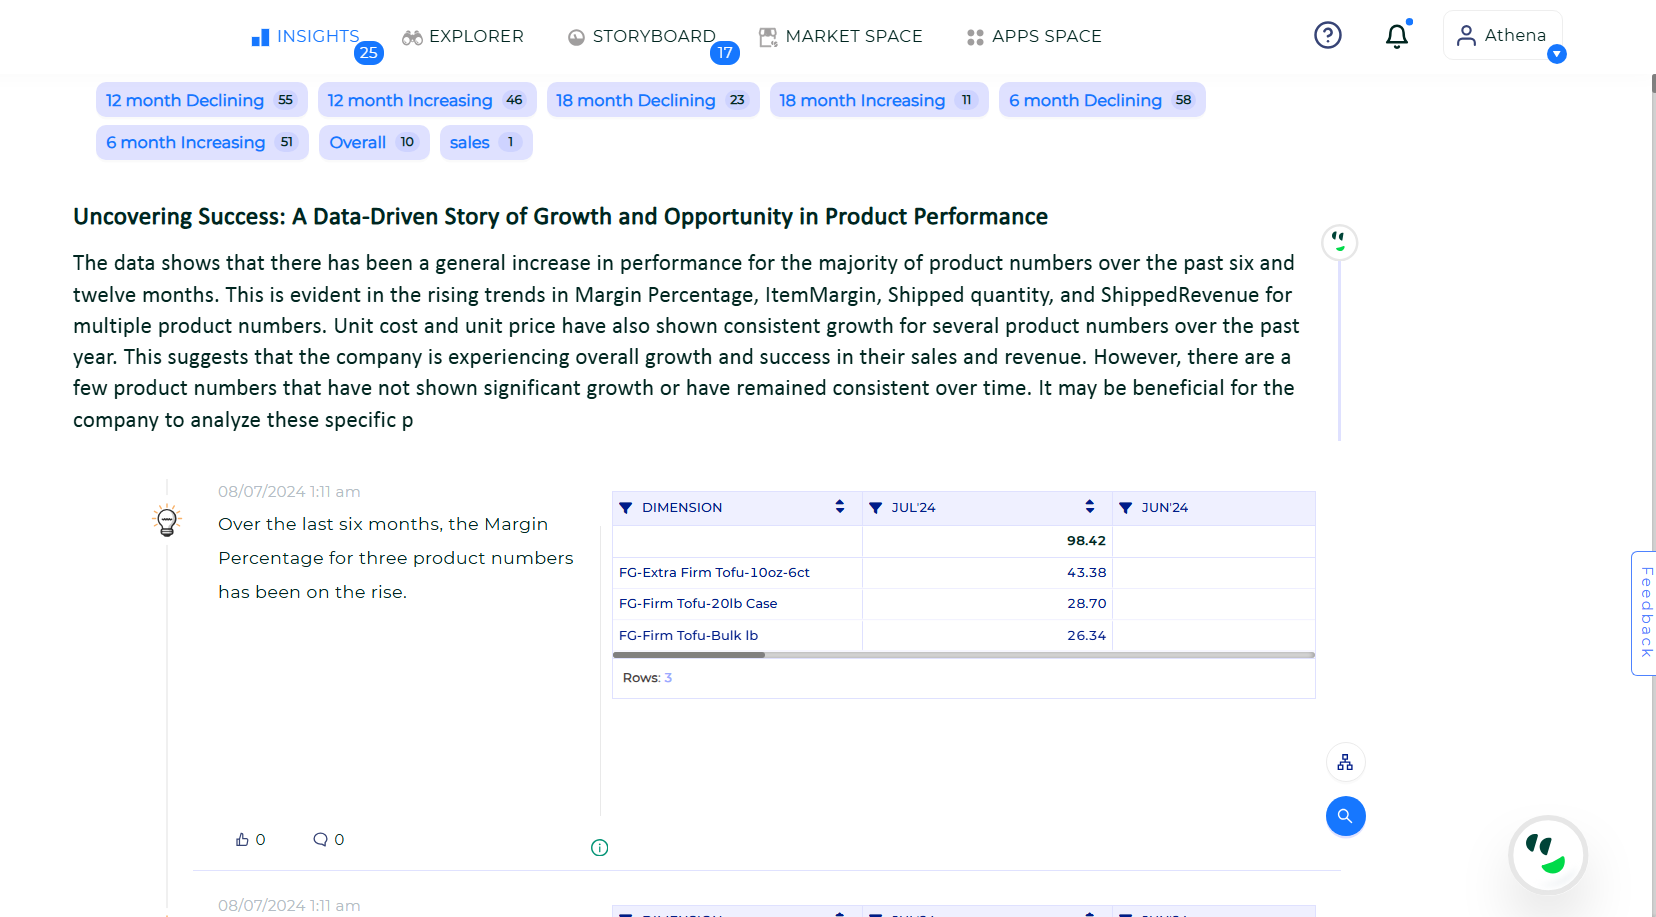
Automated Insights is a prominent feature of Fishbowl AI Insights that significantly enhances data analytics and streamlines business decision-making. Utilizing advanced algorithms and data processing capabilities, this feature transforms raw data into actionable intelligence with minimal user intervention. By automatically processing data from various connected sources, Fishbowl AI Insights identifies meaningful patterns, trends and anomalies. It generates user-specific insights, including visualizations, reports and dashboards that highlight essential metrics and Key Performance Indicators (KPIs) that businesses require to make informed decisions. This automated approach not only saves time but also minimizes the risk of human error, allowing businesses to focus on strategic initiatives. Furthermore, with real-time updates, users receive current insights that reflect the latest data, enabling timely decision-making in a rapidly changing environment.
Automated Insights#
If users wish to obtain a detailed view of the insights, they can click on the Explore icon associated with the respective insights. The Explore feature provides a comprehensive suite of functionalities designed to delve deeper into the generated insights.
Insights Explore#
Features in Explore#
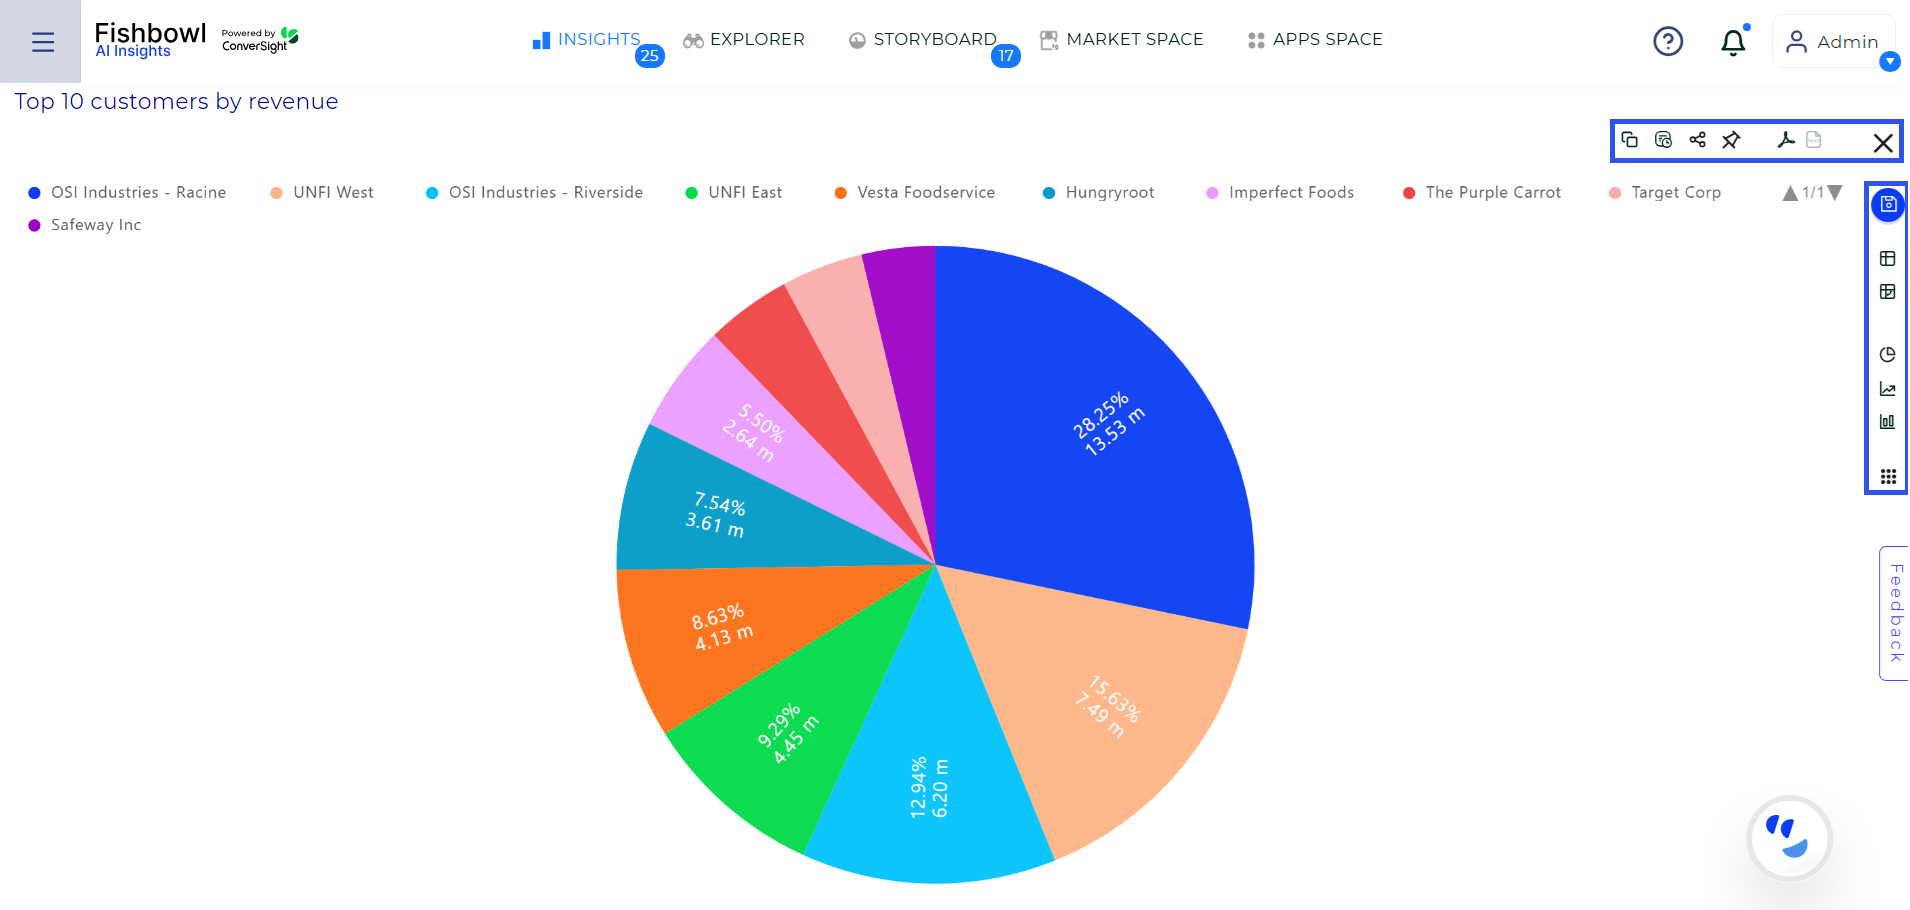
Upon clicking the Explore icon from the Insights page, users can access detailed views of their insights allowing for a focused analysis of critical data.
Copy Insights: Users can easily copy any insight to their clipboard by utilizing the Copy icon. This feature enables quick sharing or further analysis in other applications.
Share Reports: To share a report with others, users can click on the Share icon. For multiple email recipients, they can separate emails with a comma and enter a custom message in the dialog box before sending the report.
Add to Storyboard: Users can click the Add to Storyboard icon located in the right corner of the Insights page. This allows them to select relevant content and save it for future reference in the Storyboard feature.
Export to PDF: To create a PDF version of their report, users can click on the Export to PDF icon. This feature facilitates the distribution of insights in a professional format.
Quick View Tab: The Quick View tab provides an overview of various chart types and tables, including CS Table, Pivot, Pie Chart, Line Chart and Column Chart, enhancing the visualization options available to users.
More Visuals: The More Visuals icon showcases a wide range of chart types available in ConverSight. Each chart type provides a different visualization of the insights, allowing users to select the most appropriate format for their data presentation.
Insights Explore#
For more detailed information view Insights.