Explorer#
Explorer is an advanced and dynamic approach to report creation by categorizing data according to specific business areas within the dataset. It is designed to streamline data exploration and analysis for users of all skill levels, ensuring a user-friendly experience. This feature provides a structured methodology for gaining data insights, allowing users to selectively choose datasets and columns pertinent to their analysis.
Explorer#
For more detailed information refer Explorer.
Features in Explore#
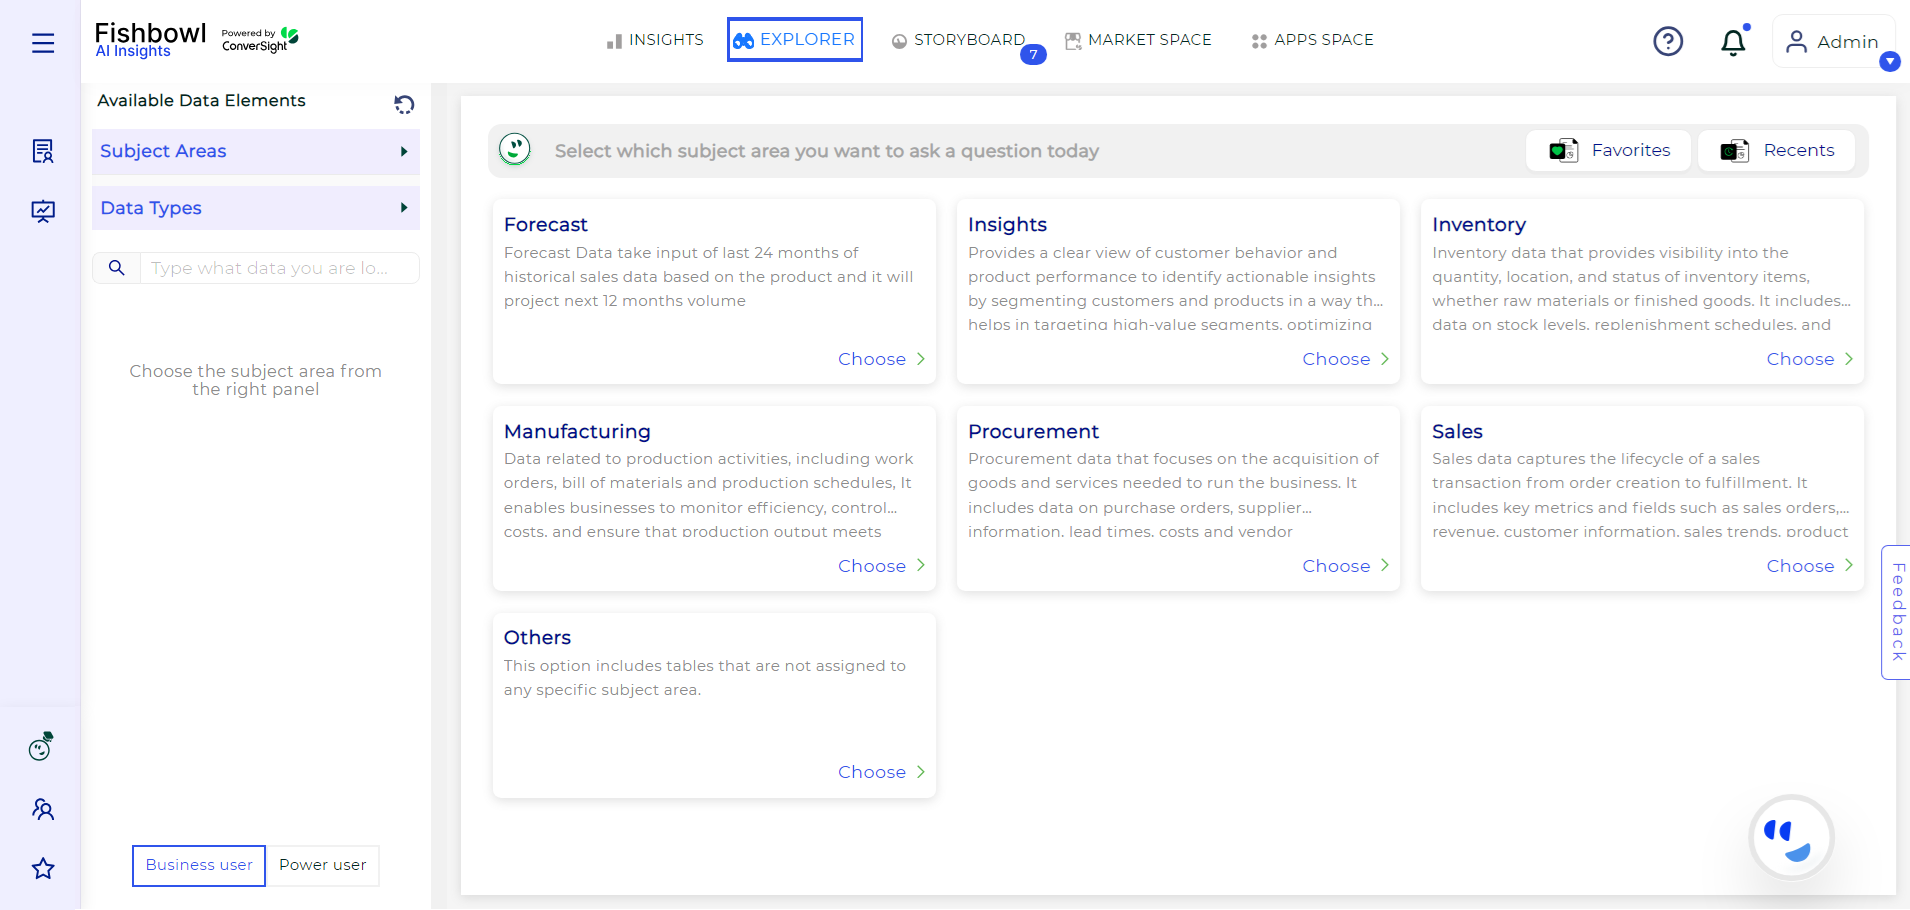
The Explorer tab within ConverSight allows users to efficiently create dynamic reports by categorizing data based on specific subject areas within the dataset. This feature simplifies data exploration and analysis for users of all expertise levels, ensuring insights are gained through a structured method. Let’s take a look at it.
Creation of Reports: Creation of Reports: The report creation feature in ConverSight allows users to generate custom reports by selecting specific datasets and subject areas. It simplifies data analysis by organizing relevant tables, columns and data types into categories such as metrics, dimensions and dates. Users can apply aggregations to metric columns and filter data to display only the most relevant information. Once configured, reports can be generated easily by clicking the Run button.
Copy Reports: Users can easily copy any report to their clipboard by utilizing the Copy to Clipboard icon. This feature enables quick sharing or further analysis in other applications.
Share Reports: To share a report, users can click the Share icon. They can separate multiple email addresses with commas and include a custom message in the dialog box before sending the report.
Add to Storyboard: Users can click the Add to Storyboard icon located in the right corner of the Insights page. This allows them to select relevant content and save it for future reference in the Storyboard feature.
Export to PDF: The Export feature allows you to convert reports into either PDF or Excel formats with a simple click. Exporting to PDF preserves the report’s formatting, while exporting to Excel enables advanced data analysis and manipulation.
More Visuals: The More Visuals icon showcases a wide range of chart types available in ConverSight. Each chart type provides a different visualization of the insights, allowing users to select the most appropriate format for their data presentation.