Data Loading through Notebook#
Data loading through the notebook feature in ConverSight entails leveraging Jupyter Notebook within the platform for data uploading and management. This approach offers users a versatile and interactive means of handling datasets directly through the notebook interface. The process comprises two primary procedures such as
Dataset Creation
Loading Data through the Notebook.
To watch the video, click on Data Loading through Notebook.
Dataset Creation#
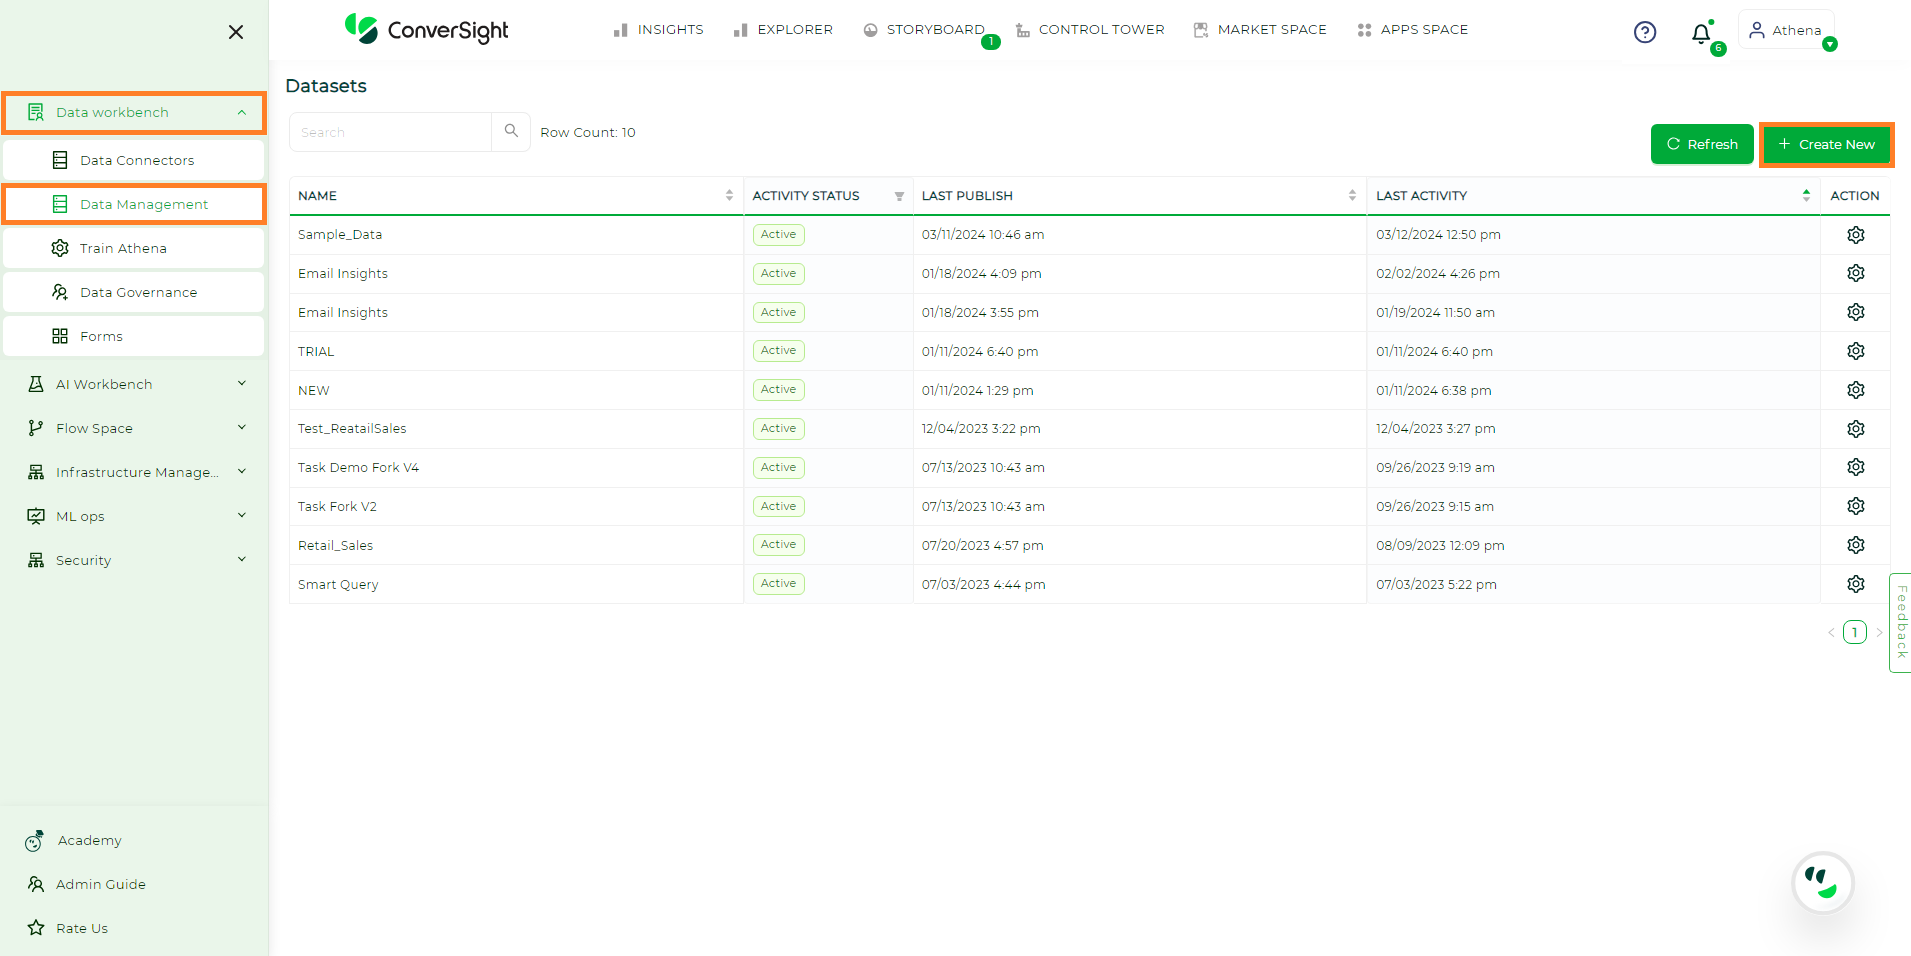
Navigate to the Data Management section under the Data Workbench menu and select the Create New option to initiate the dataset creation in ConverSight.
Creating Dataset#
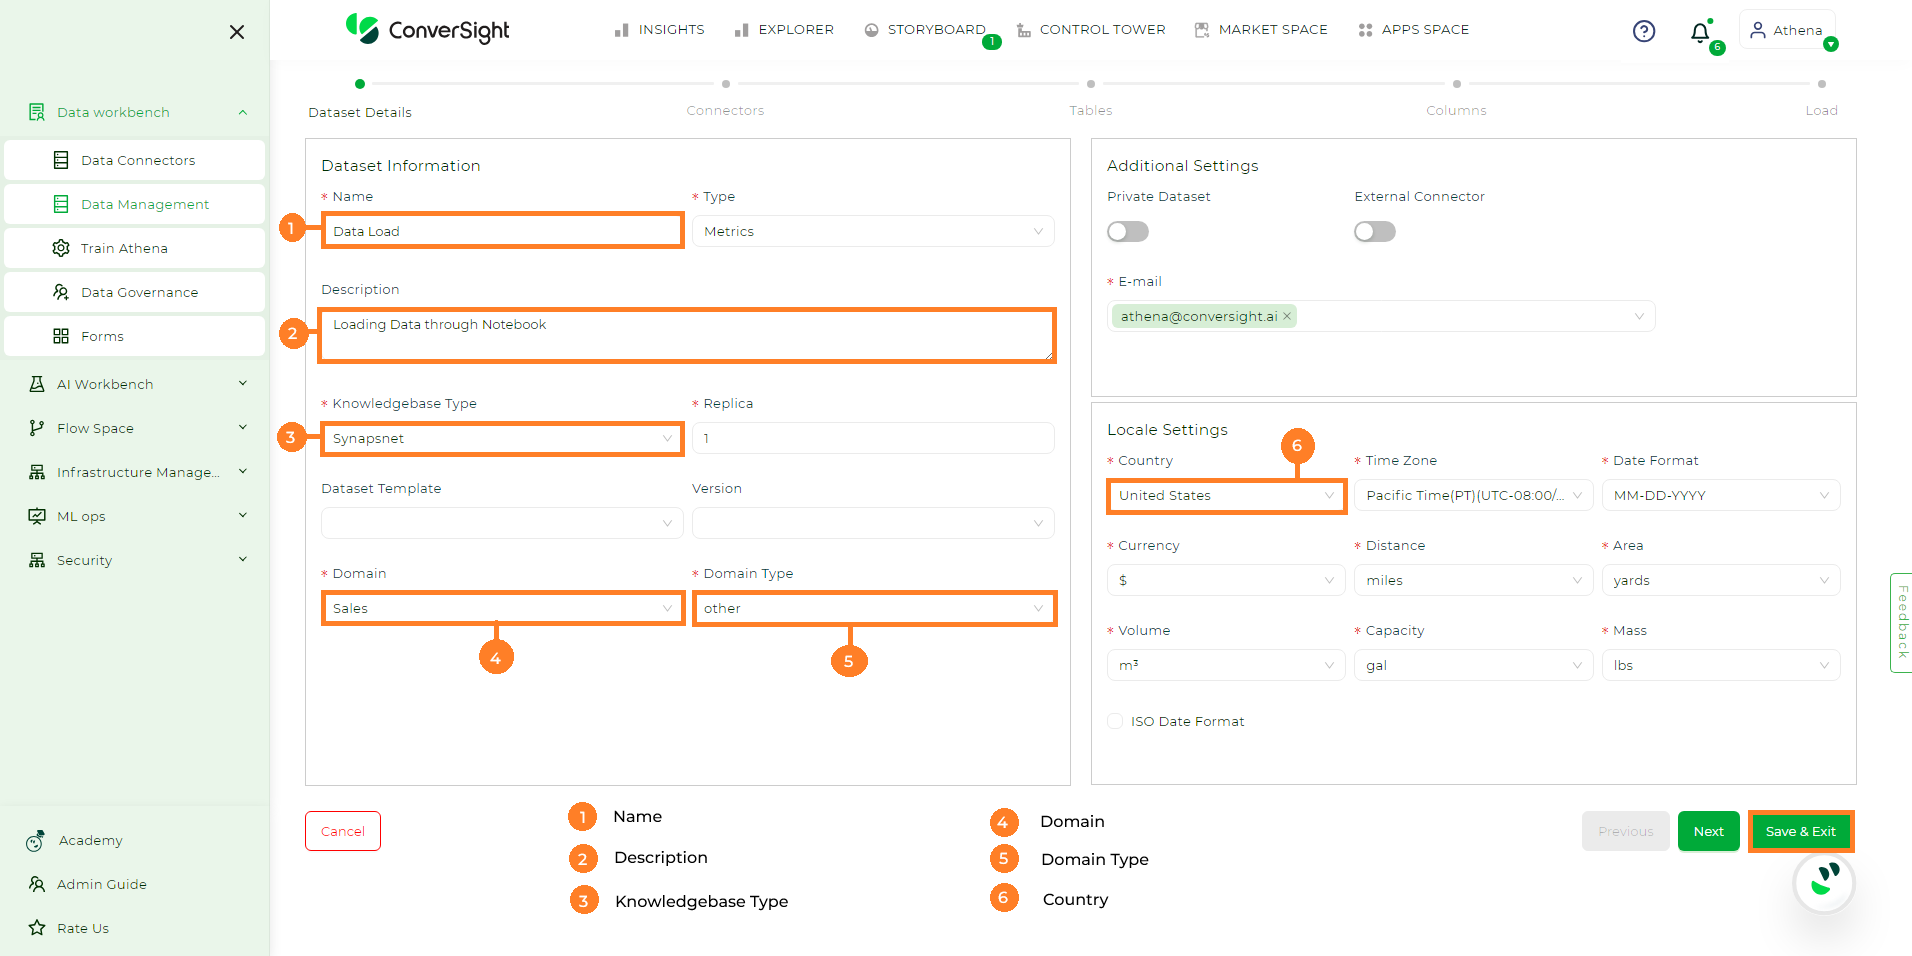
In the Dataset Details page provide the necessary inputs as follows.
Name - Provide a name to your dataset.
Description - Description is an optional argument that can provide a detailed explanation.
Knowledgebase Type - Select the desired knowledgebase type from the dropdown such as KBNet or SynapsNet.
Domain - Specify the domain by identifying its primary category.
Domain Type - Choose the preferred domain type from the dropdown.
Country - Select your country from the dropdown. All other units will be automatically set.
Creating Dataset#
Once you have completed entering all the necessary details, proceed by clicking the Save and Exit button. This results in the creation of a new Active dataset with no preloaded data.
NOTE
In ConverSight, loading data through the notebook is restricted to Excel and CSV file formats.
Obtaining Datset ID#
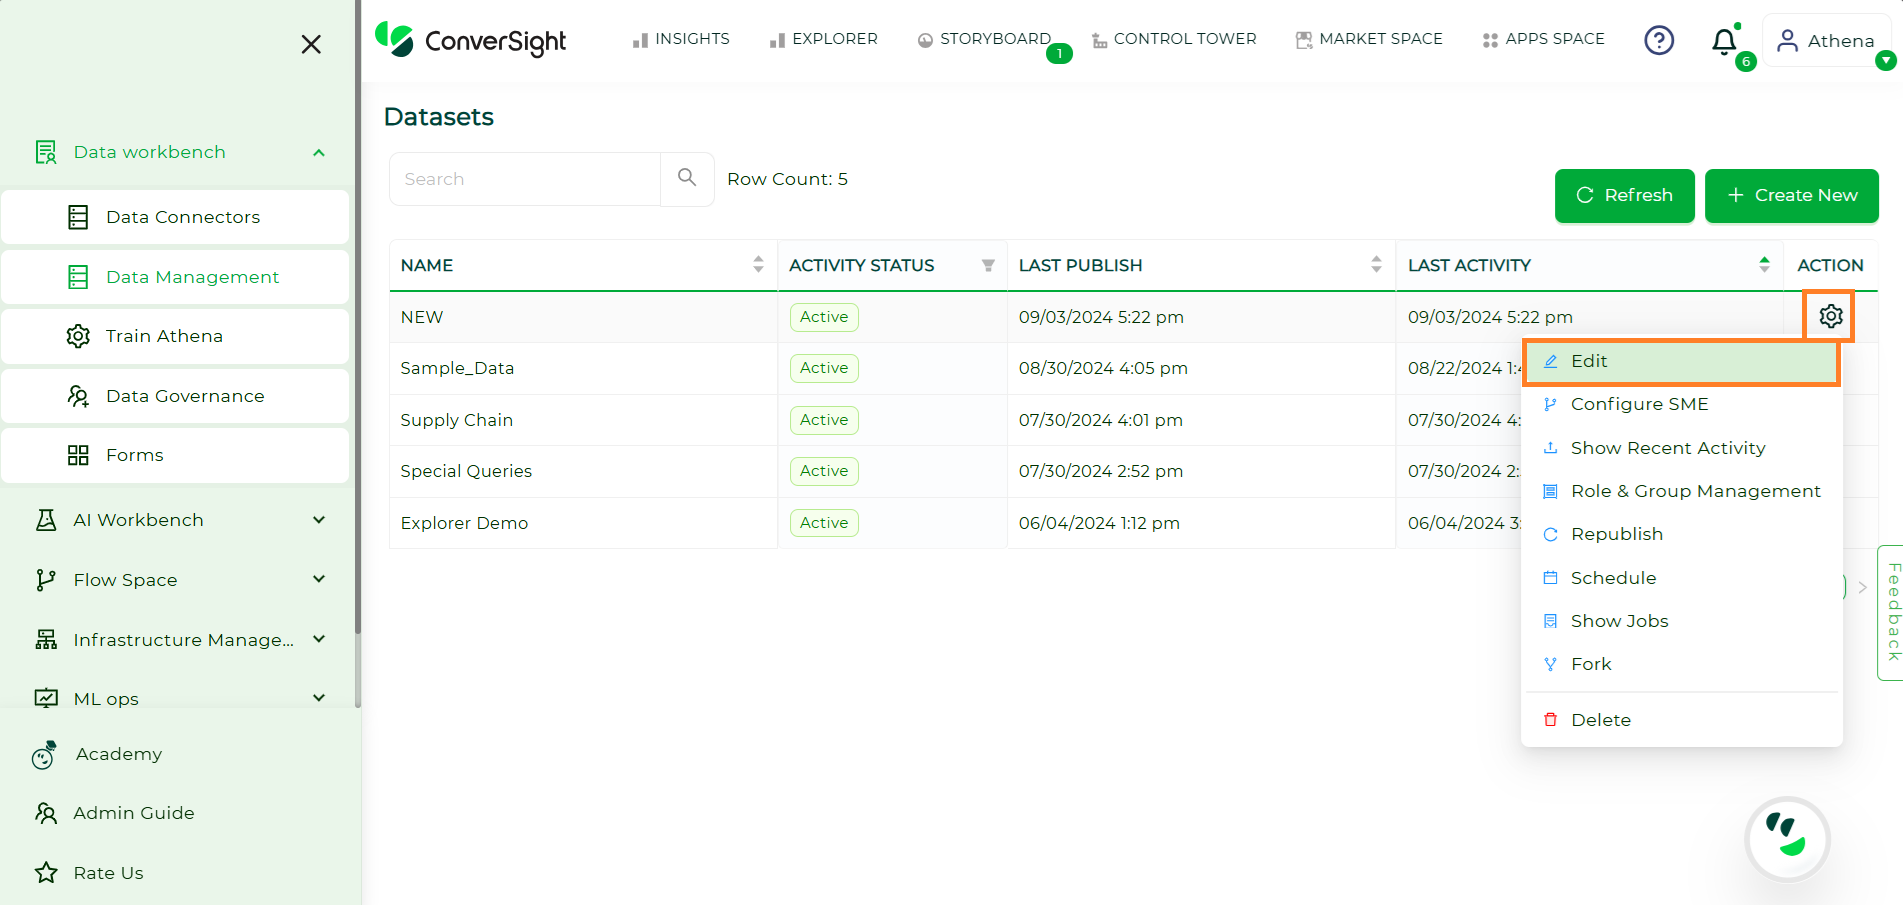
To load data using the notebook, you need the Dataset ID. To obtain the Dataset ID navigate to the Data Management section in the Data Workbench menu.
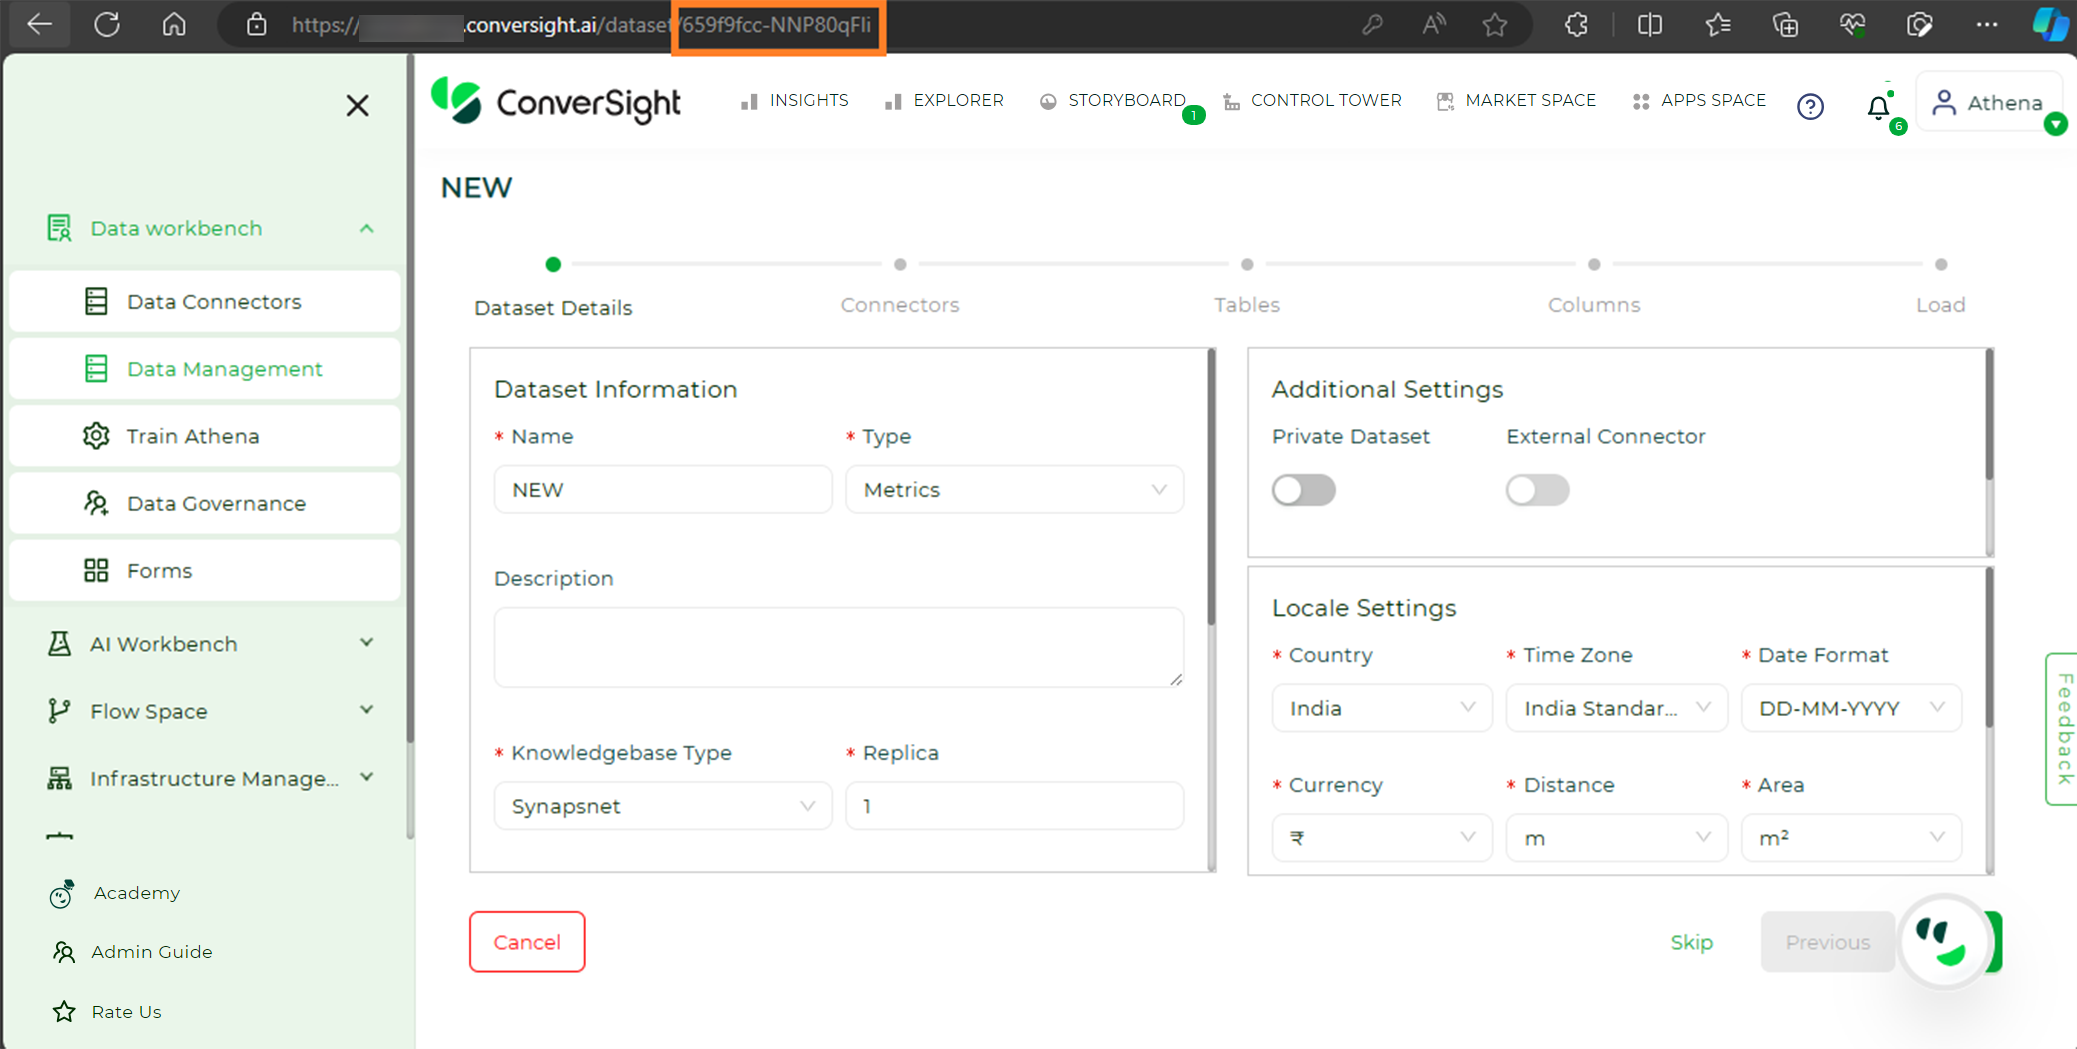
Next click the Settings icon in the Action column, then choose Edit from the dropdown. Copy the last part of the URL on the Edit Dataset page – that’s your Dataset ID.
Getting DatasetID#
Getting DatasetID#
Loading Data through the Notebook#
The following are the steps to load your data through the Notebook in ConverSight platform.
Step 1: Navigate to the AI Workbench menu in the configuration sidebar and select the Notebook option.

Accessing Notebook#
Step 2: Select the preferred notebook and click on the ![]() icon located in the Action field of the associated Notebook.
icon located in the Action field of the associated Notebook.
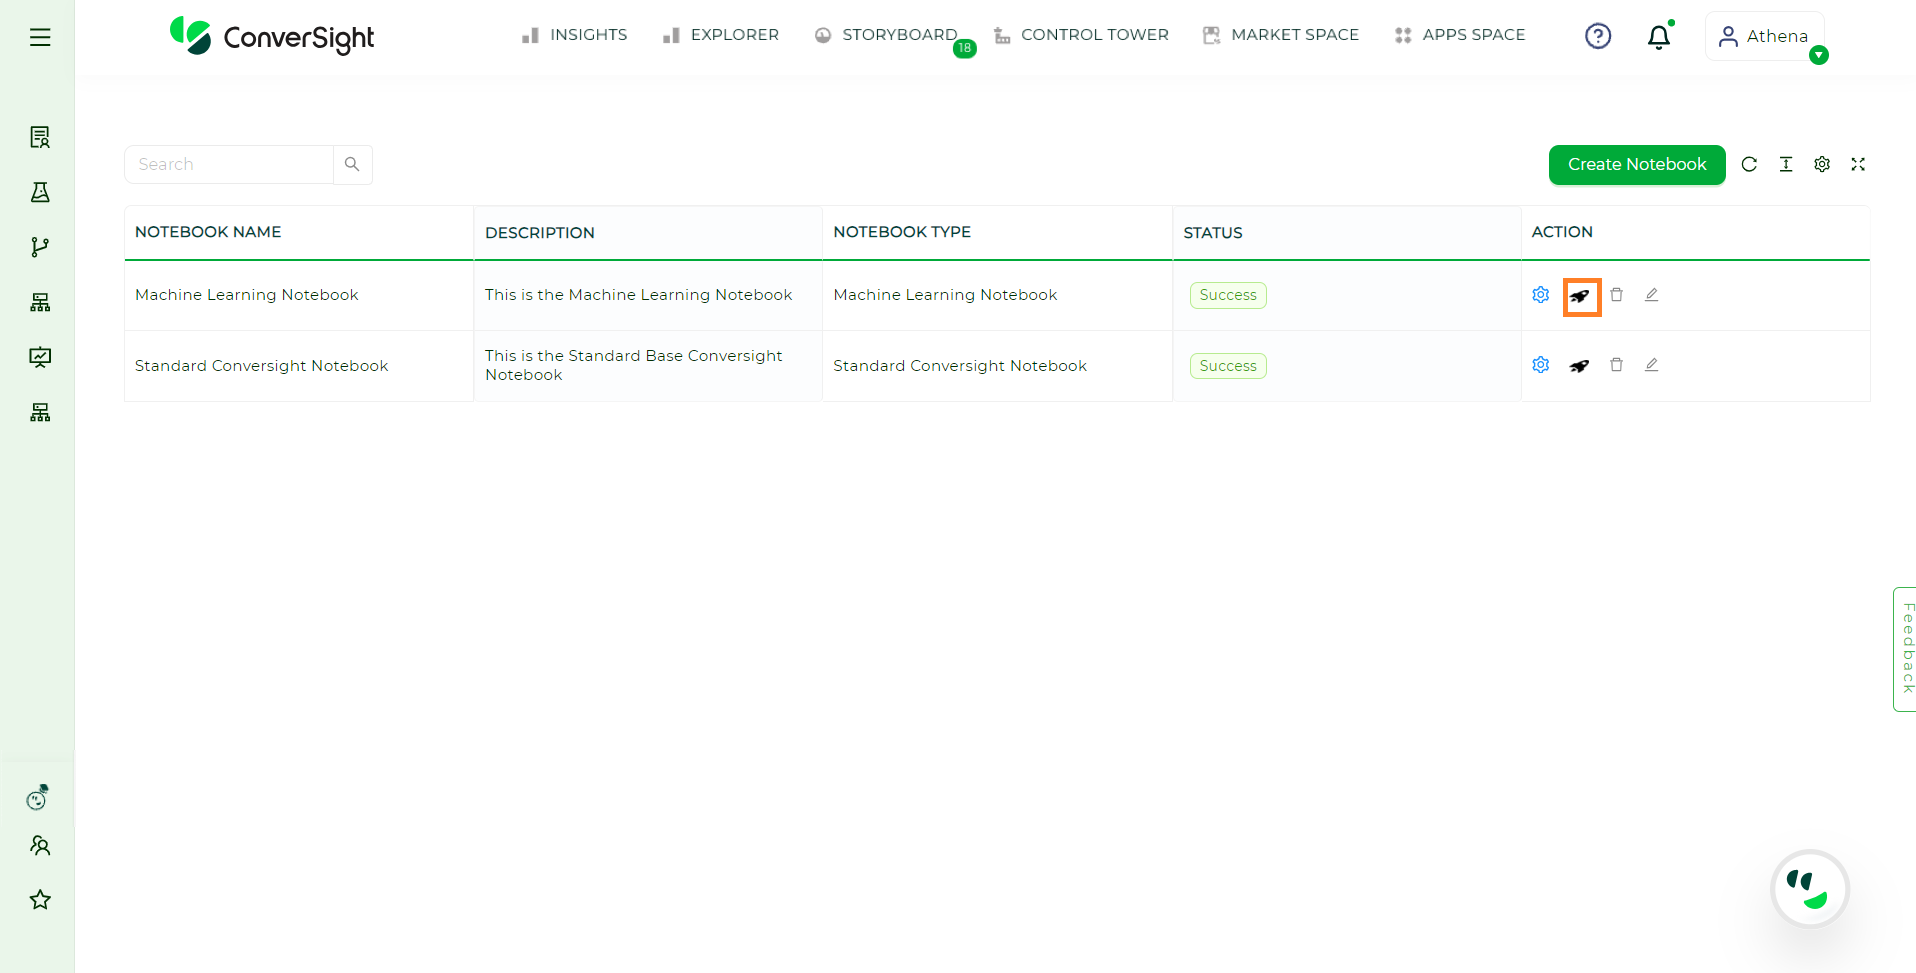
Start a Notebook#
Step 3: Choose the preferred kernel and proceed with the subsequent steps.
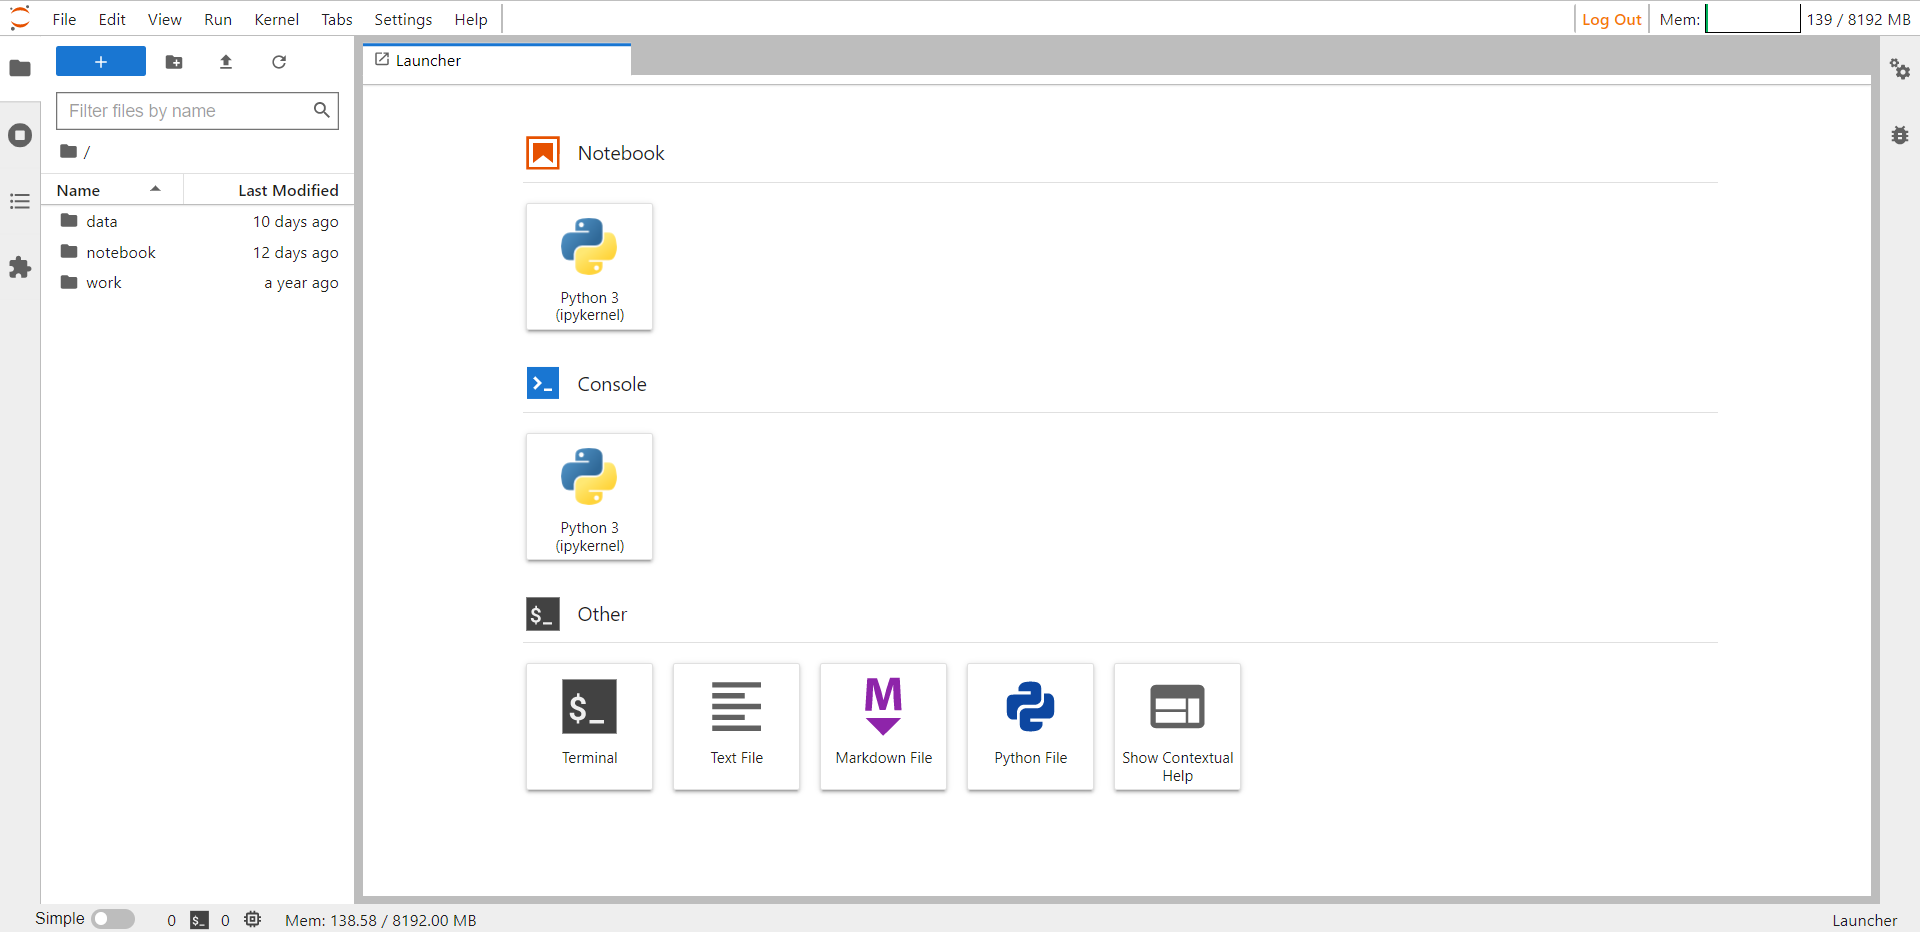
Noteboook#
Step 4: Import the necessary libraries like pandas, conversight, Dataset and Smart Analytics.
import pandas as pd
from conversight import Dataset, SmartAnalytics
#this will import the libraries.

Importing Libraries#
Step 5: Provide the DatasetID associated with the dataset you aim to load the data from.
ds - Dataset('659f9fcc-NNP80qFIi')
#this will connect your dataset.

Connecting Dataset#
Step 6: Then upload the desired document (Excel/CSV) that you intend to load into the dataset within ConverSight using the Upload Files icon.
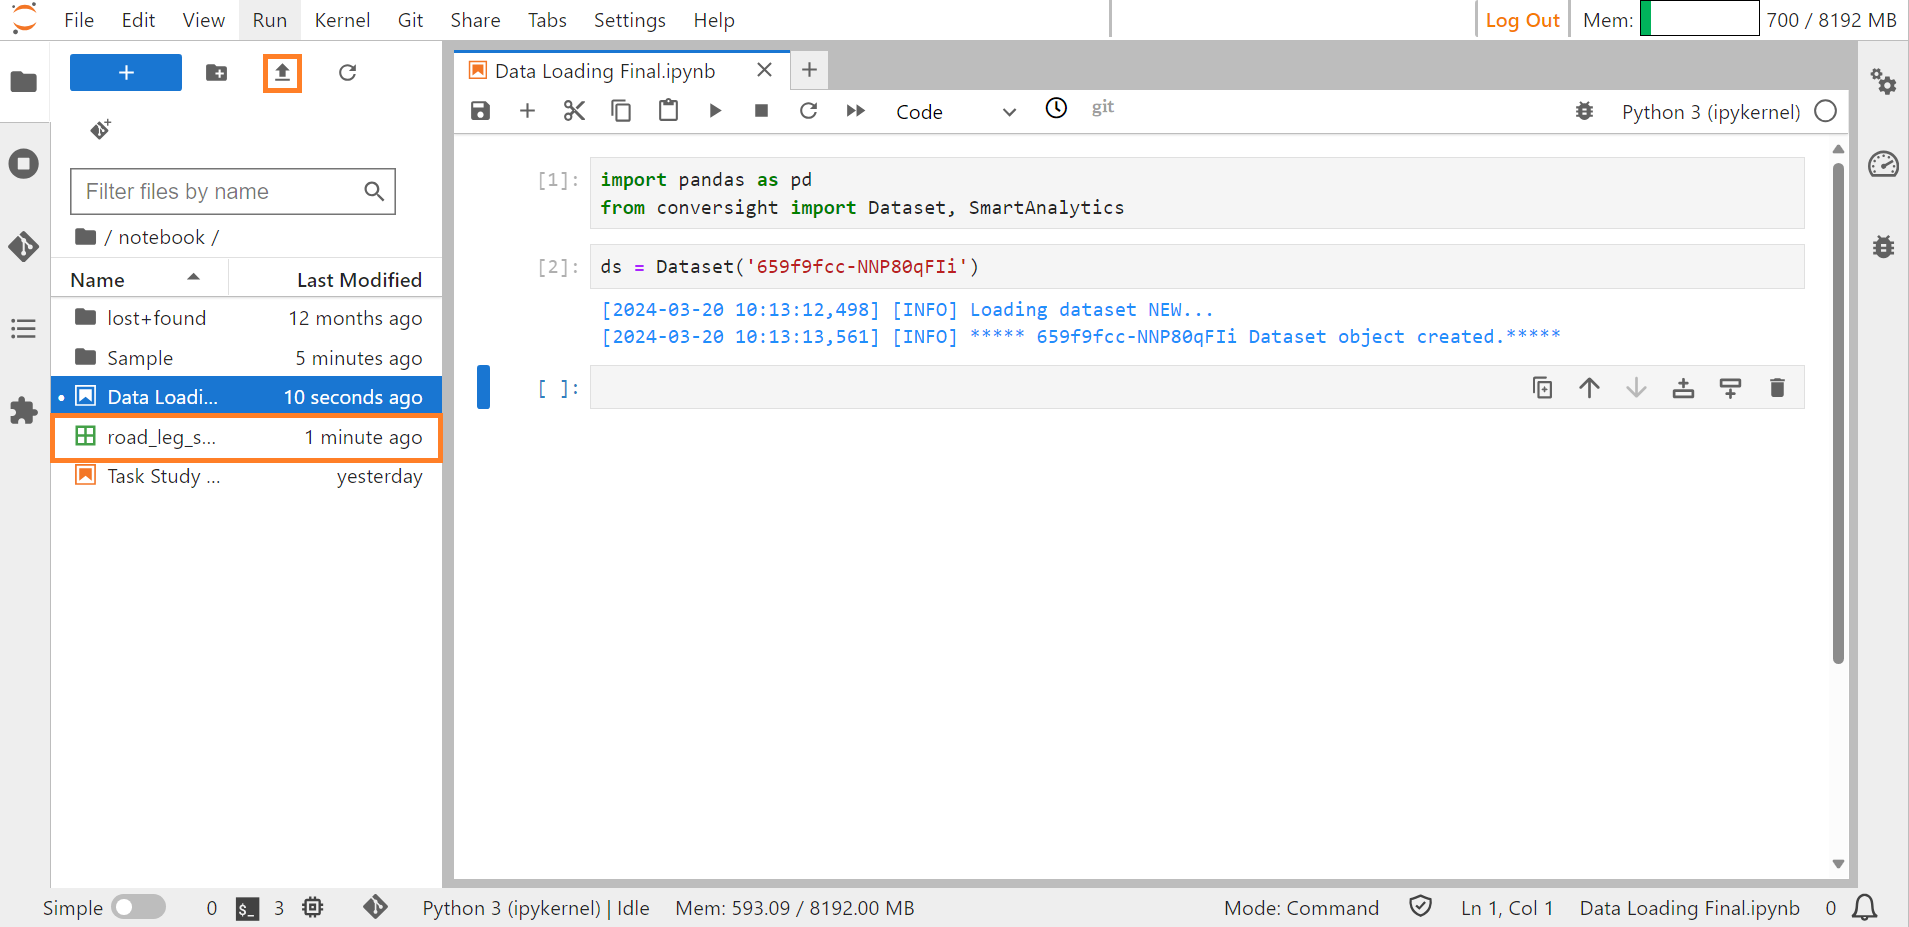
Uploading Excel/CSV file#
Step 7: Read all the data in the file using the command df=pd.read_csv(“Filename.csv”). To view all the columns of the data, use the command pd.set_option(“display.max_columns”,None).
df=pd.read_csv("road_leg_shipments_202310241150.csv")
pd.set_option("display.max_cloumns",None)
df.head()
#this will display all the data in the uploaded file.
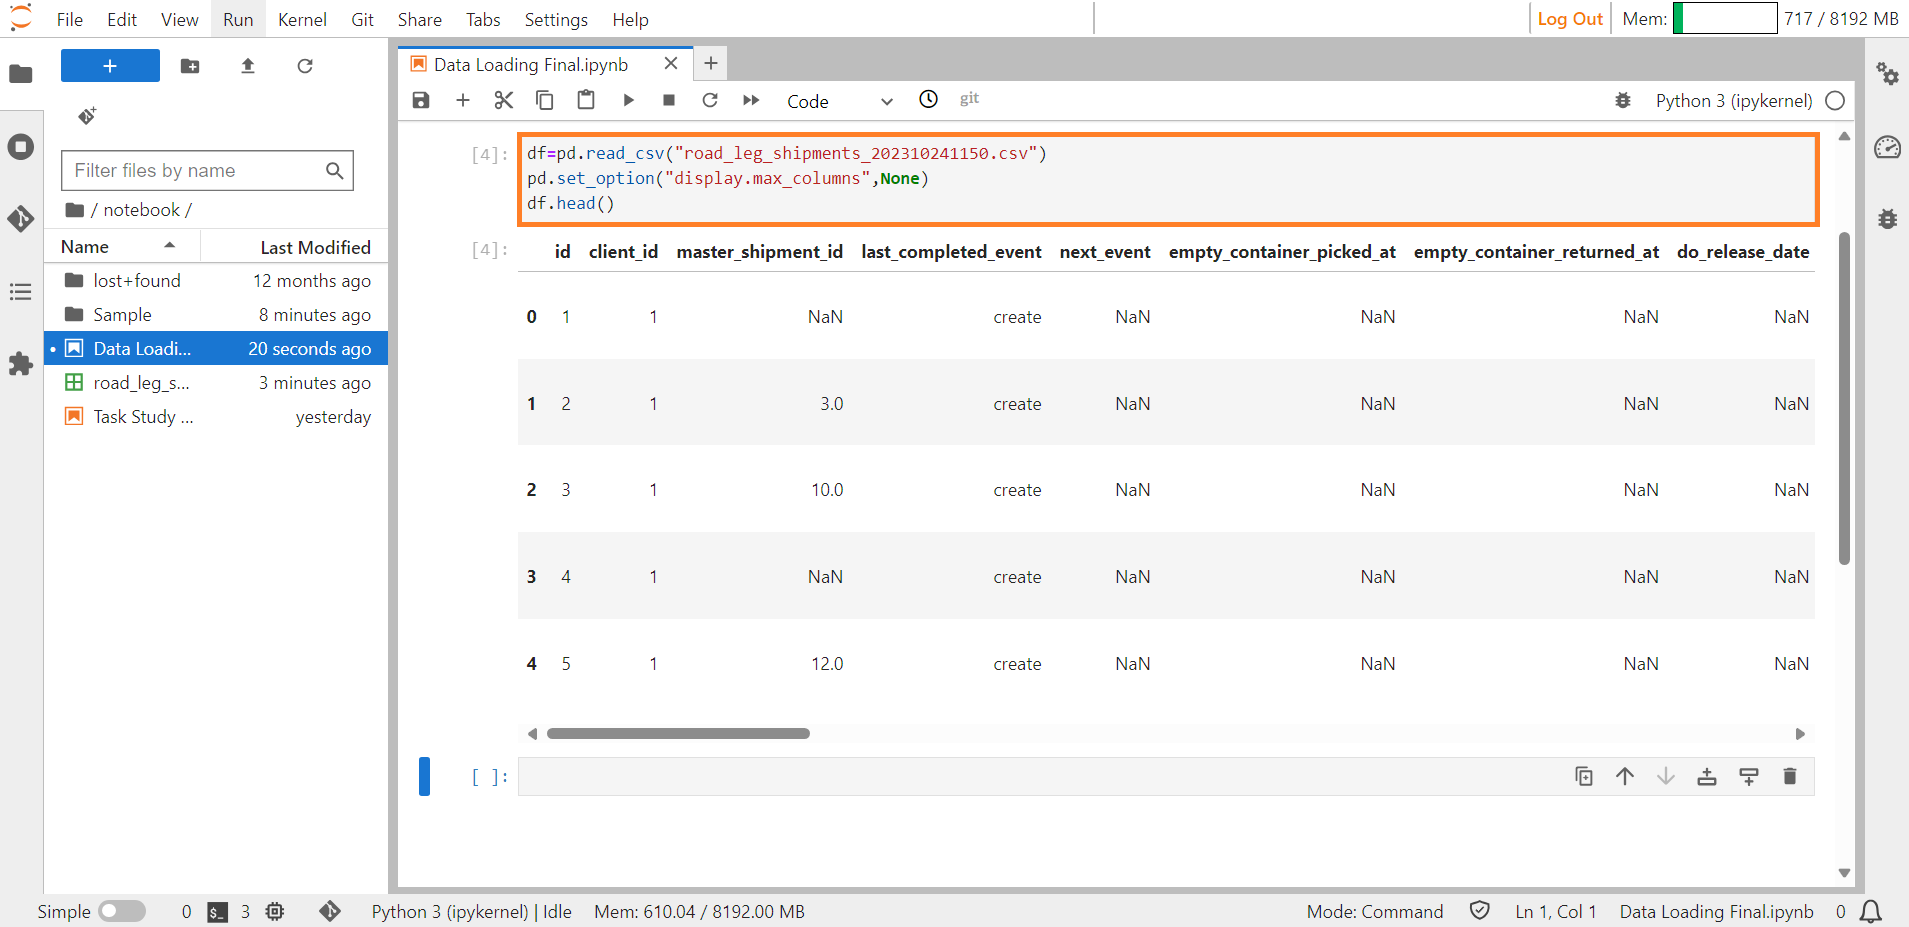
Viewing Uploaded File#
Step 8: Utilize the df[df.duplicated()] command to reveal any duplicate columns present in the file after it has been read. If there are duplicate columns in that file remove them and then proceed further.
df[df.duplicated()]
#this will display all duplicate columns.
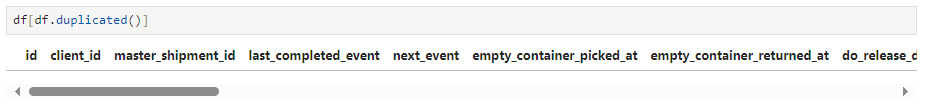
Viewing Uploaded File#
Step 9: The command df.info() in Python, specifically using pandas, is used to display a concise summary of a Data Frame.
Here is what each part does:
df: This refers to the Data Frame you are working with.
.info(): This method provides essential information about the Data Frame, including:
The data types of each column.
The number of non-null (non-missing) values in each column.
The memory usage of the Data Frame.
The output will give you a quick overview of the structure and content of your Data Frame, helping you understand the types of data it contains and identify any missing values.
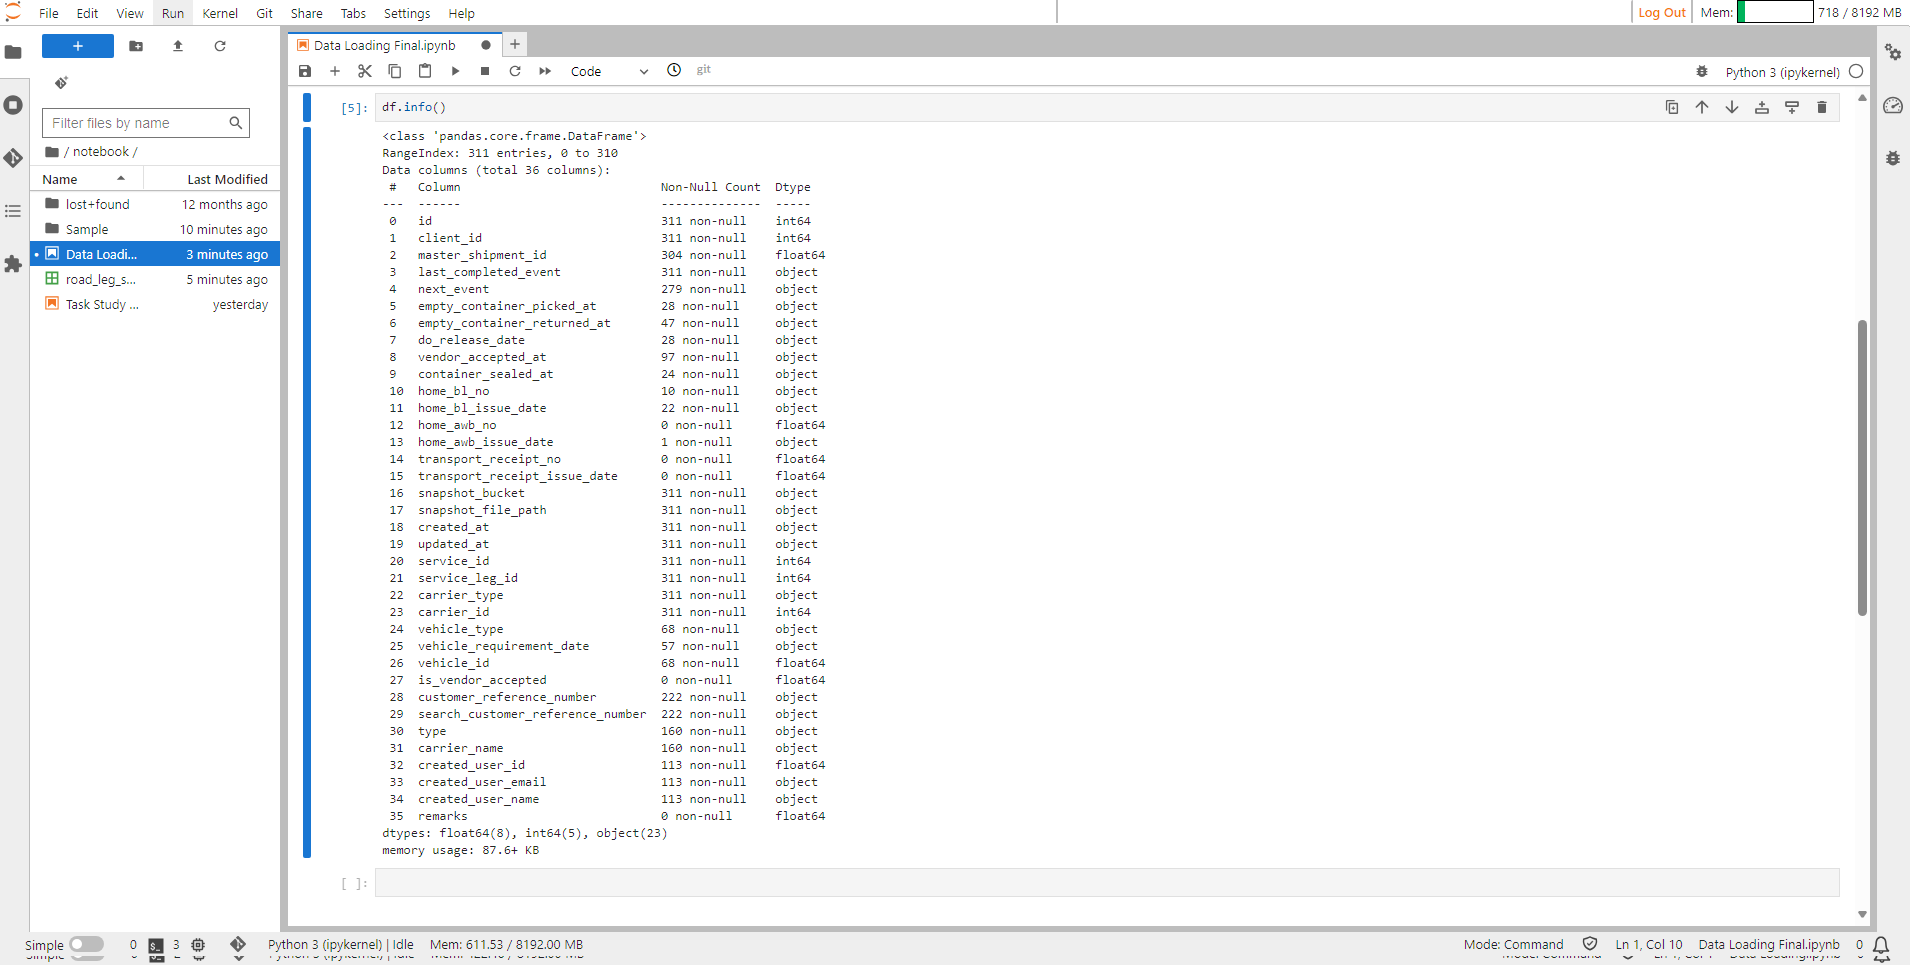
Viewing Datatypes#
Step 10: In ConverSight there are four categories of columns they are dimensions, metrics, date, flag.
Dimensions – All columns in the dimension category must be of the datatype str or object.
Metrics – All columns in the metrics category must be of the datatype int or float.
Date – All columns in the date category must be of the datatype datetime.
Flag – All columns in the flag category must be of datatype binary or boolean.
Step 11: Modify the data types in a way using the astype command that aligns with the four categories in ConverSight. Subsequently, verify these changes by employing the ds.info() command.
df['id'] = df['id'].astype(str)
df['client_id'] = df['client_id'].astype(str)
df['master_shipment_id'] = df['master_shipment_id'].astype(str).str.rstrip('.0')
df['transport_receipt_no'] = df['transport_receipt_no'].astype(str)
df['carrier_id'] = df['carrier_id'].astype(str)
df['service_id'] = df['service_id'].astype(str)
df['created_user_name'] = df['created_user_name'].astype(str)
df['service_leg_id'] = df['service_leg_id'].astype(str)
df['customer_reference_number'] = df['customer_reference_number'].astype(str)
df['search_customer_reference_number'] = df['search_customer_reference_number'].astype(str)
df['vehicle_id'] = df['vehicle_id'].astype(str)
df['snapshot_file_path'] = df['snapshot_file_path'].astype(str)
df['last_completed_event'] = df['last_completed_event'].astype(str)
df['carrier_type'] = df['carrier_type'].astype(str)
df['next_event'] = df['next_event'].astype(str)
df['home_bl_no'] = df['home_bl_no'].astype(str)
df['home_awb_no'] = df['home_awb_no'].astype(str)
df['snapshot_bucket'] = df['snapshot_bucket'].astype(str)
df['is_vendor_accepted'] = df['is_vendor_accepted'].astype(str)
df['type'] = df['type'].astype(str)
df['vehicle_type'] = df['vehicle_type'].astype(str)
df['carrier_name'] = df['carrier_name'].astype(str)
df['created_user_email'] = df['created_user_email'].astype(str)
df['created_user_name'] = df['created_user_name'].astype(str)
df['remarks'] = df['remarks'].astype(str)
#this will modify all datatypes of the columns.
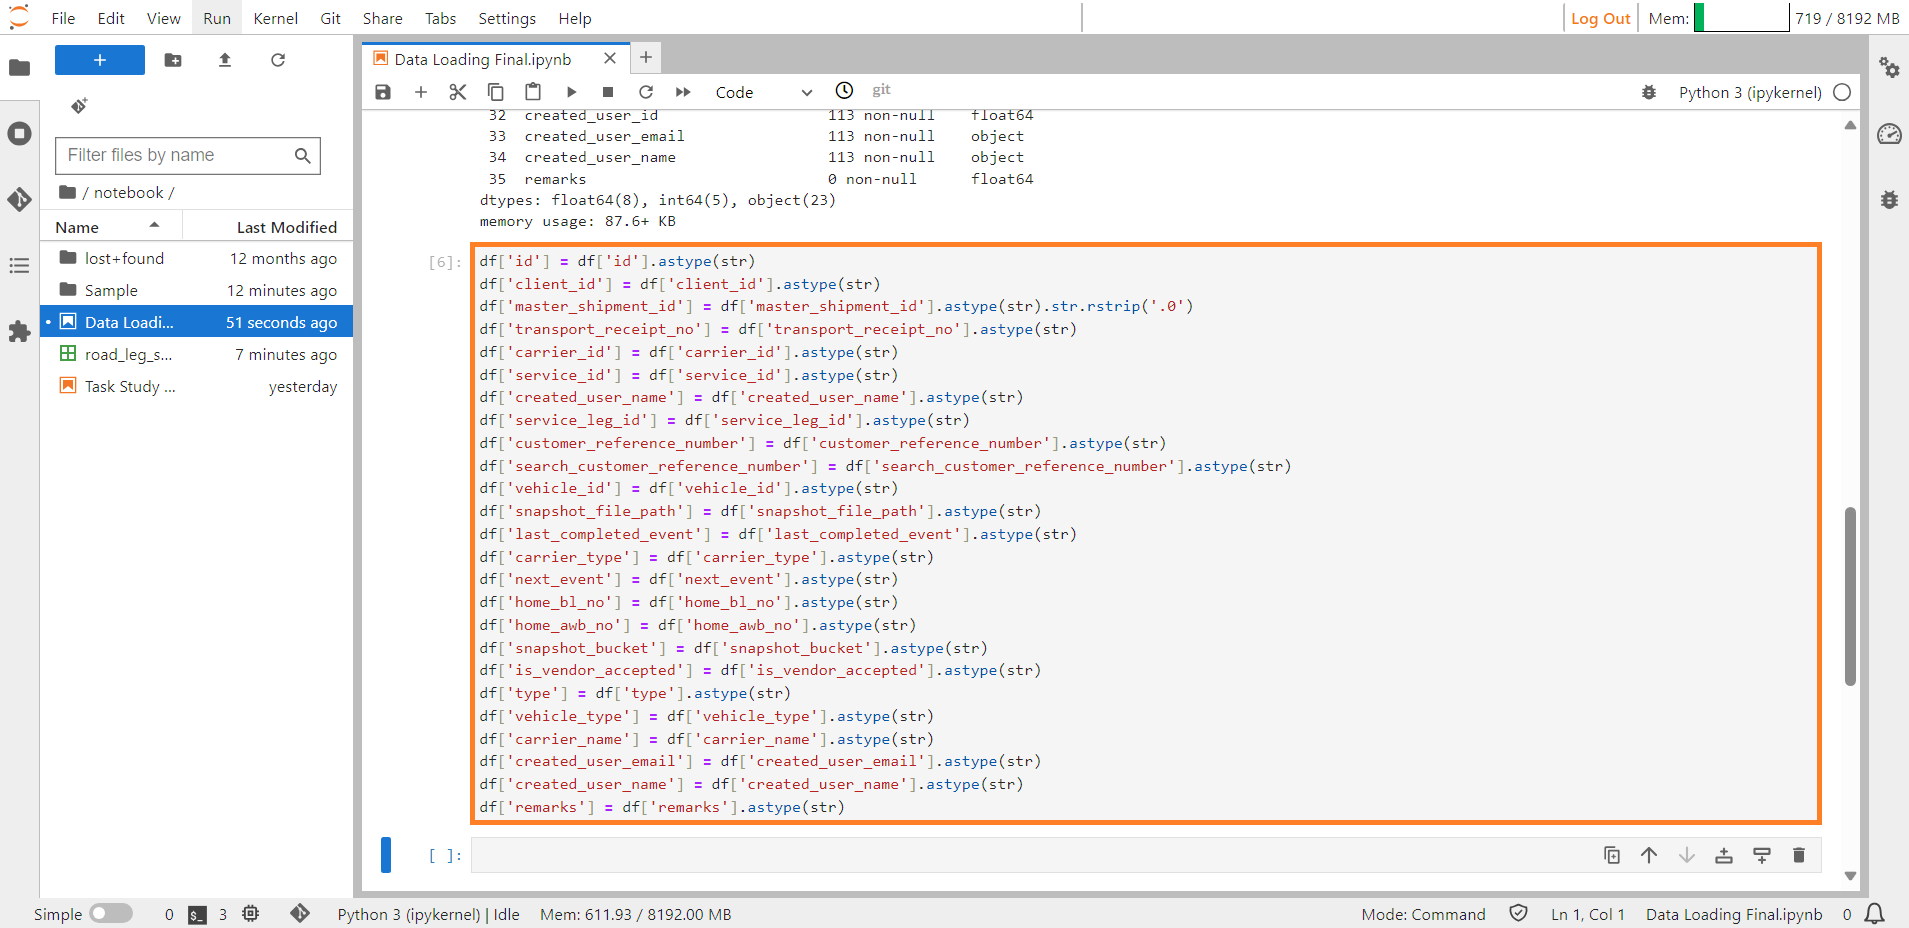
Modifying Datatypes#
Viewing Modified Datatypes#
Step 12: Use the following code snippet to fill null values in the Excel/CSV file.
import numpy as np
#code to fill null values
for col in df.columns:
    if df[col].dtype == 'object':  # Check if the column is of string type
        df[col].fillna("", inplace=True)
        df[col]=df[col].astype(str).str.replace('nan', '')
    elif df[col].dtype == 'float64':  # Check if the column is of float type
        df[col].fillna(0.0, inplace=True)
        df[col].replace(np.NaN, 0.0, inplace=True)
    elif df[col].dtype == 'int64':  # Check if the column is of integer type
        df[col].fillna(0, inplace=True)
        df[col].replace(np.NaN, 0, inplace=True)
#this will fill null values.
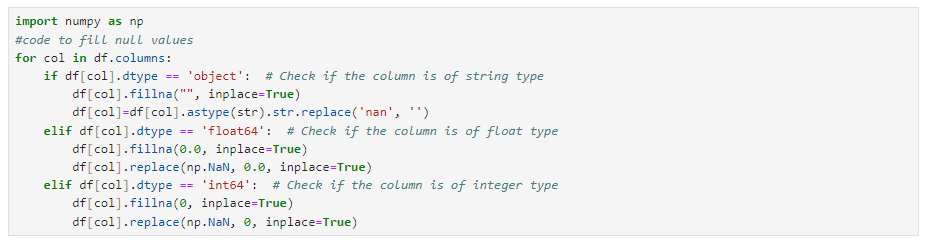
Filling null values.#
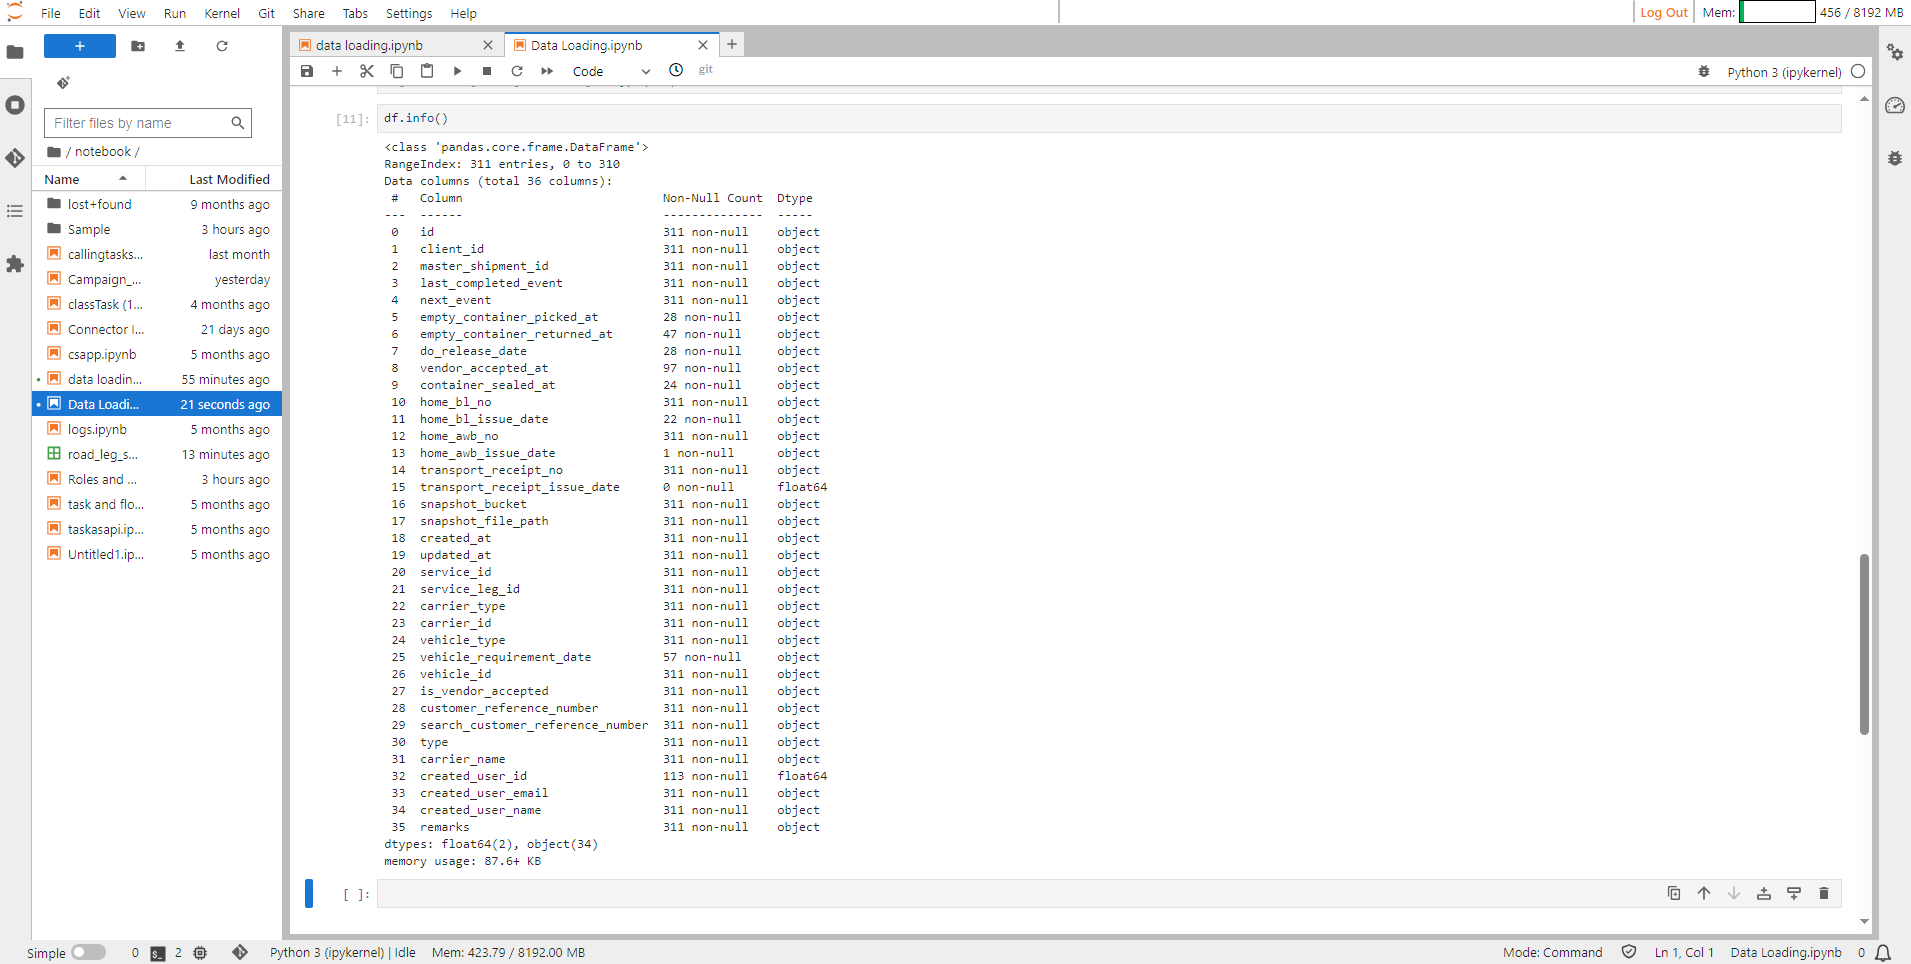
Step 13: Check the datatypes of all the columns using the df.dtypes command.

Viewing Modified Datatypes#
Step 14: Once you have finished the preceding steps, you can employ Smart Analytics to upload the data into ConverSight. When you press on the Tab button all the available functions will be displayed.
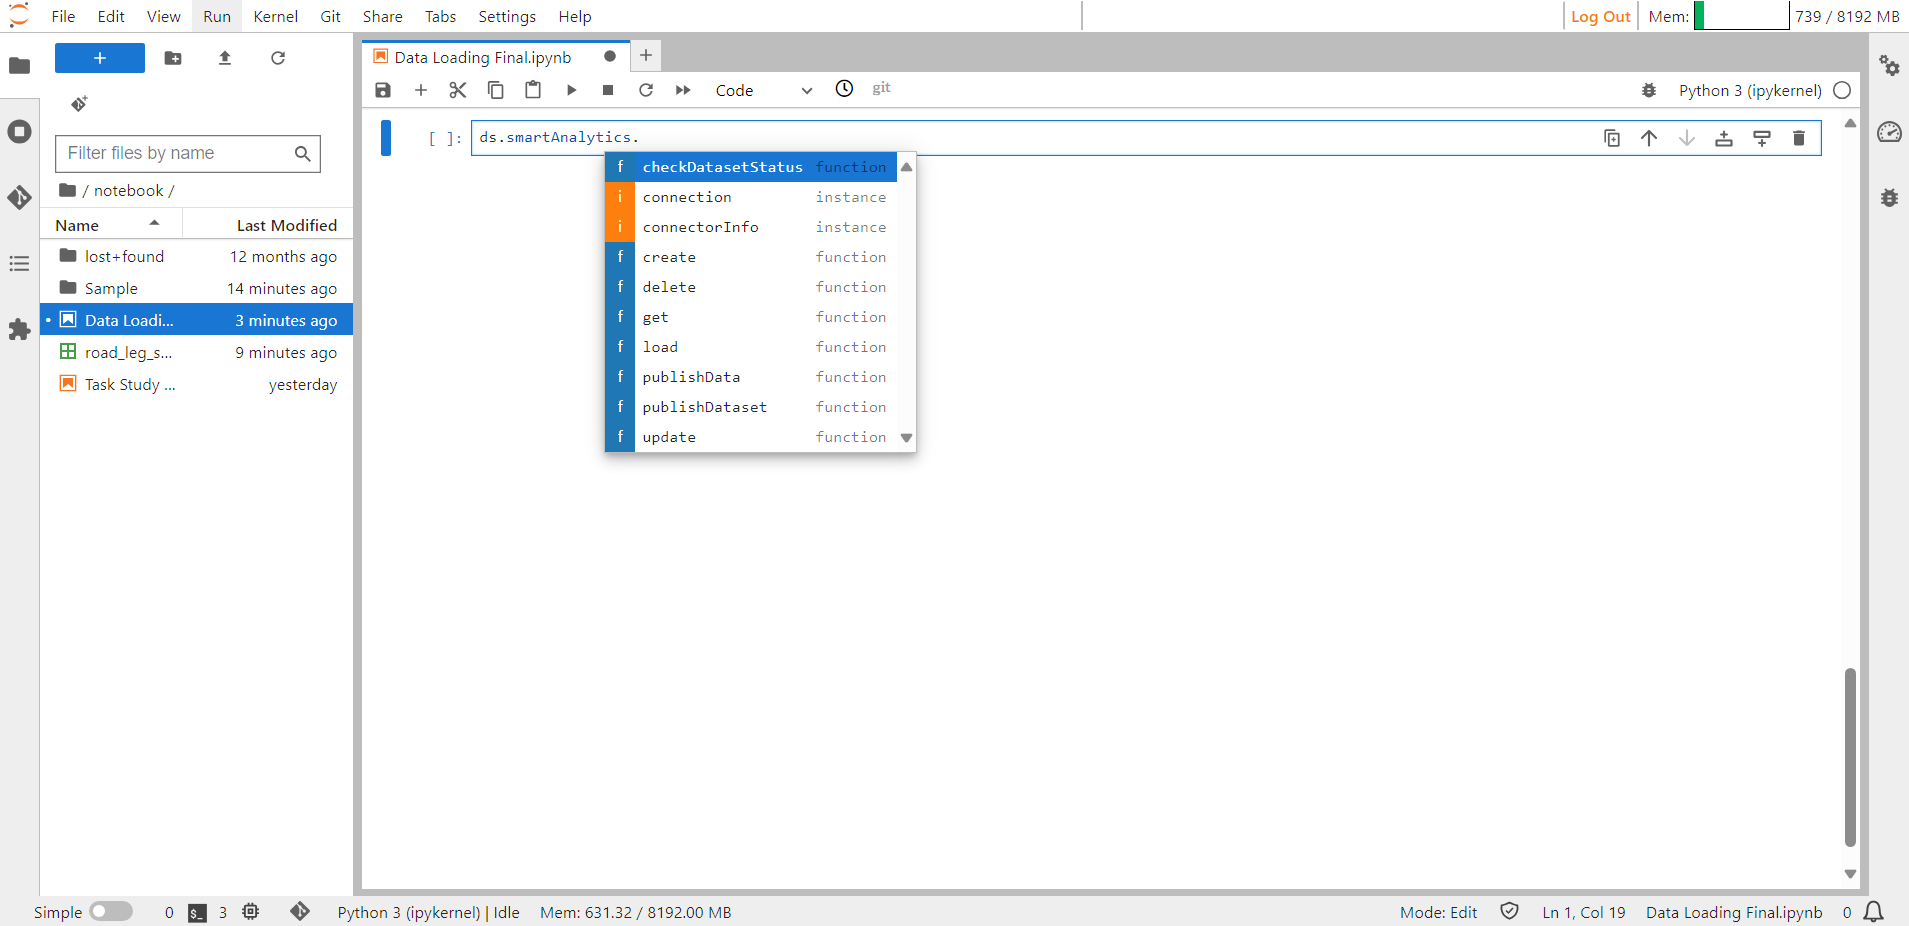
Smart Analytics Help Guide#
Creating Smart Analytics#
The Create method is utilized for generating a new Smart Analytics. Additionally, it has the capability to update an already existing table. When the isOverwrite parameter is configured as True, the method will overwrite an existing table by truncating the current data. Conversely, if isOverwrite is set to False the method will append the new data to the existing data.
Shift + Tab shows details about the input arguments required to create Smart Analytics.
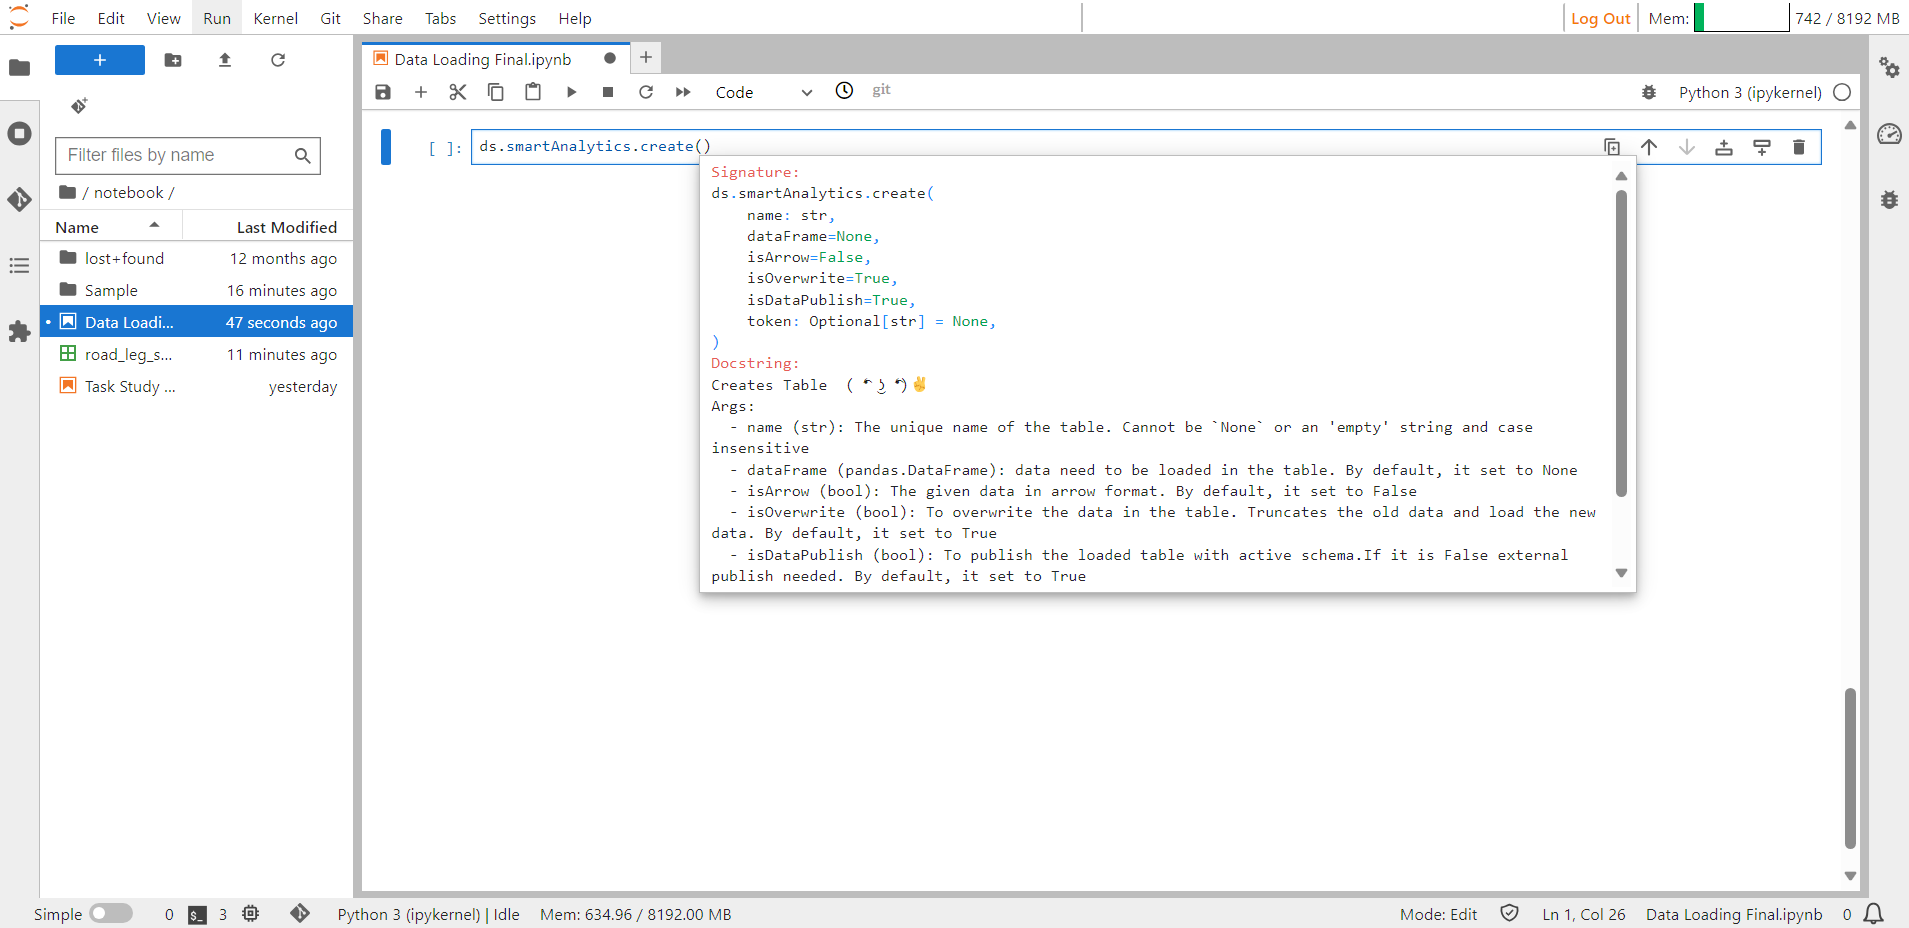
Smart Analytics Help Guide#
Syntax:
ds.smartAnalytics.create(name= "road_leg_shipments", dataFrame = df, isArrow = False, isOverwrite = True,isDataPublish = True)
#this will create Smart Analytics.
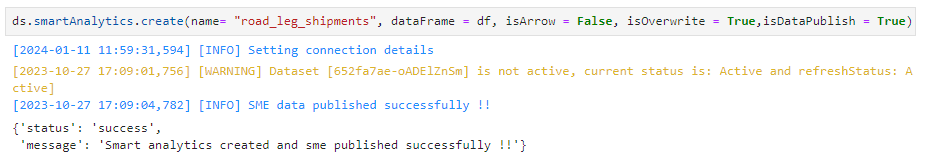
Smart Analytics Created#
Updating Smart Analytics#
The update method is used to modify an existing Smart Analytics. If the isOverwrite parameter is set to True, it will overwrite the existing table by truncating the current data. Otherwise, it will append the new data to the existing table. The required arguments for updating a Smart Analytics are provided below.
Syntax:
ds.smartAnalytics.update(name= "road_leg_shipments", dataFrame = df, isArrow = False, isOverwrite = True,isDataPublish = True)
#this will update Smart Analytics.
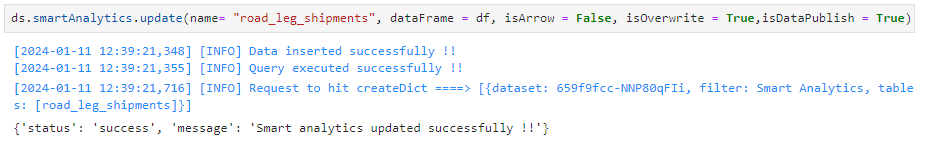
Smart Analytics Updated#
Publish Dataset#
The publishDataset method is utilized to publish the Smart Analytics. The argument for the publishDataset method is used to determine the action to be taken. By default, it is set to update, which updates the dictionary for the specified tables. To publish newly created tables, use create as the argument. The object arguments are used to either publish the specified objects or update the dictionary for the given objects.
When creating or updating the Smart Analytics using the create and update methods, if the isDataPublish argument is set to True, the Smart Analytics will be created or updated accordingly and the changes will be reflected in SME Coaching (Subject Matter Expert) automatically. However, if isDataPublish is set to False the created or updated Smart Analytics will be saved in temporary data and will not be reflected in SME unless it is explicitly published using the publishDataset method.
Deleting Smart Analytics#
The delete method is used to delete Smart Analytics. It takes the name of Smart Analytics as an argument. The isDataPublish parameter is used to determine the type of deletion. If set to False, the raw table will be deleted. If set to True (default), the schema table will be deleted. Deleting the raw data allows for reusing the tables with the existing schema. However, deleting the schema will completely remove the table.
Syntax:
ds.smartAnalytics.delete("road_leg_shipments")
#this will delete the Smart Analytics.
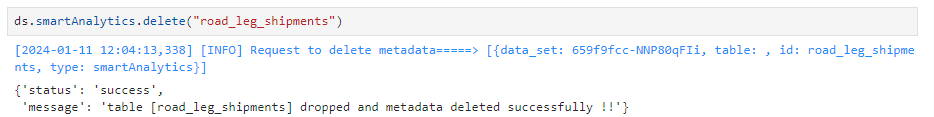
Smart Analytics Deleted#