Supply Planning in ConverSight helps businesses convert demand forecasts into actionable supply decisions, ensuring the right products are available at the right time. It provides a unified space to plan inventory, manage replenishment, and align supply with expected demand.It works by using forecasted demand along with factors like item priority and demand patterns to determine what to replenish, when, and in what quantity. Users can review system recommendations, apply adjustments such as safety stock, and refine plans based on business needs before finalizing them.
This documentation walks you through each section of the application, helping you confidently create, review and manage supply plans that support efficient and reliable operations.
Glossary
Term
Description
Purchase Order (PO)
A finalized order created to procure items from a supplier
Lead Time
The time taken for an item to be delivered after placing an order
Safety Stock
Buffer inventory maintained to handle demand variability and avoid stockouts
MOQ (Minimum Order Quantity)
The minimum quantity that must be ordered from a supplier
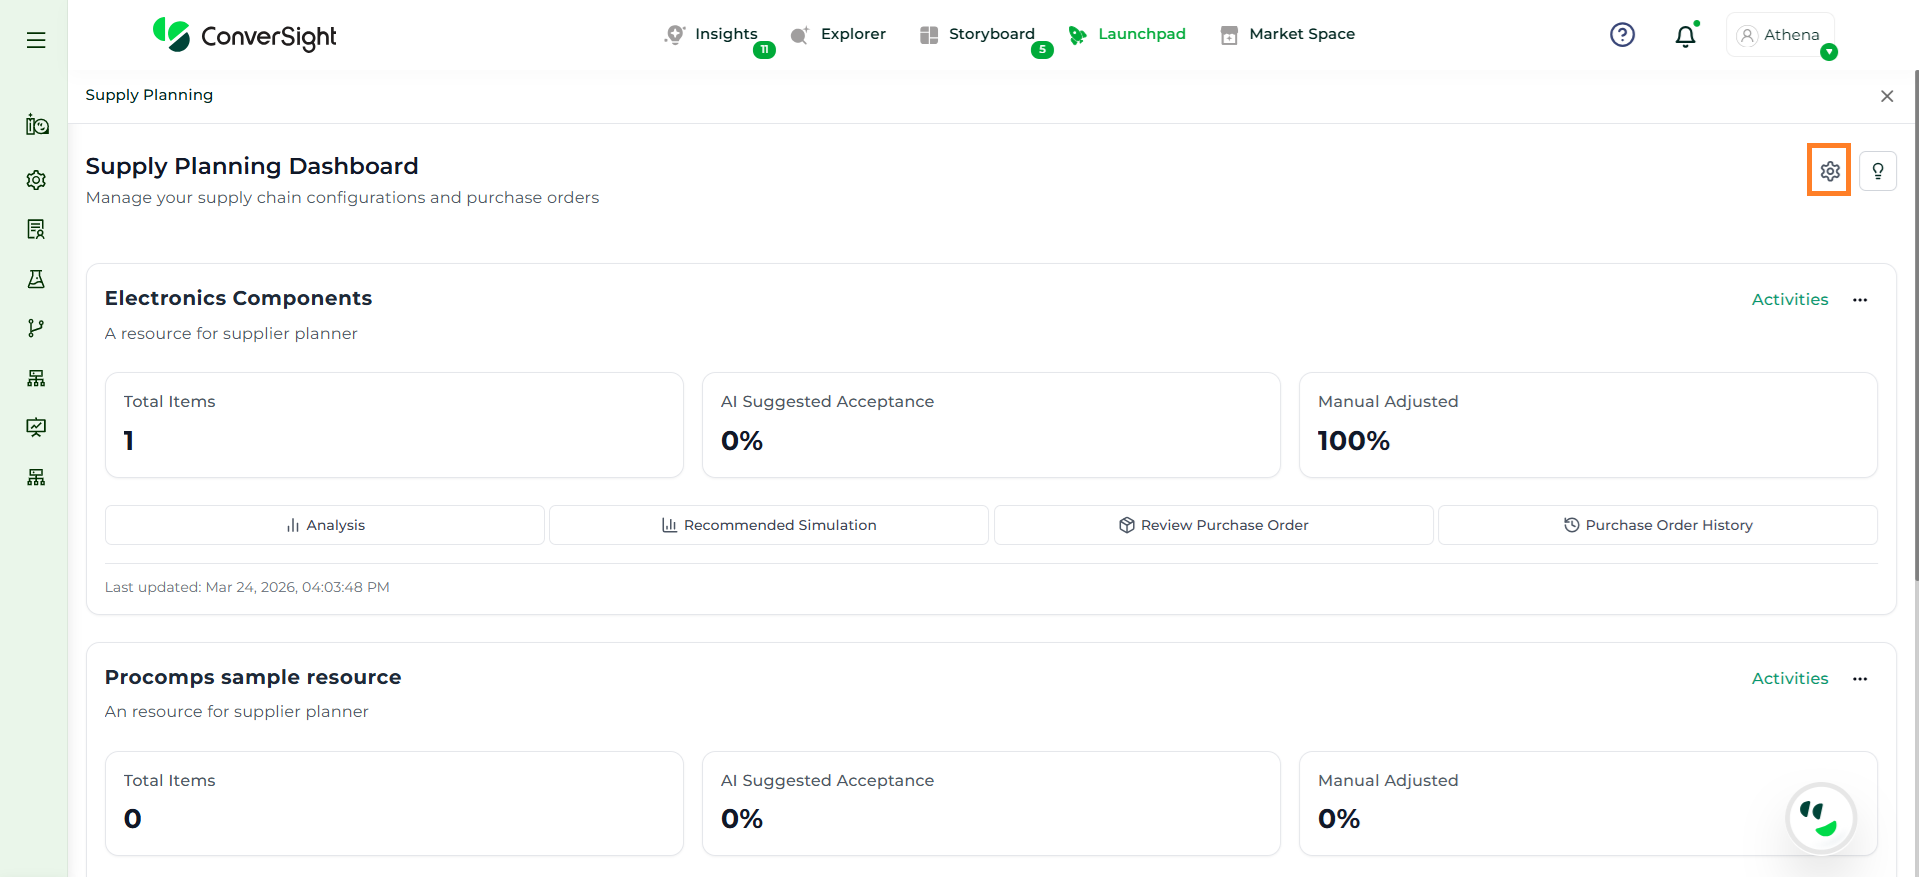
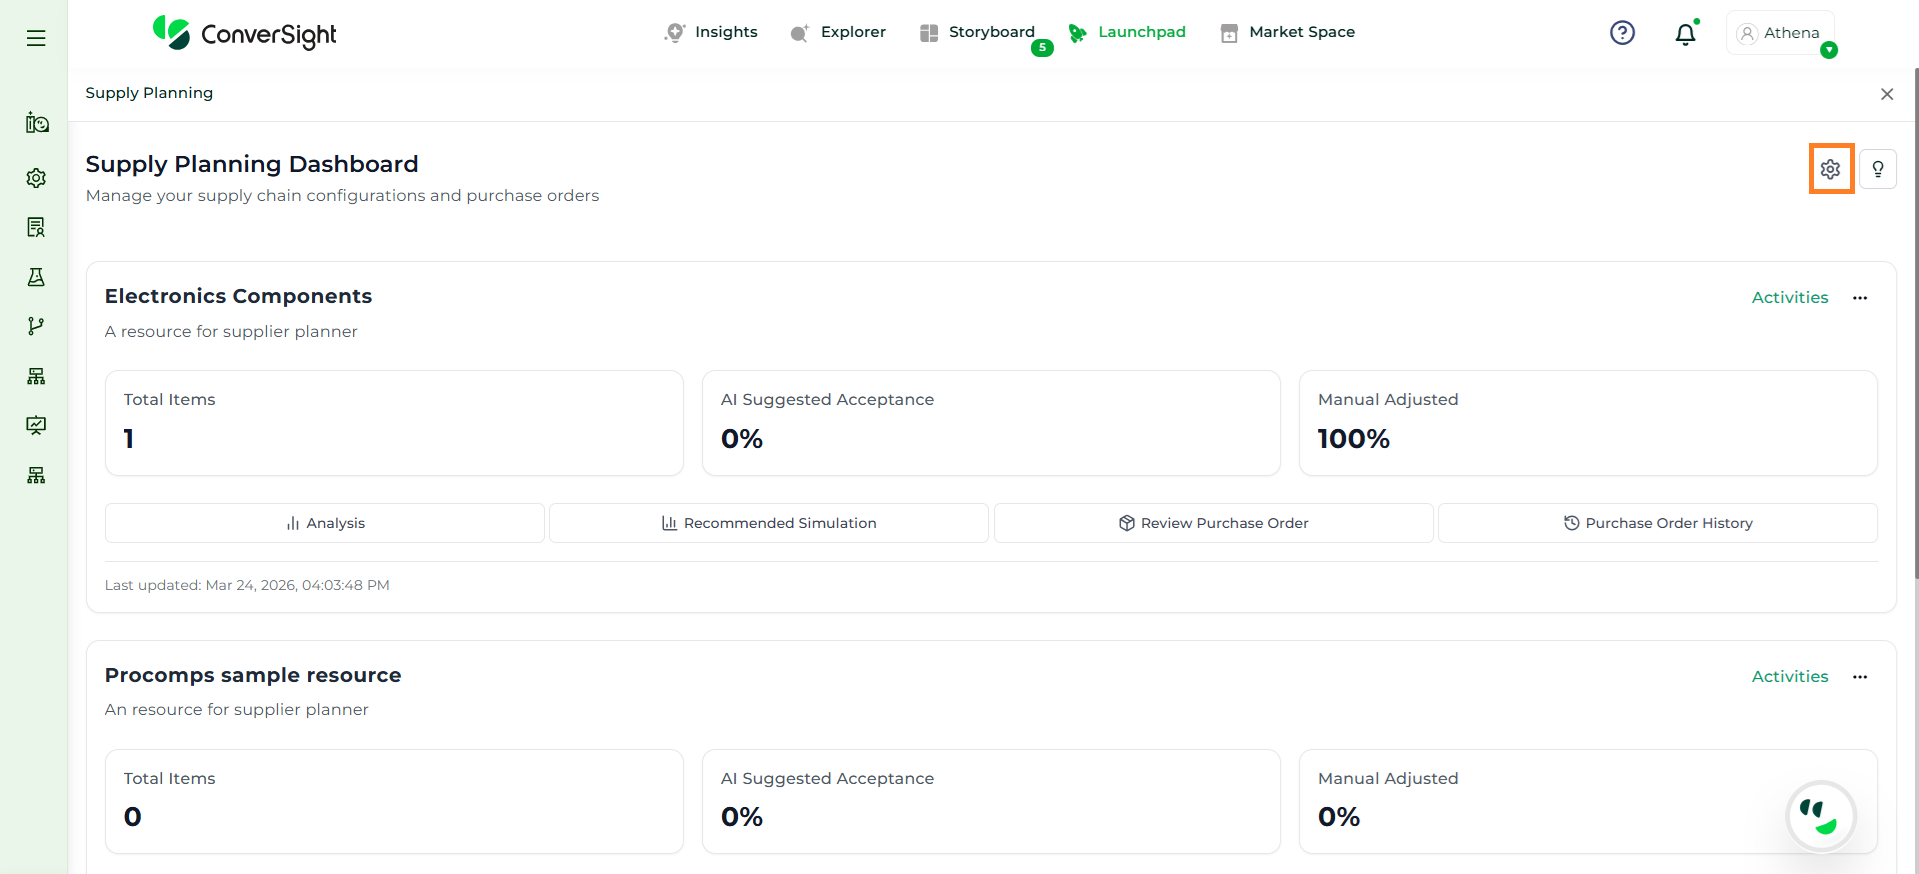
Before proceeding with the planning workflow, it is important to configure the application through the Settings section. These configurations define how the system behaves, how data is processed and how recommendations are generated. Proper setup ensures accurate analysis, reliable simulations and effective decision-making across the planning process.
The Settings section allows users to configure the Supply Planning application by defining key inputs and system behaviors required for planning.
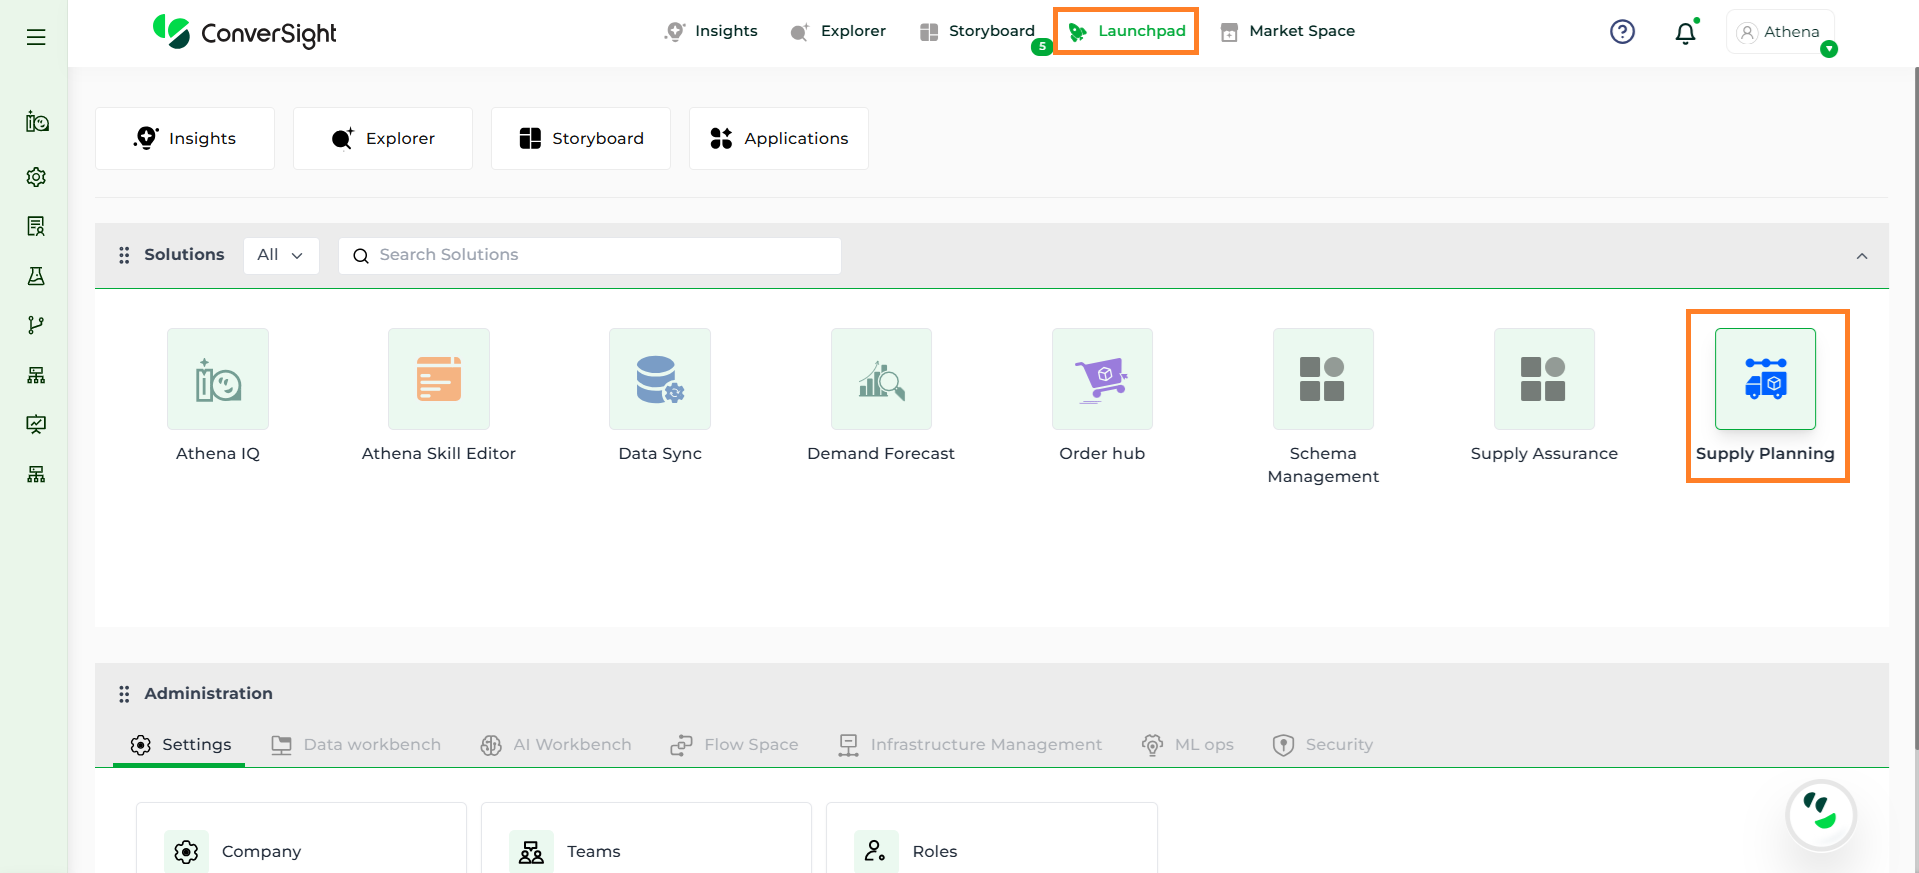
To access, click on the Settings option within the Supply Planning application. This will open all the configuration sections required to set up the planner.
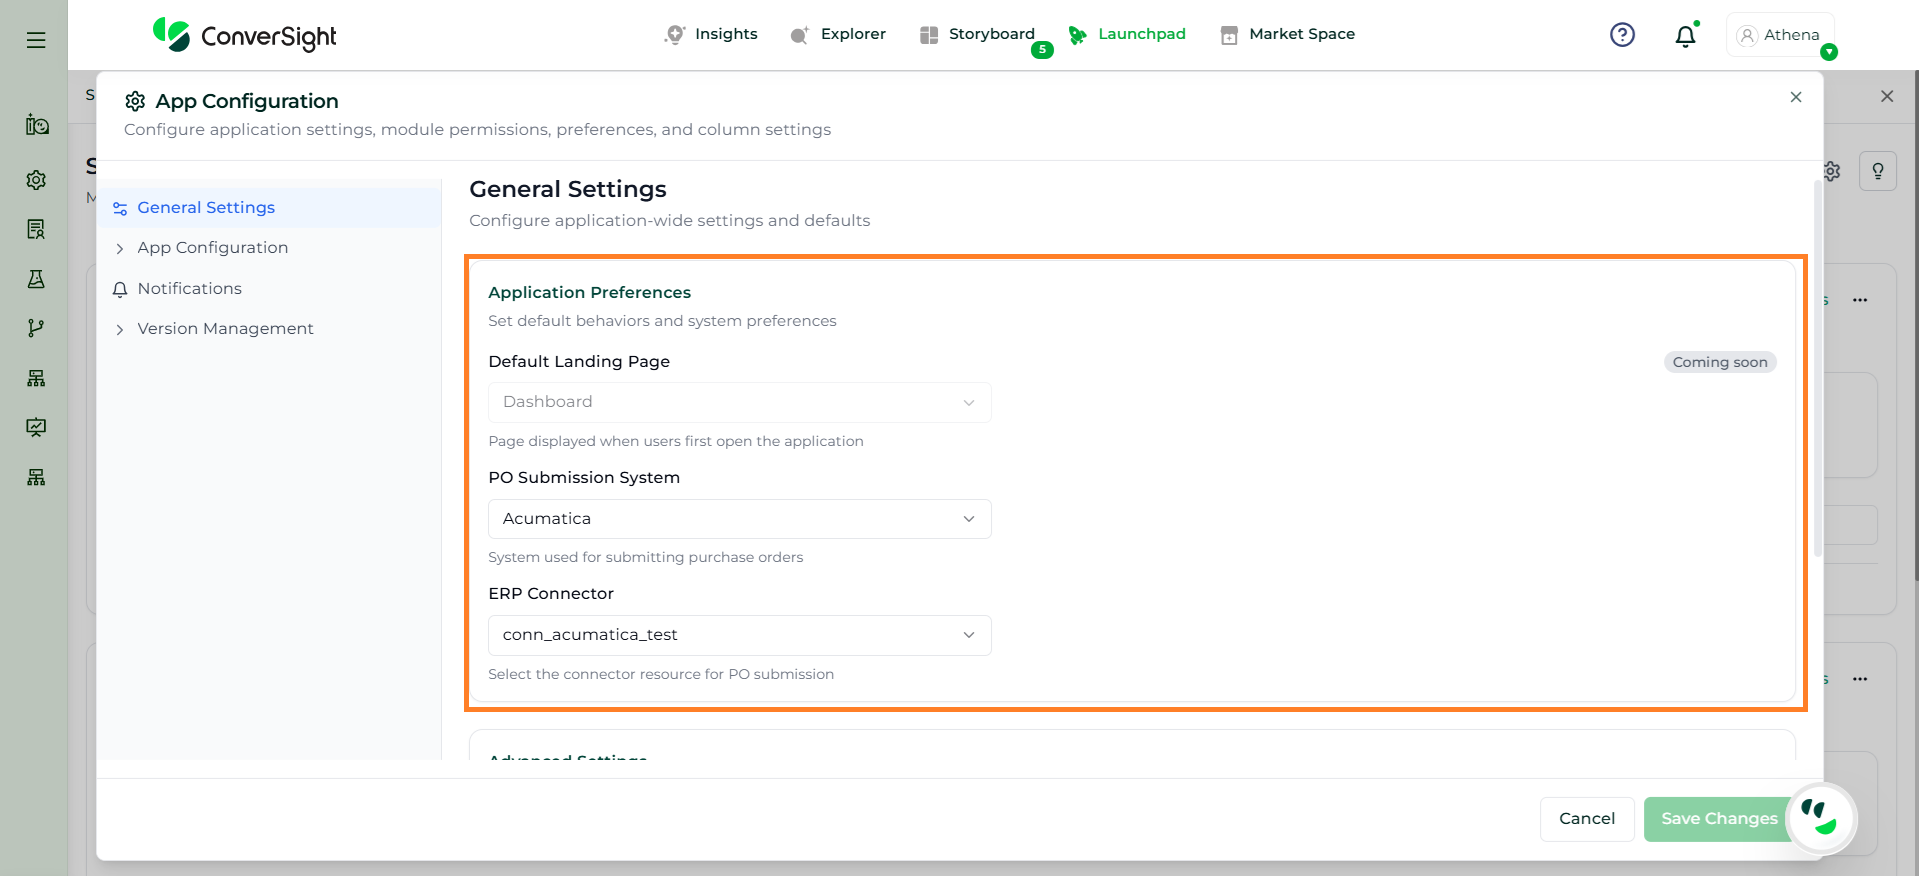
The Application Preferences section is used to define the default behavior of the application.
Default Landing Page: The Default Landing Page displays the page that users will see when they open the Supply Planning application. This option is currently Coming Soon.
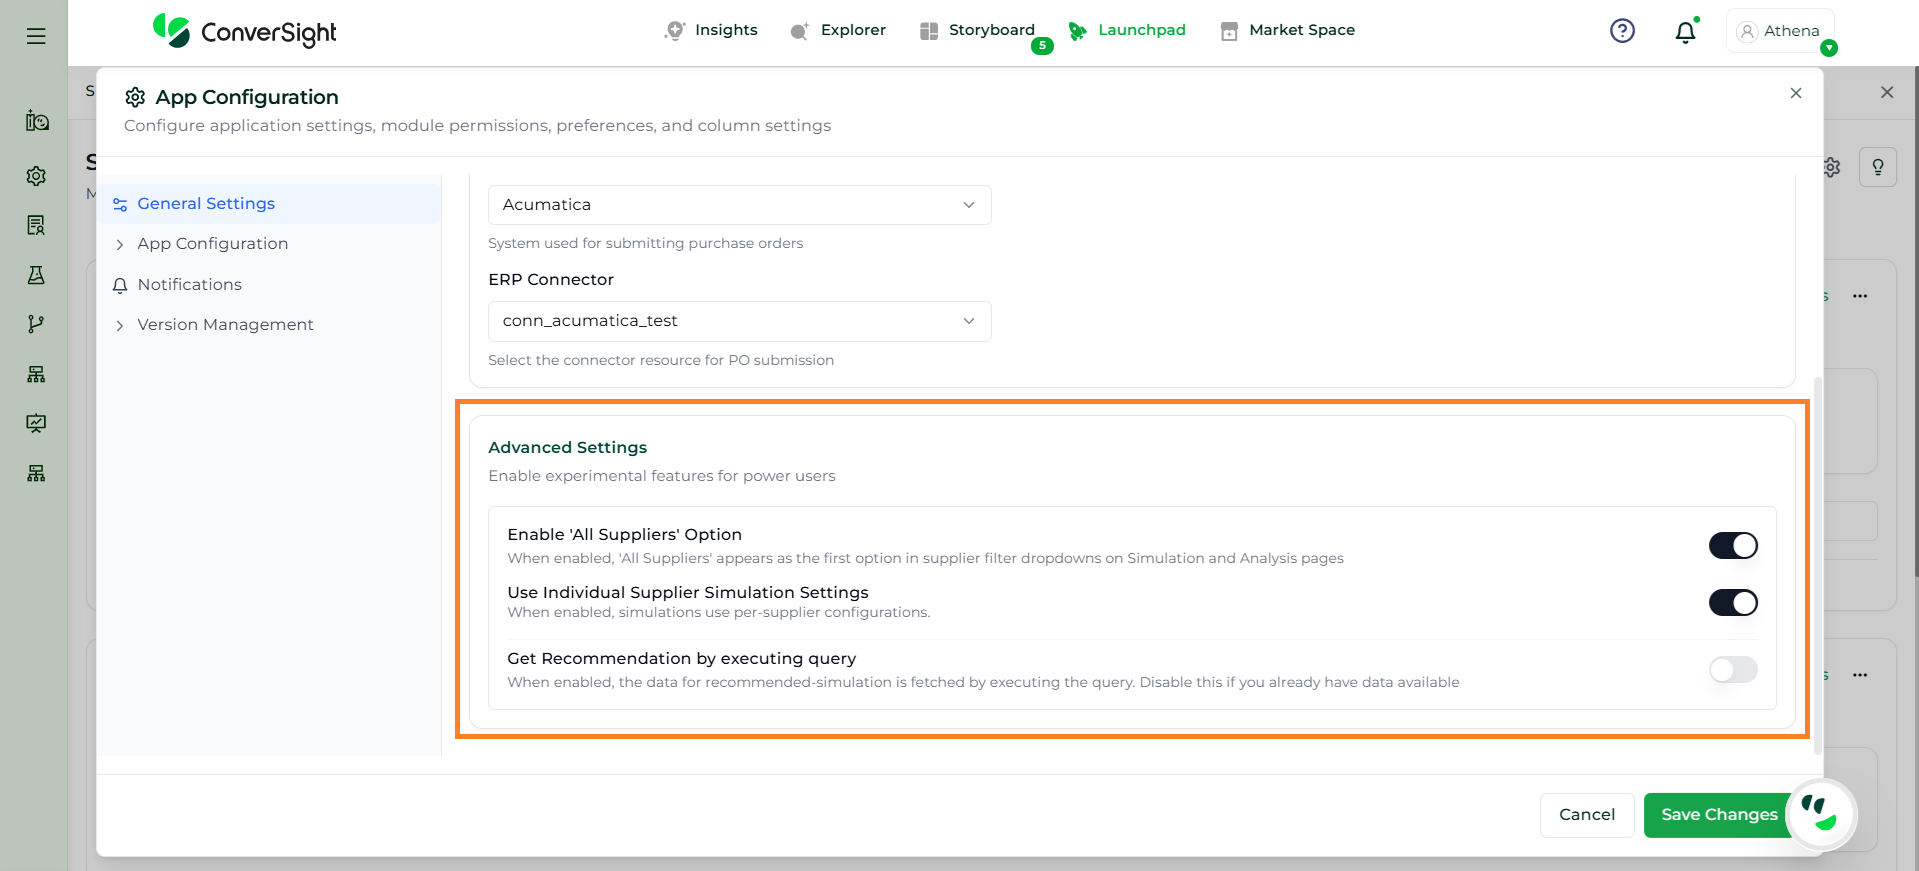
PO Submission System: The PO Submission System allows users to select the ERP system through which purchase orders will be submitted. This should be configured based on the organization’s ERP system.
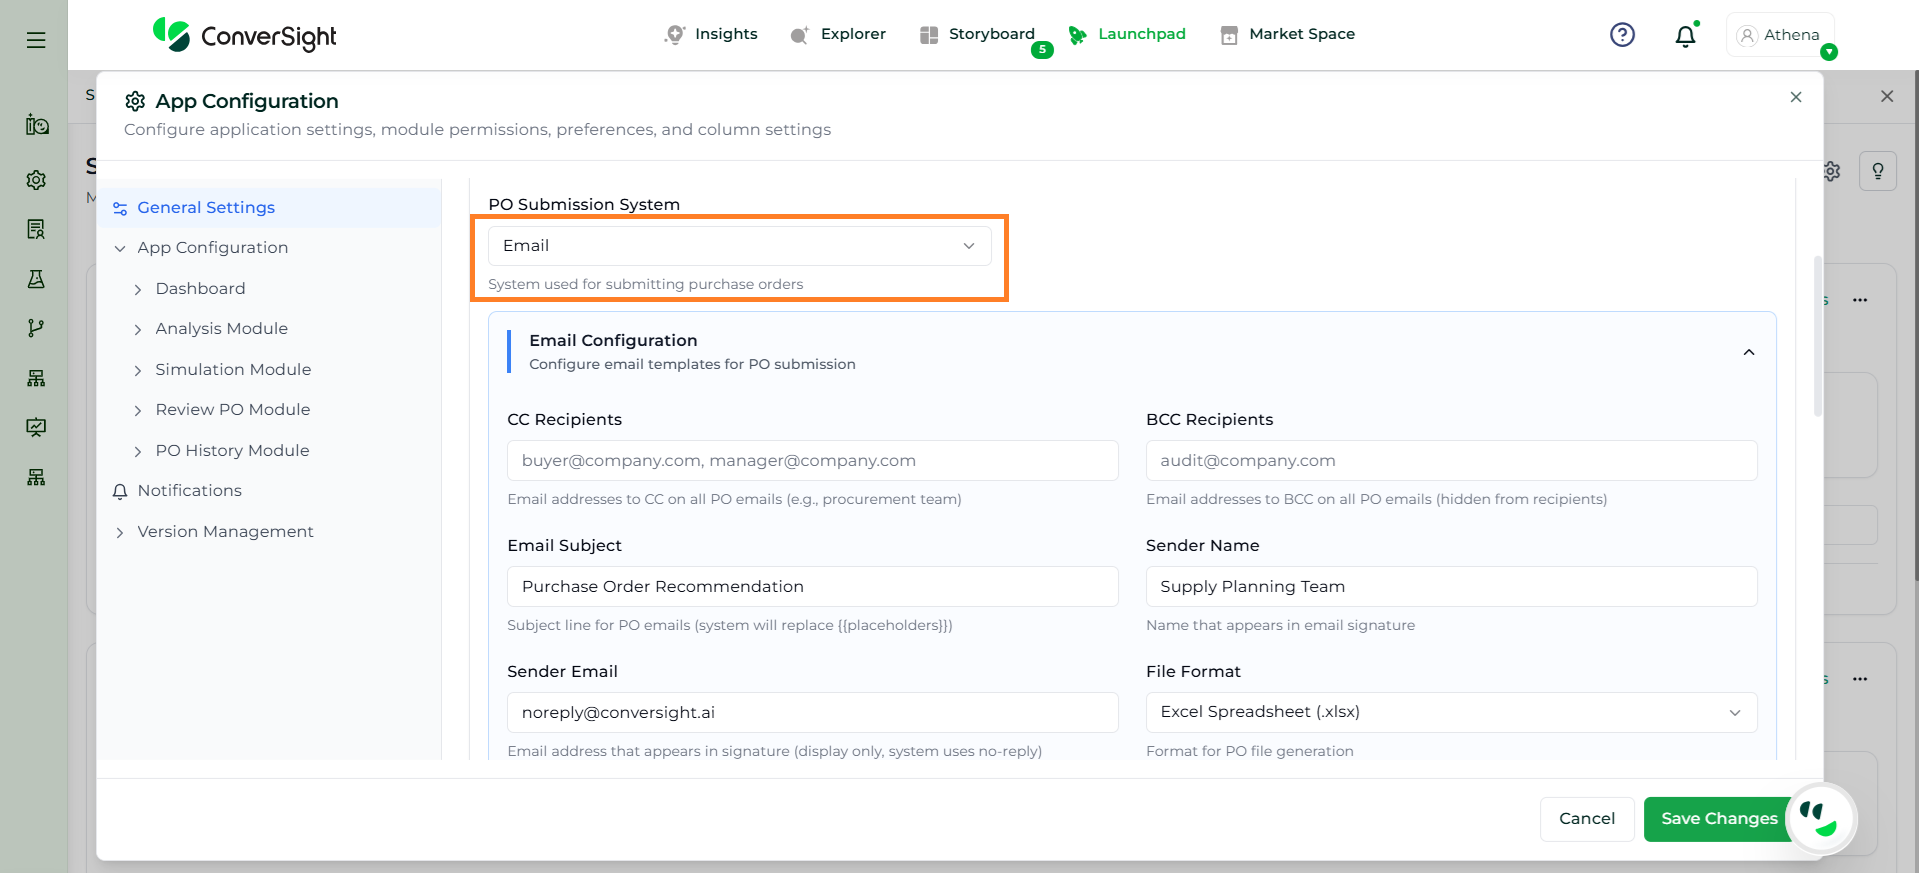
When Email is selected as the PO Submission System, the Email Configuration section is enabled, allowing users to fully define how purchase orders are communicated. This section provides complete control over recipients, email structure, attachment format, and delivery behavior.
Field
Description
CC Recipients
Specifies email addresses that will receive a visible copy of the purchase order email.
BCC Recipients
Specifies email addresses that will receive a hidden copy of the purchase order email.
Email Subject
Defines the subject line of the email sent along with the purchase order.
Sender Name
Specifies the name displayed as the sender in the email.
Sender Email
Defines the email address used to send the purchase order.
File Format
Specifies the format of the purchase order attachment (e.g., Excel, CSV, PDF).
Placeholders
Allows insertion of dynamic values (e.g., supplier name, order number).
Email Body
Enables customization of the email content with formatting and placeholders.
Email Preview
Displays a preview of the final email before sending.
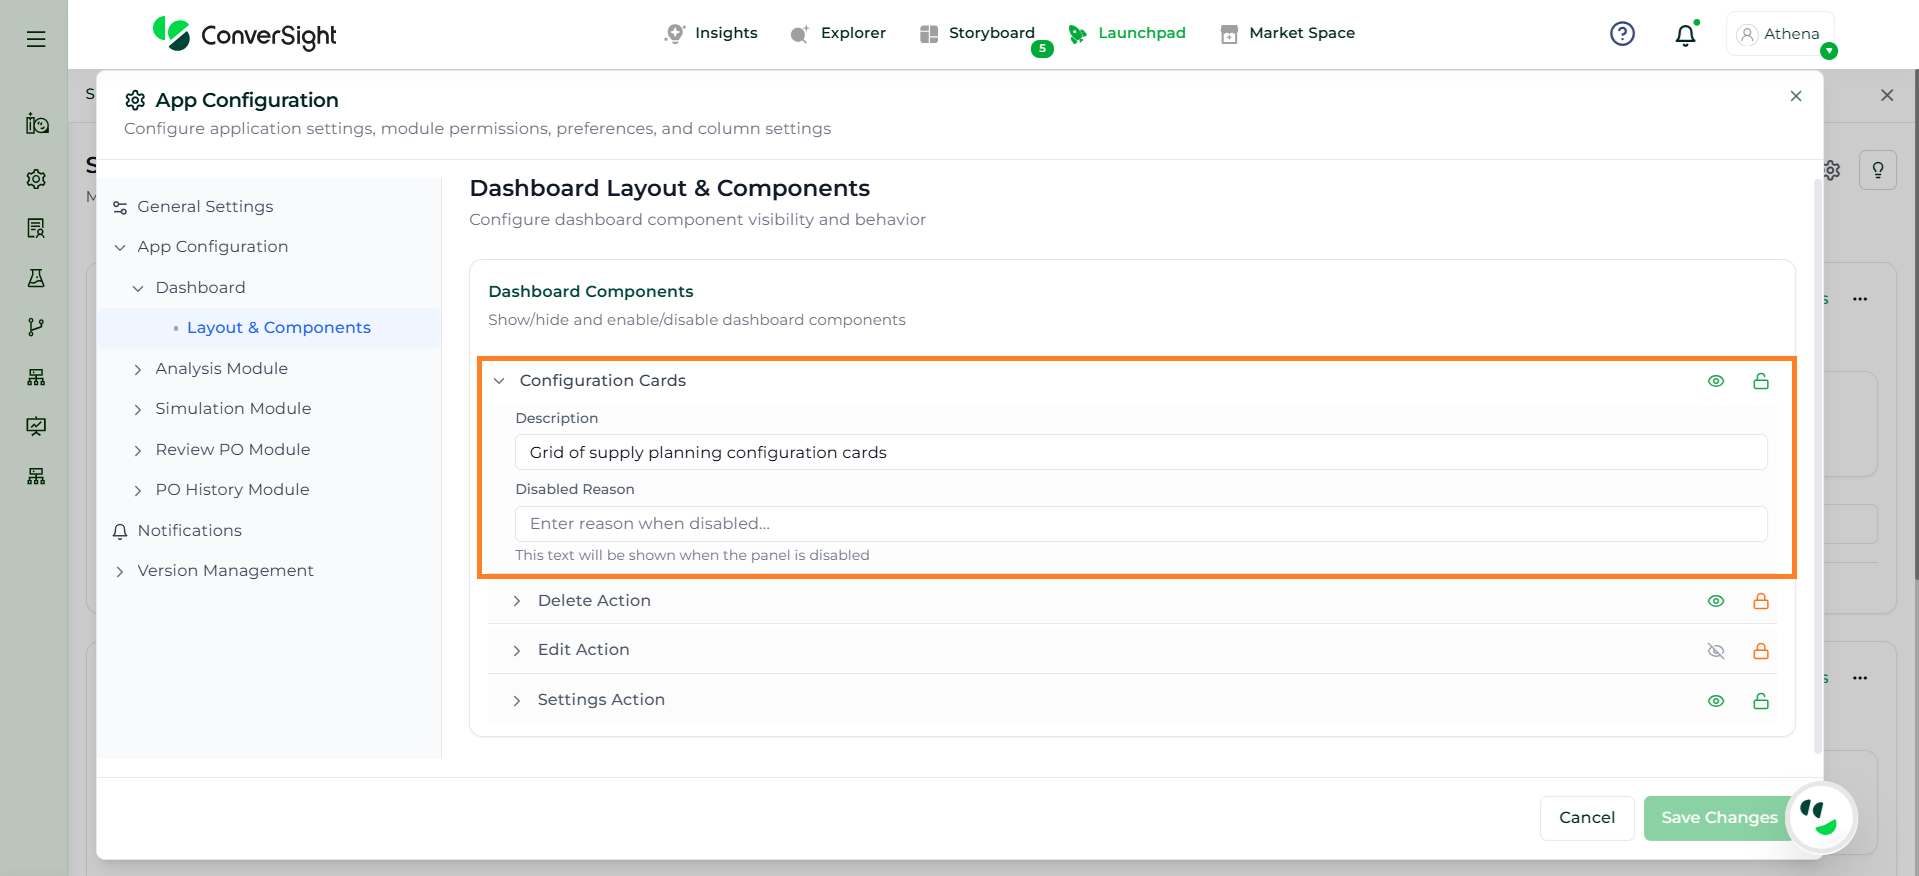
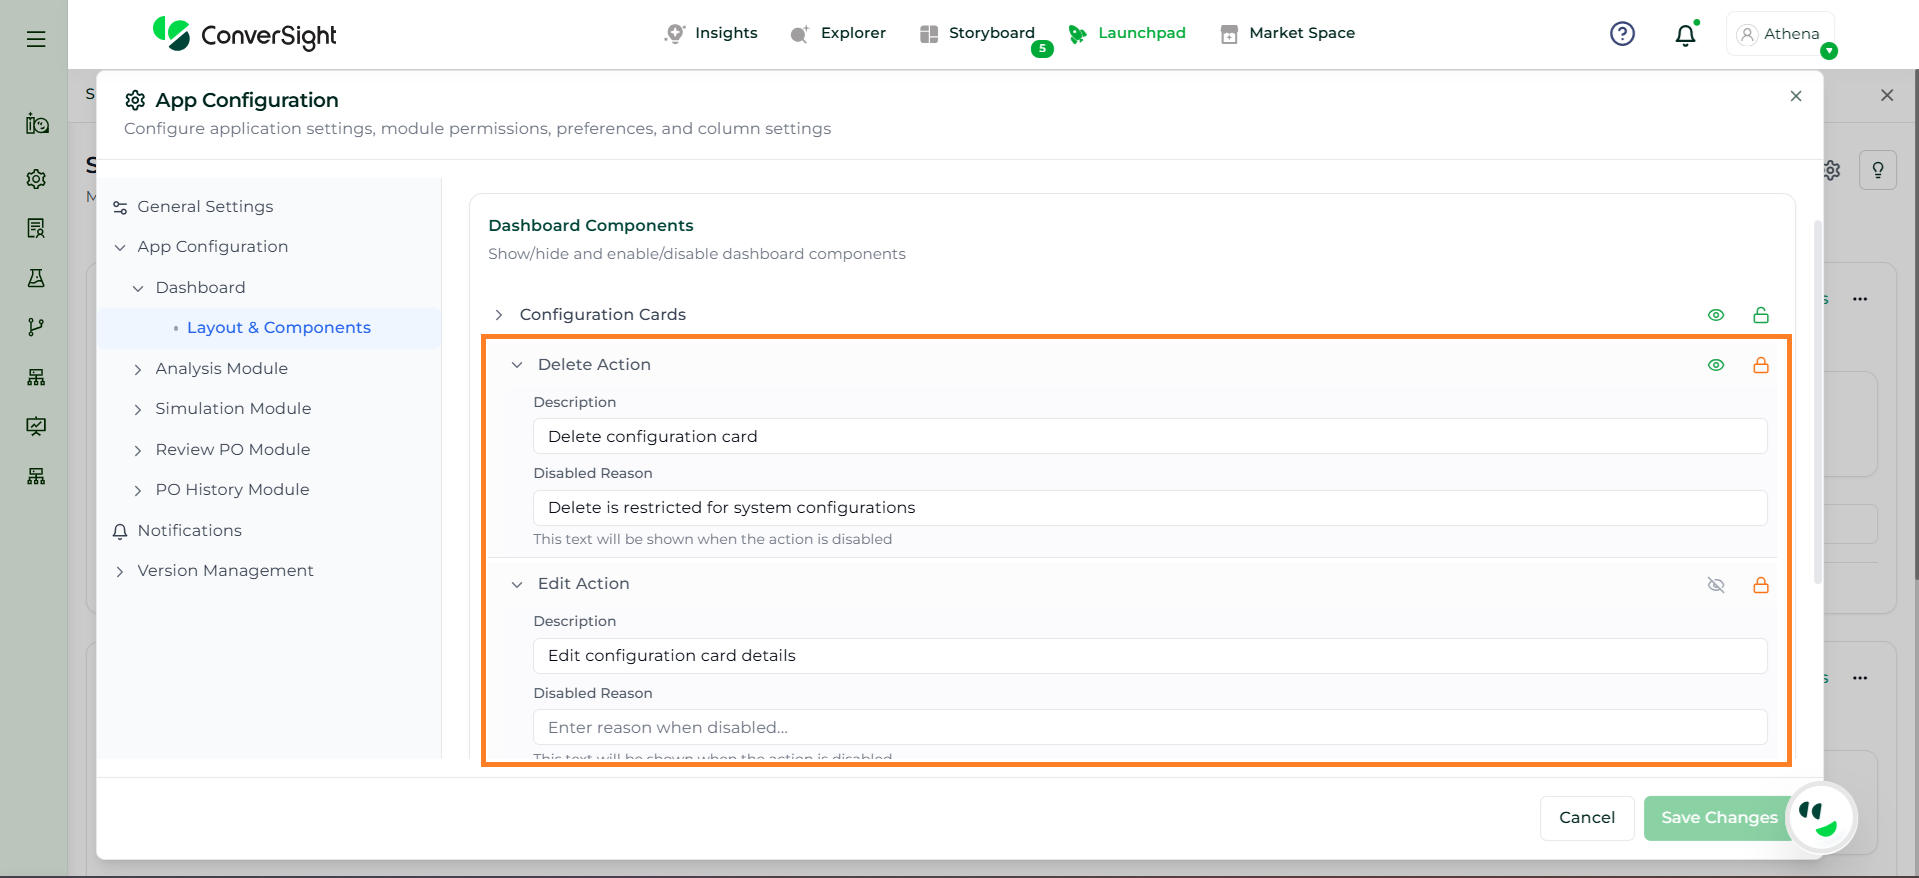
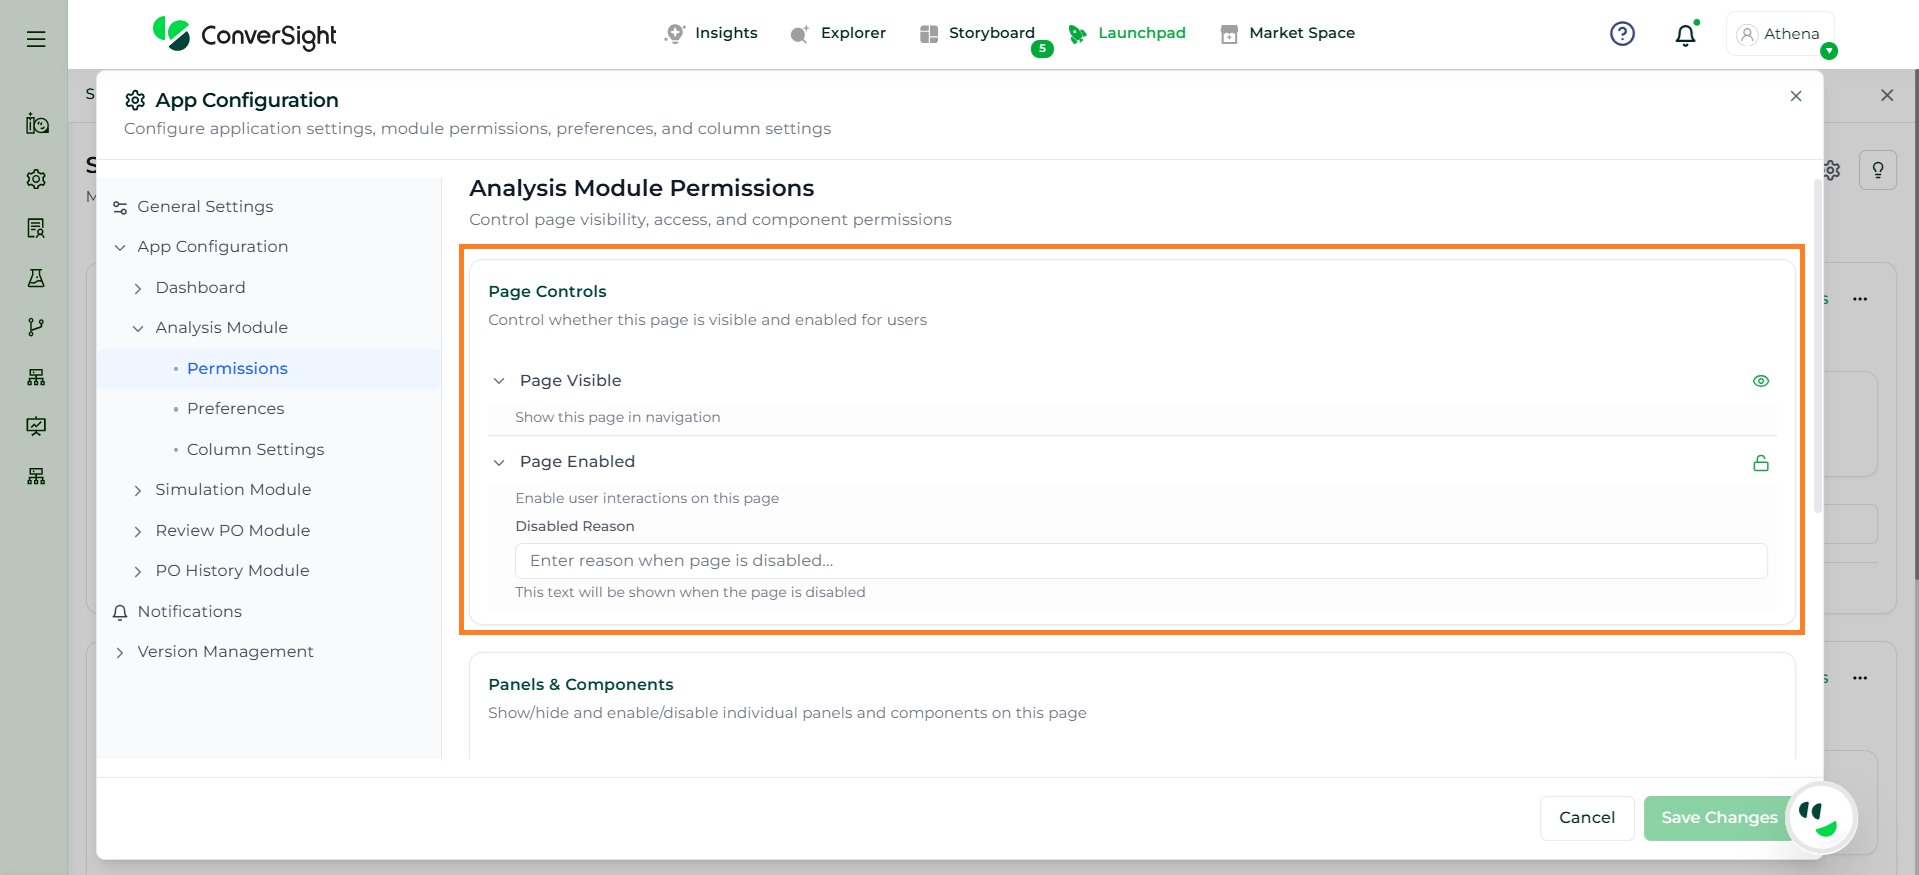
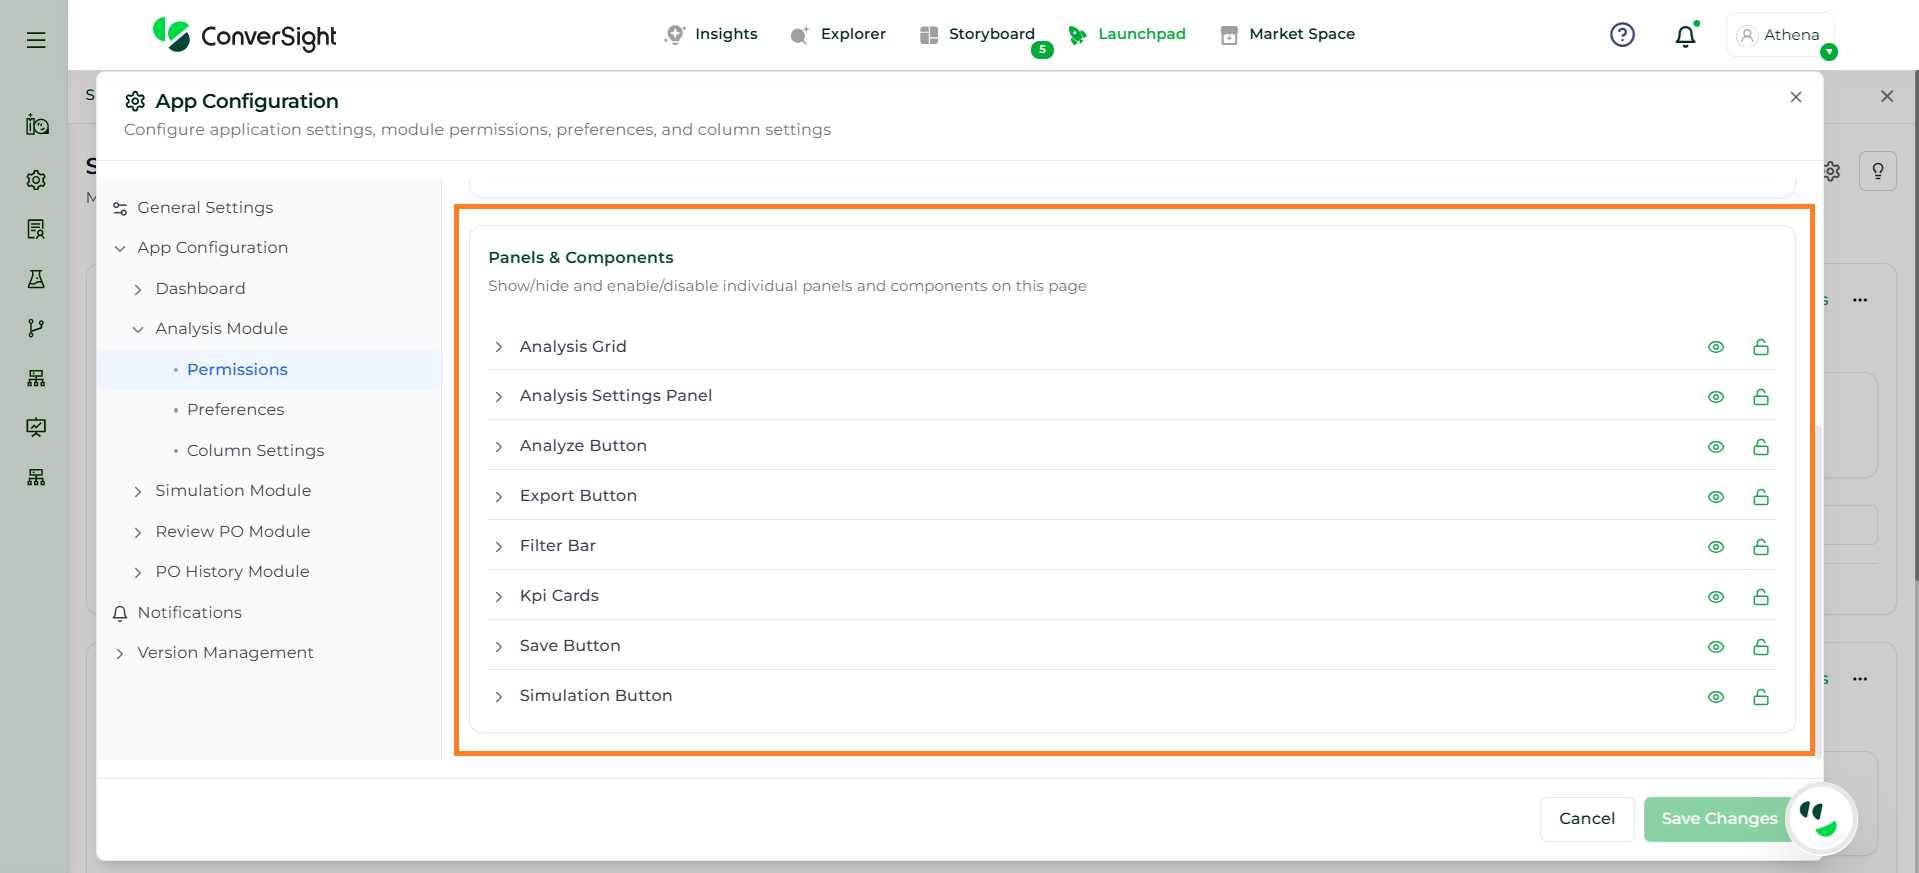
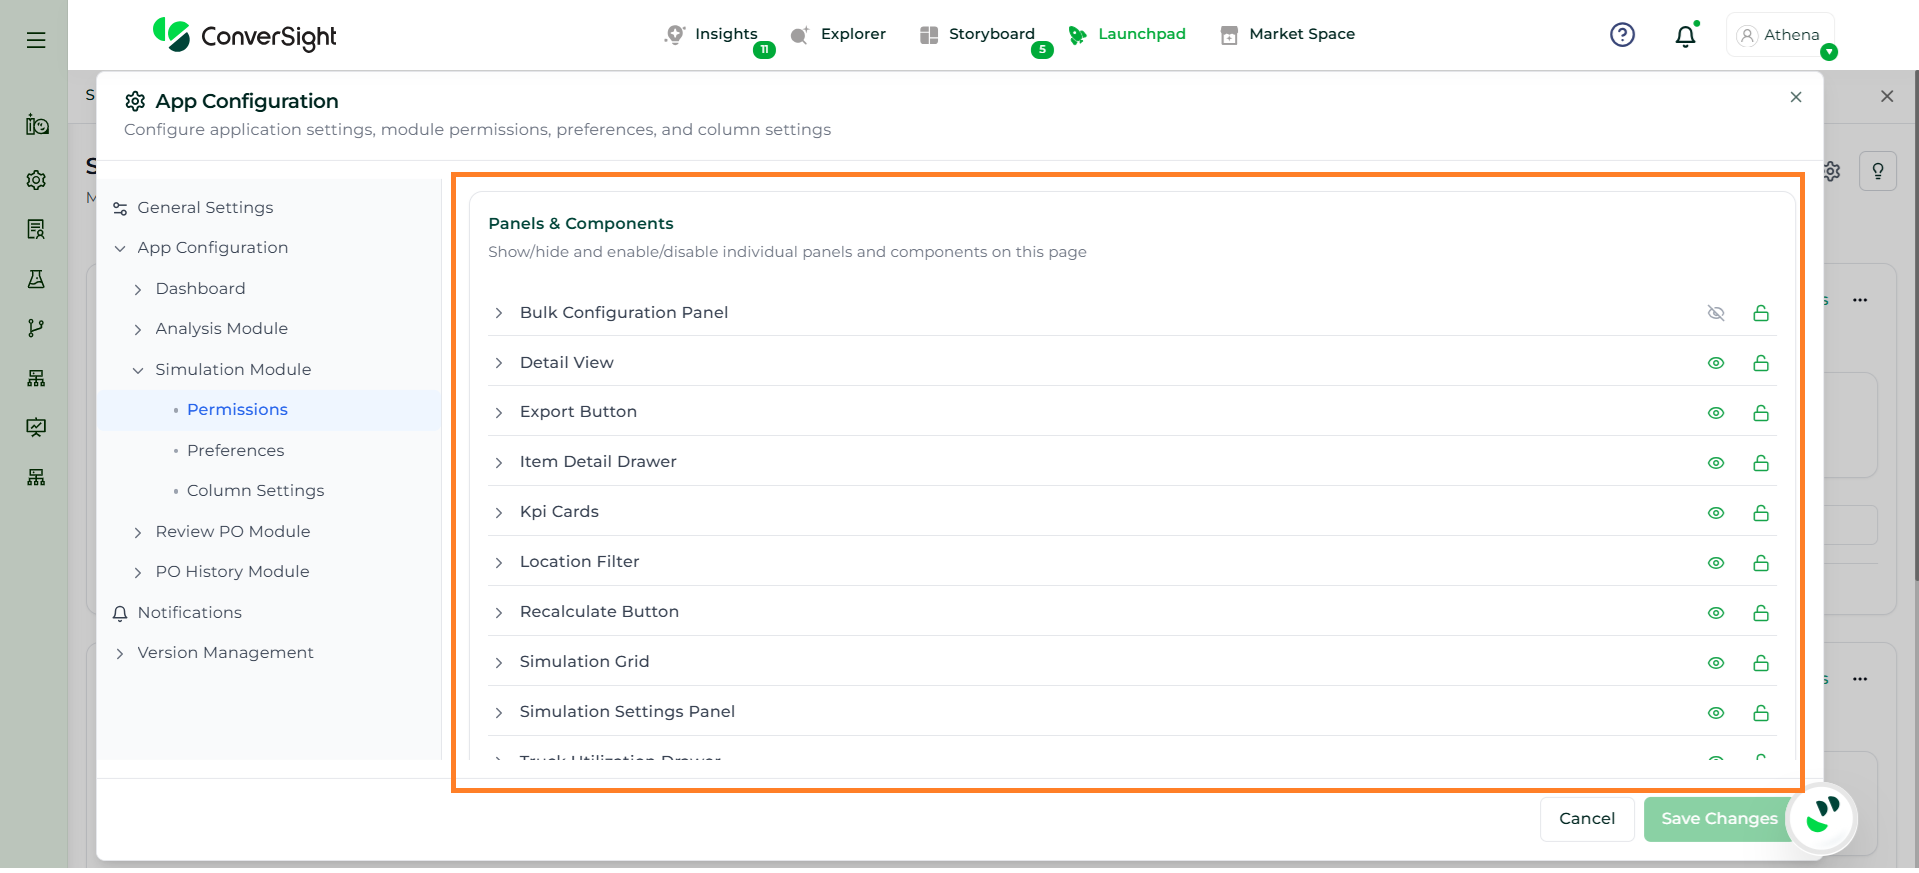
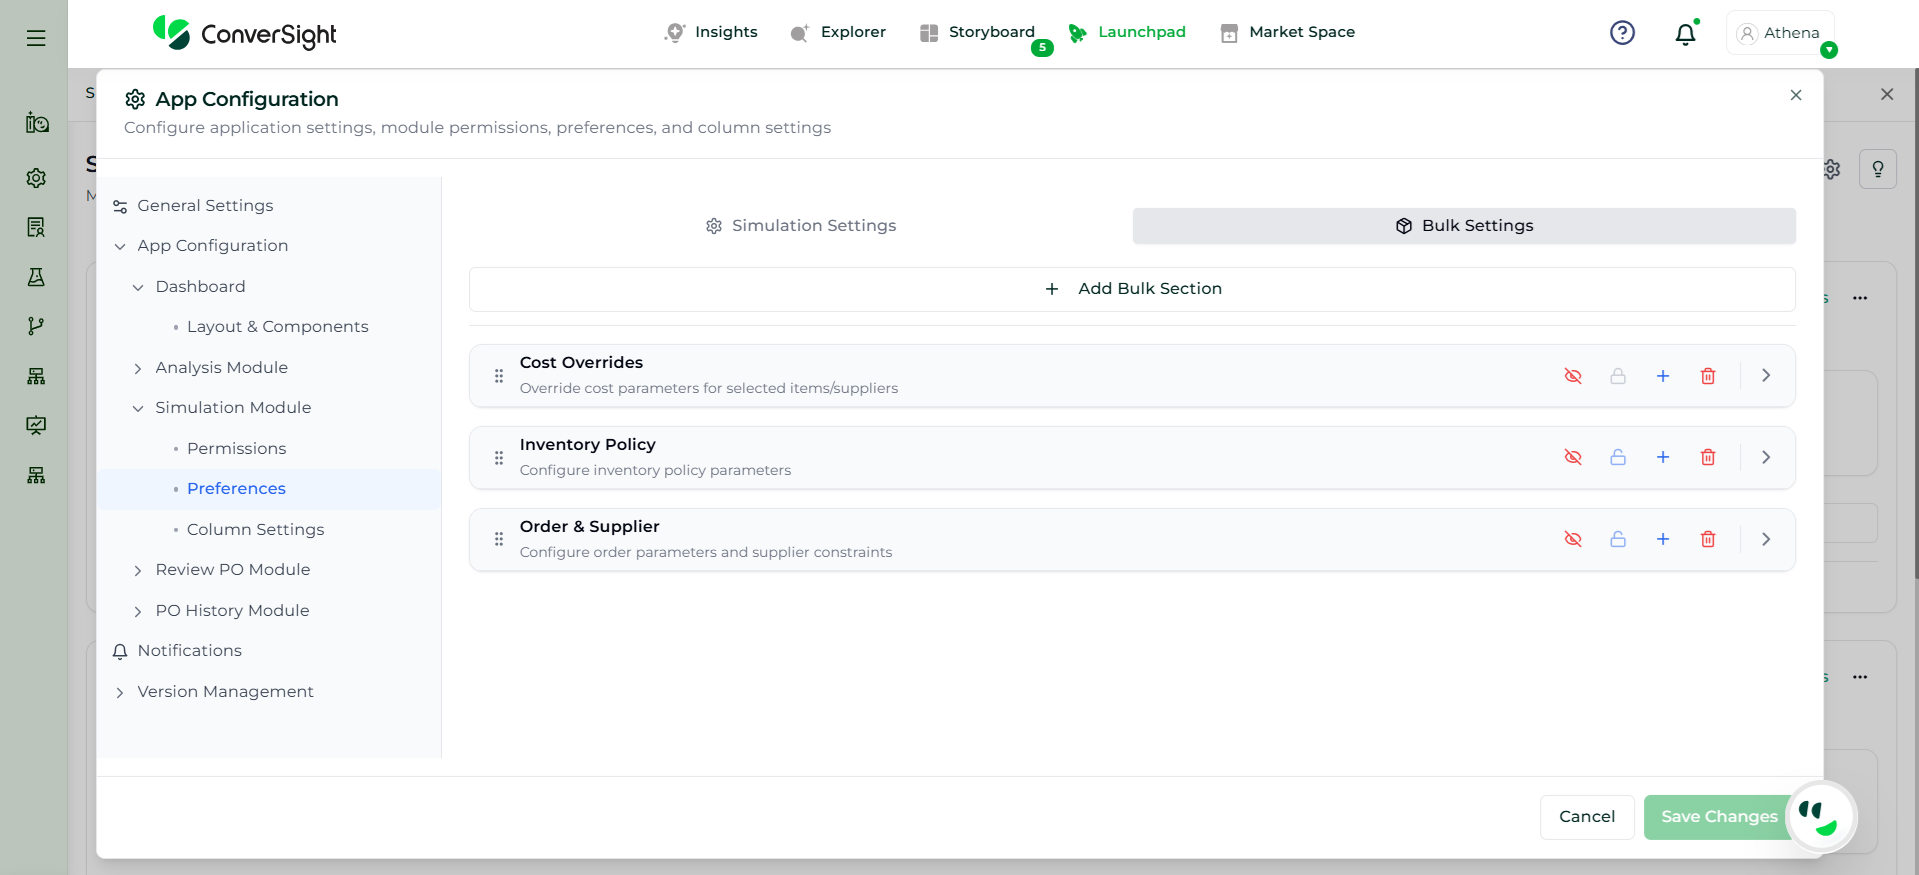
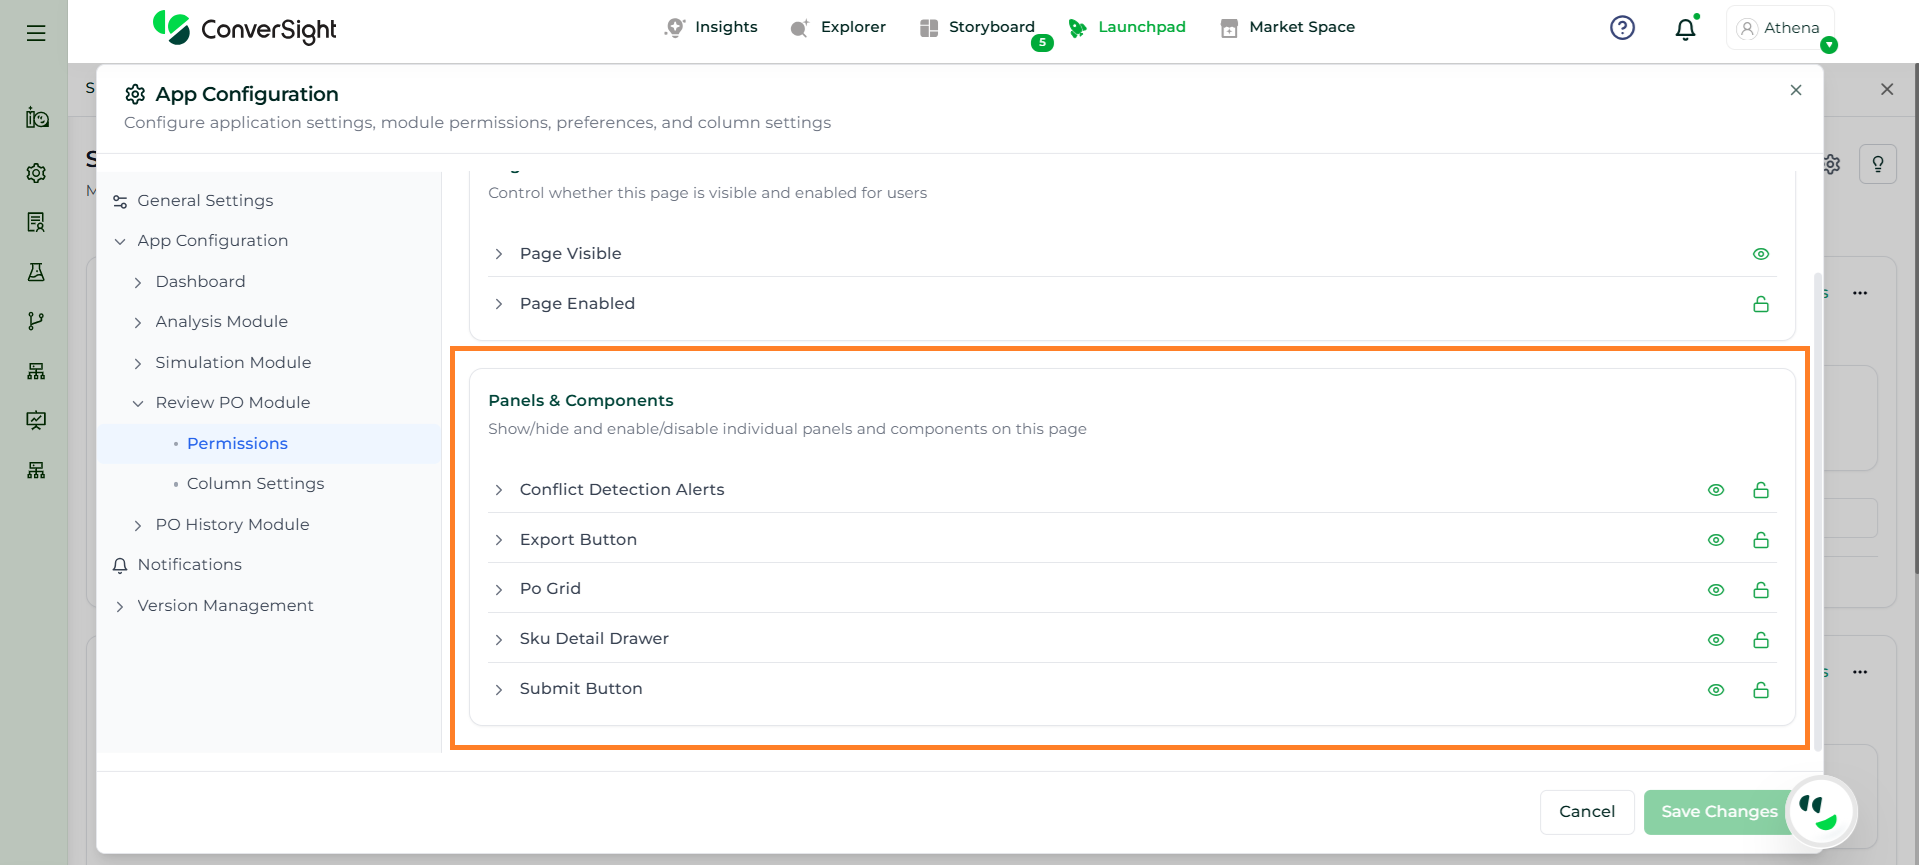
The Panels & Components section provides an overview of the key interface elements available in the Analysis module, enabling users to interact with data, configure settings, and perform analysis actions.
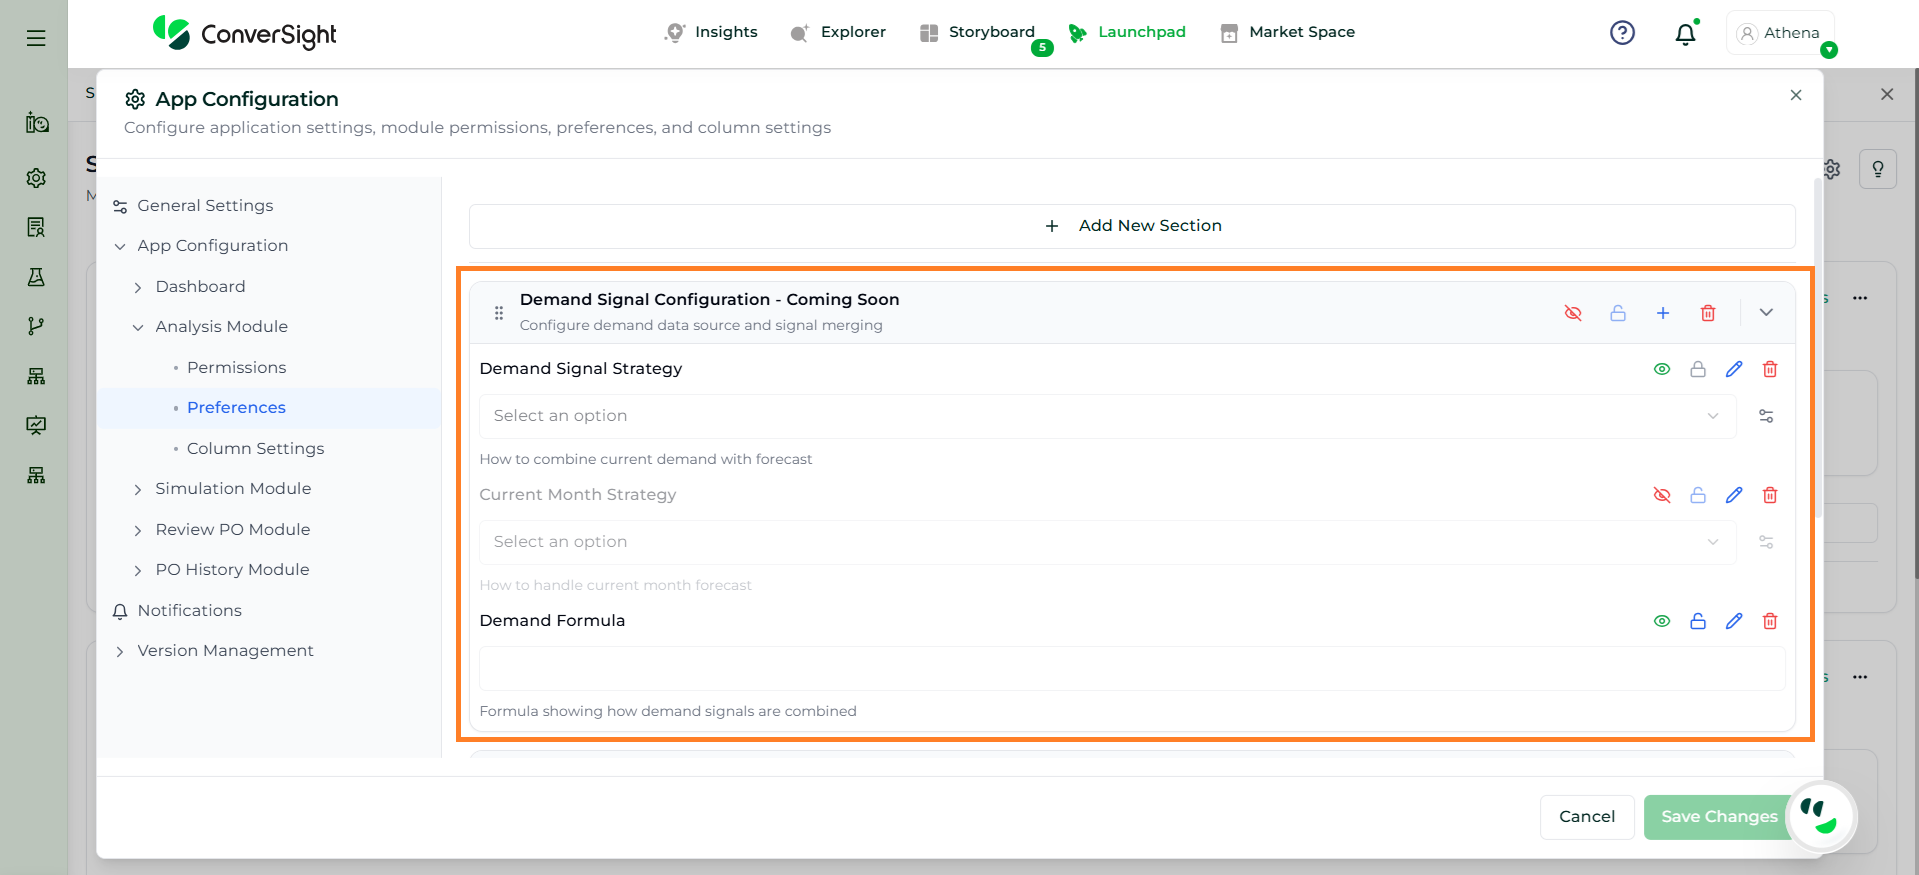
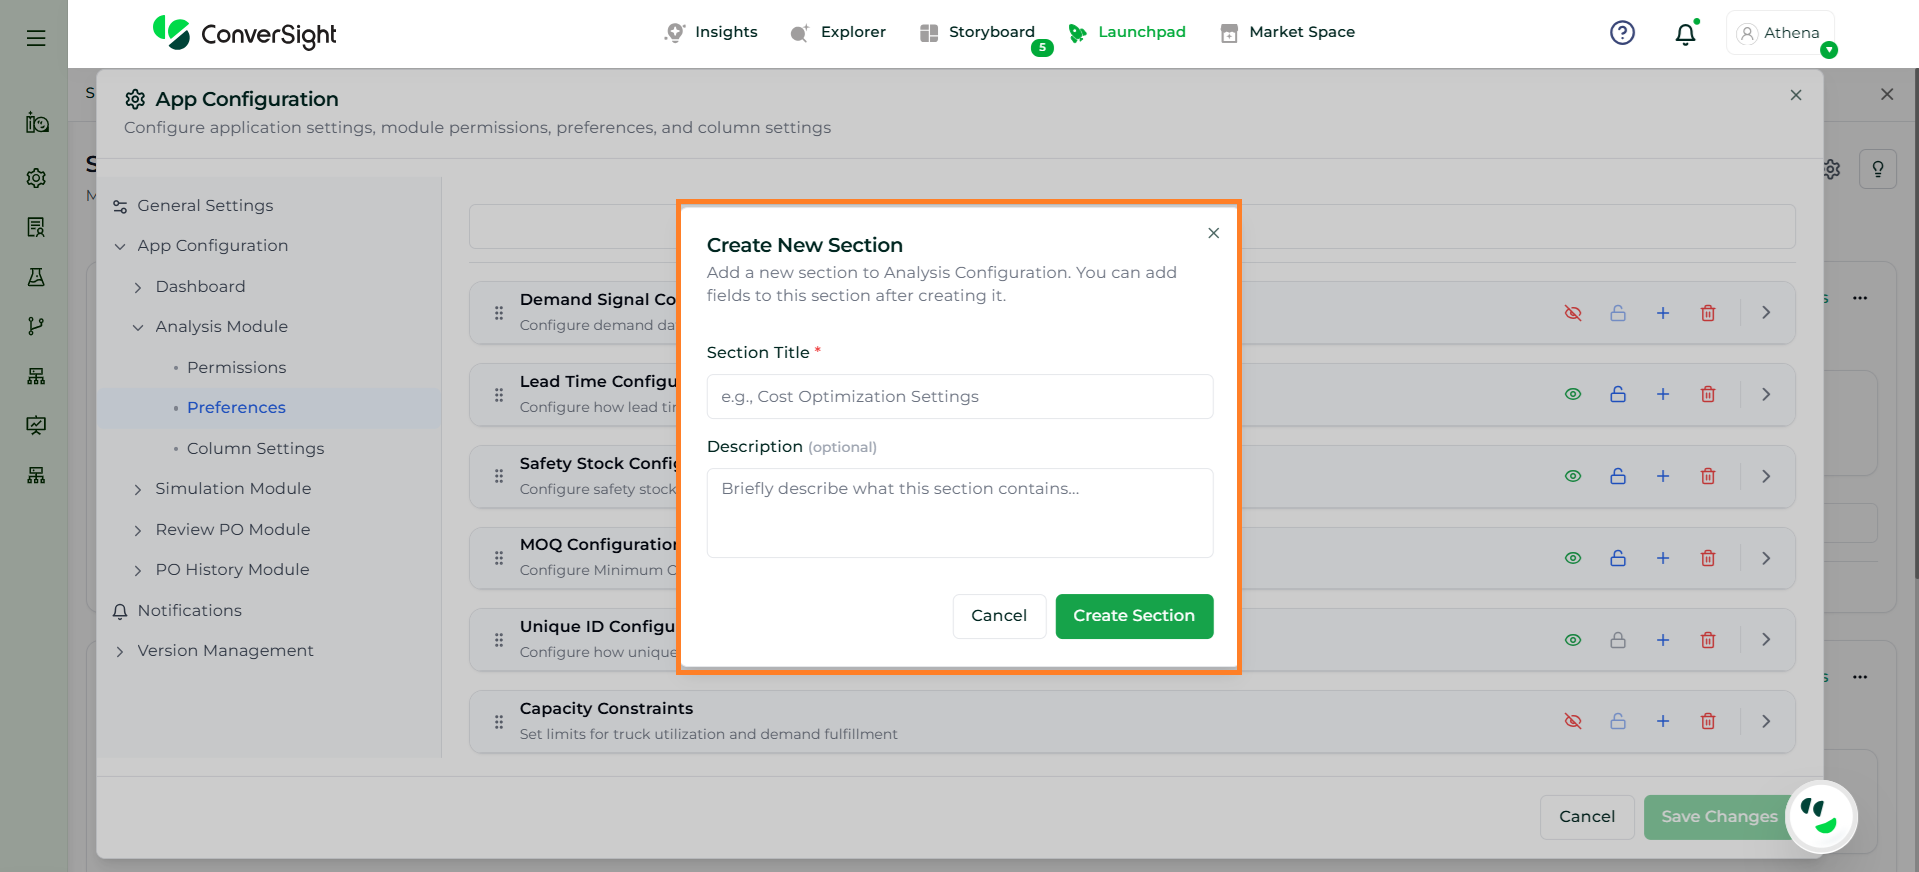
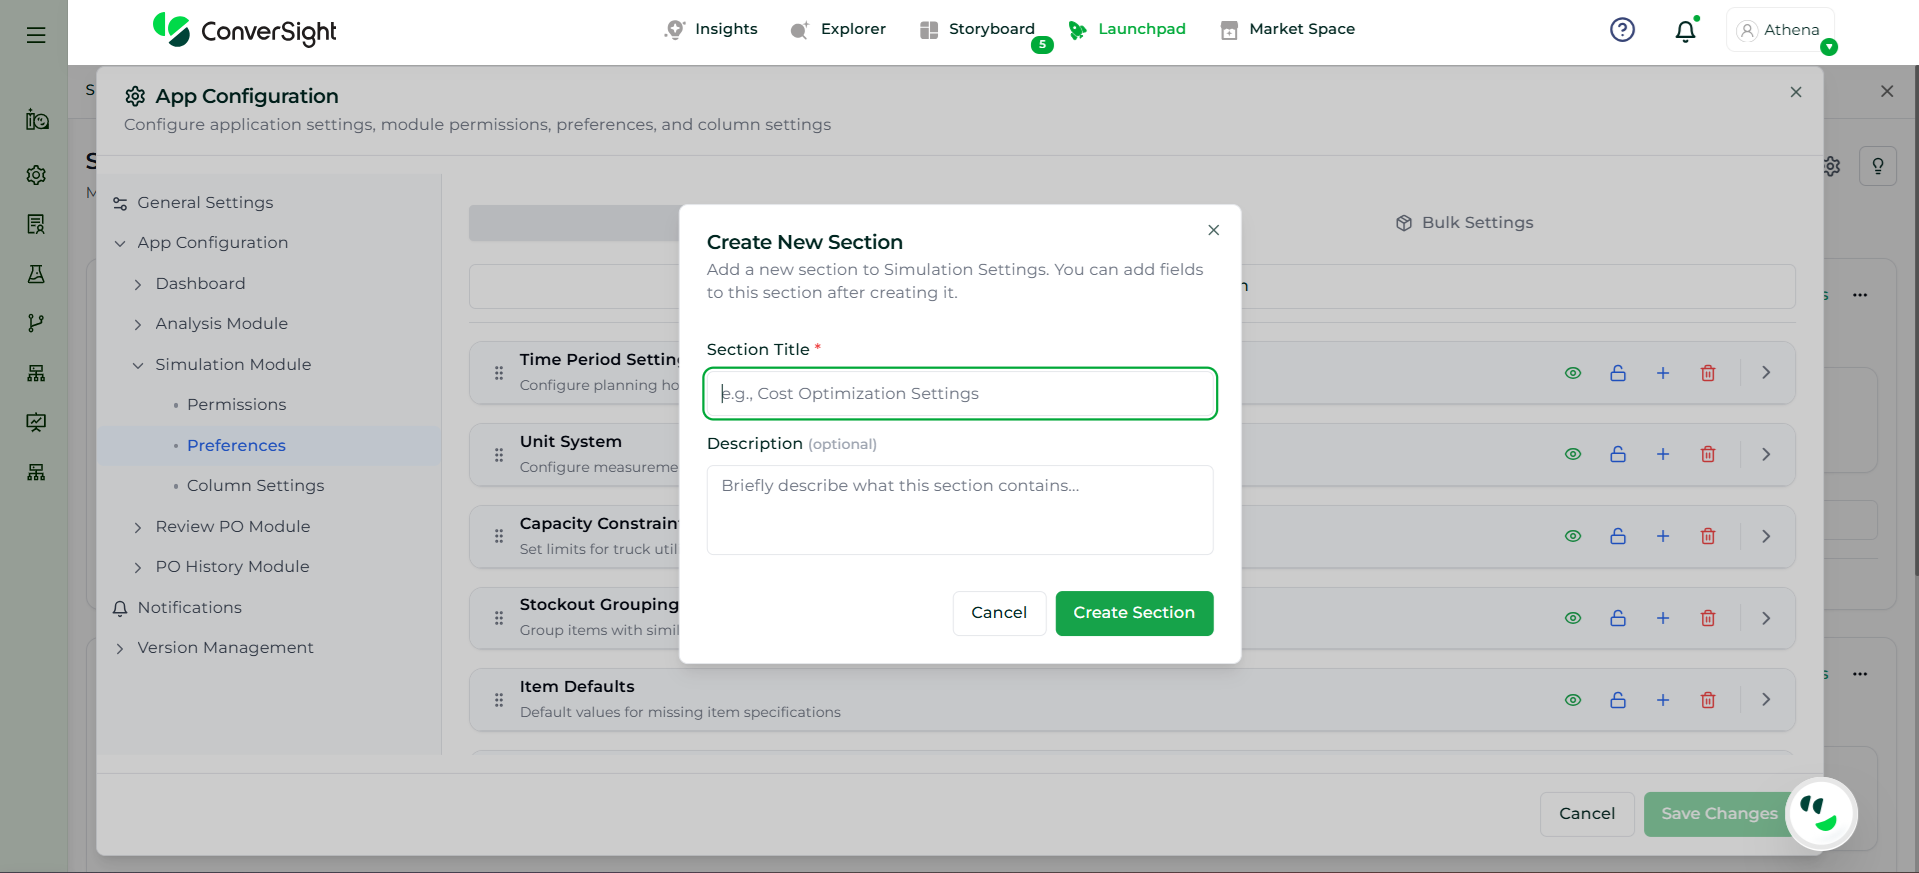
The Add New Section option allows users to create a custom configuration section within the Analysis Preferences. This helps organize additional planning parameters or group related settings based on business requirements.
When selected, a dialog box appears where users can define:
Section Title: Name of the new section
Description (Optional): Brief explanation of the section
After entering the details, click Create Section to add it. The new section will then be available for further configuration.
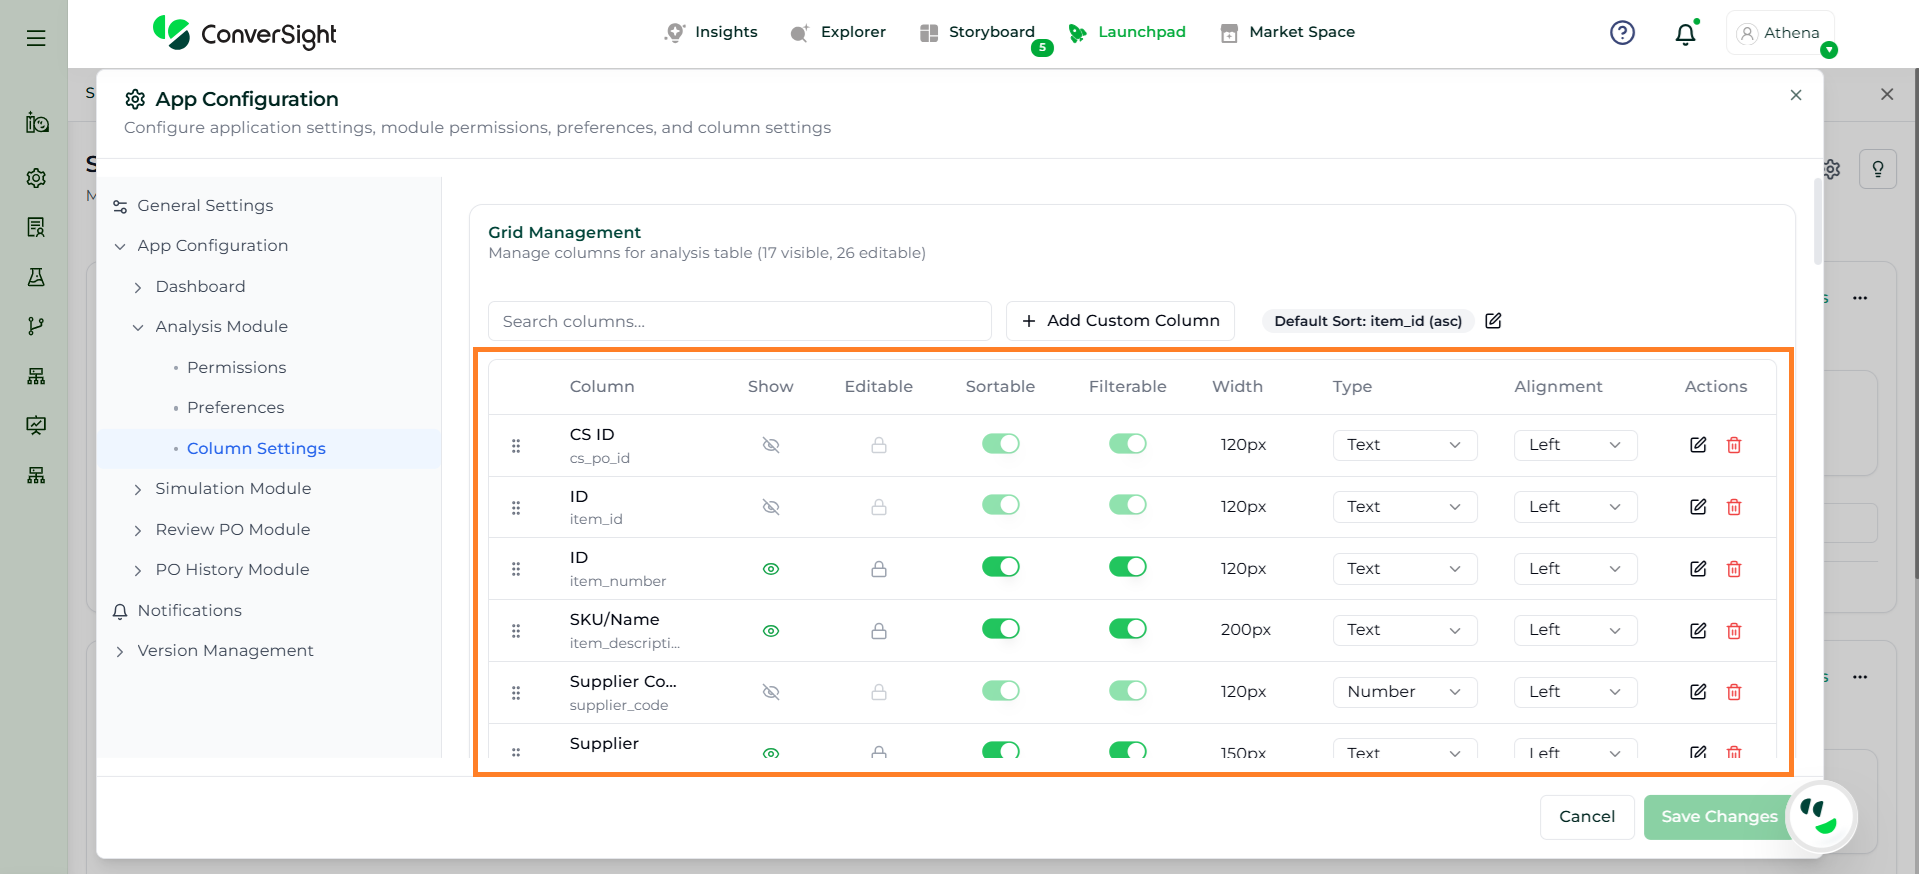
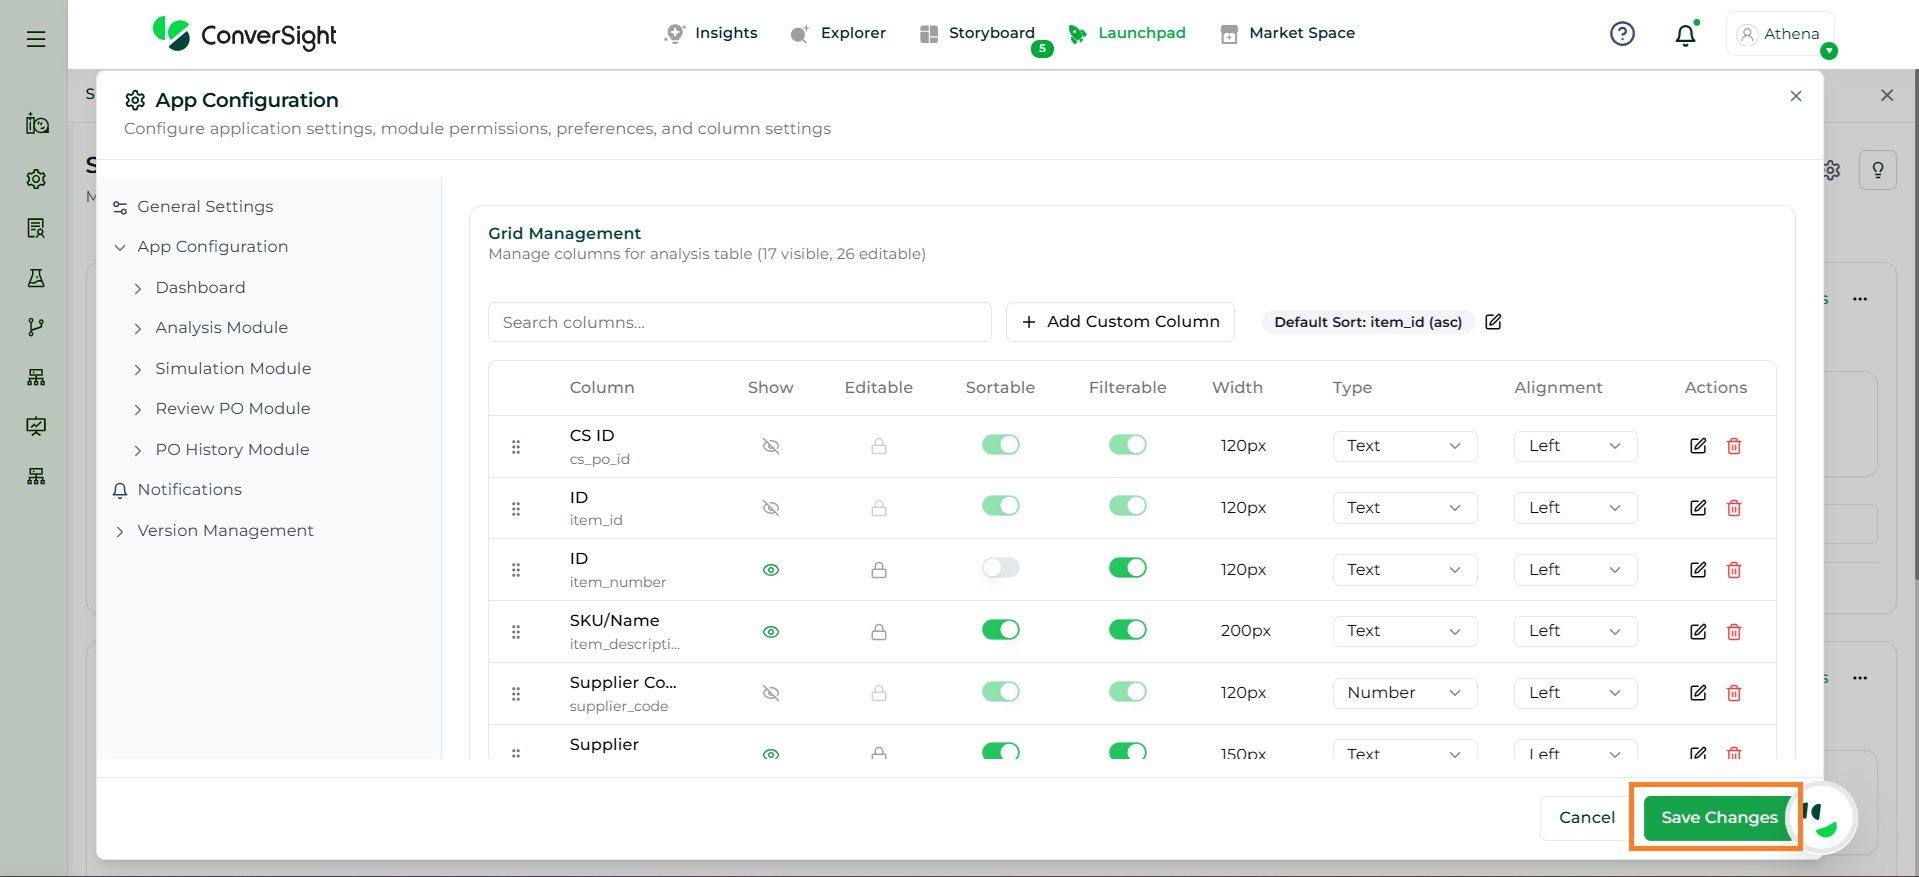
The Column Settings section allows administrators to control how columns are displayed and managed within the Analysis grid, ensuring a structured and user-friendly experience.
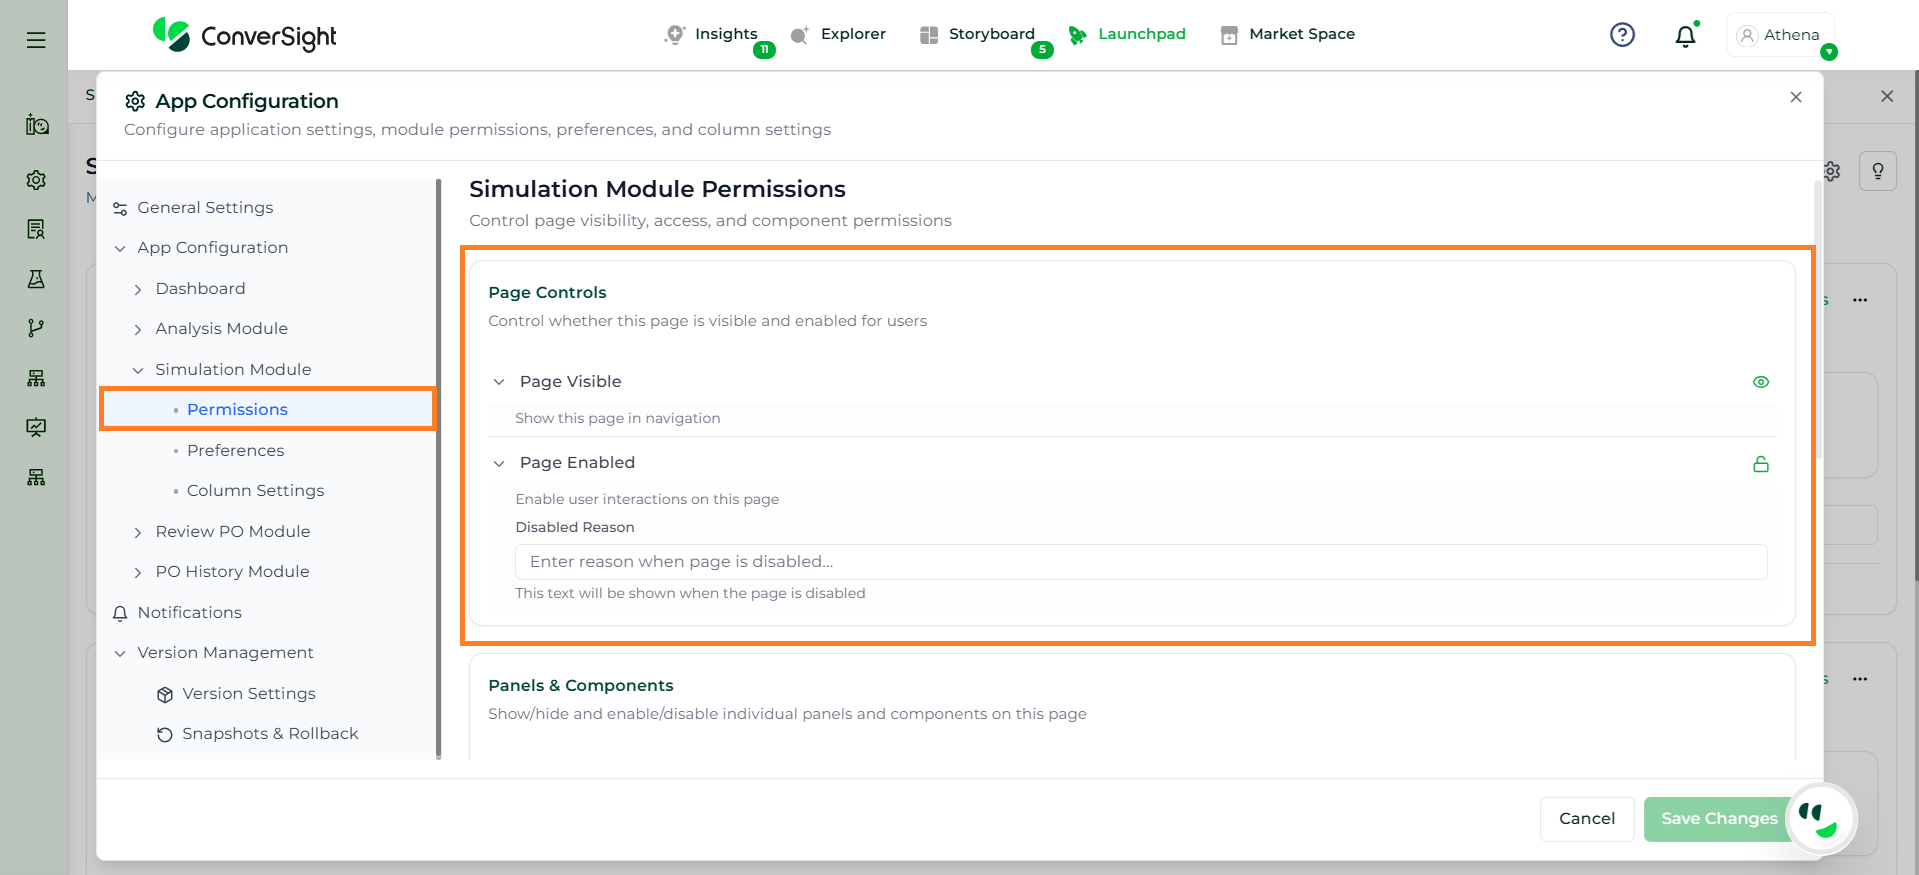
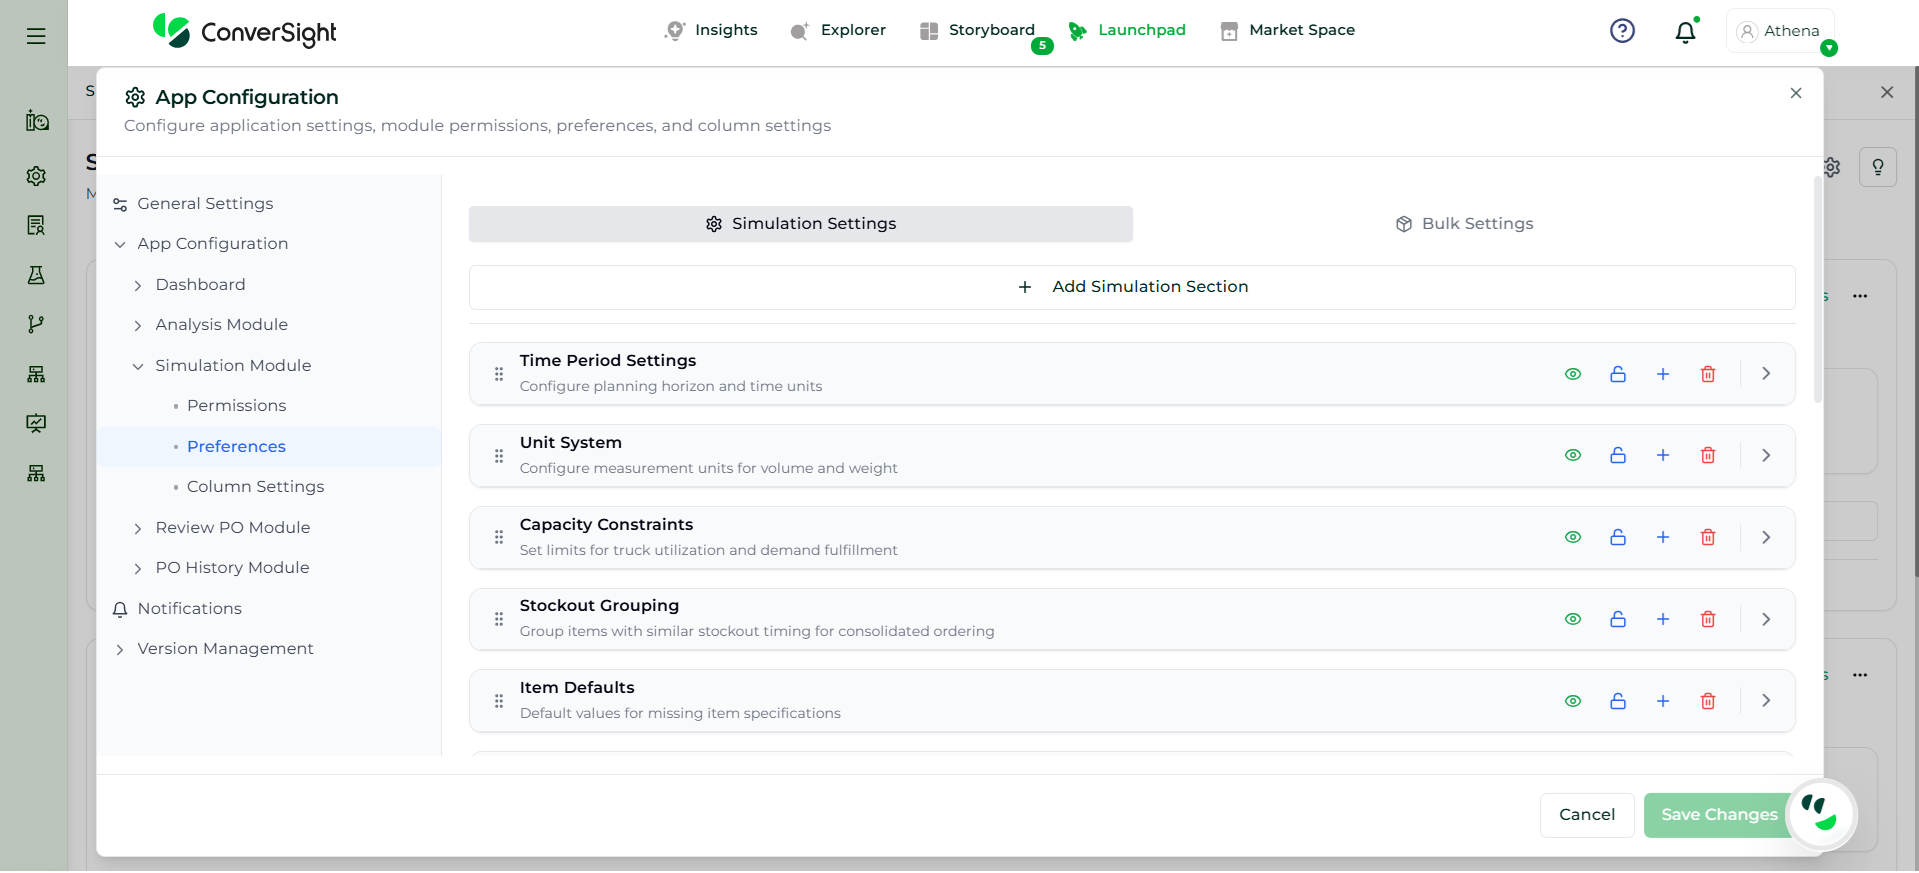
The Simulation Module provides a configurable environment to control how recommendations are generated, viewed, and optimized, including permissions, interface components, and detailed planning parameters.
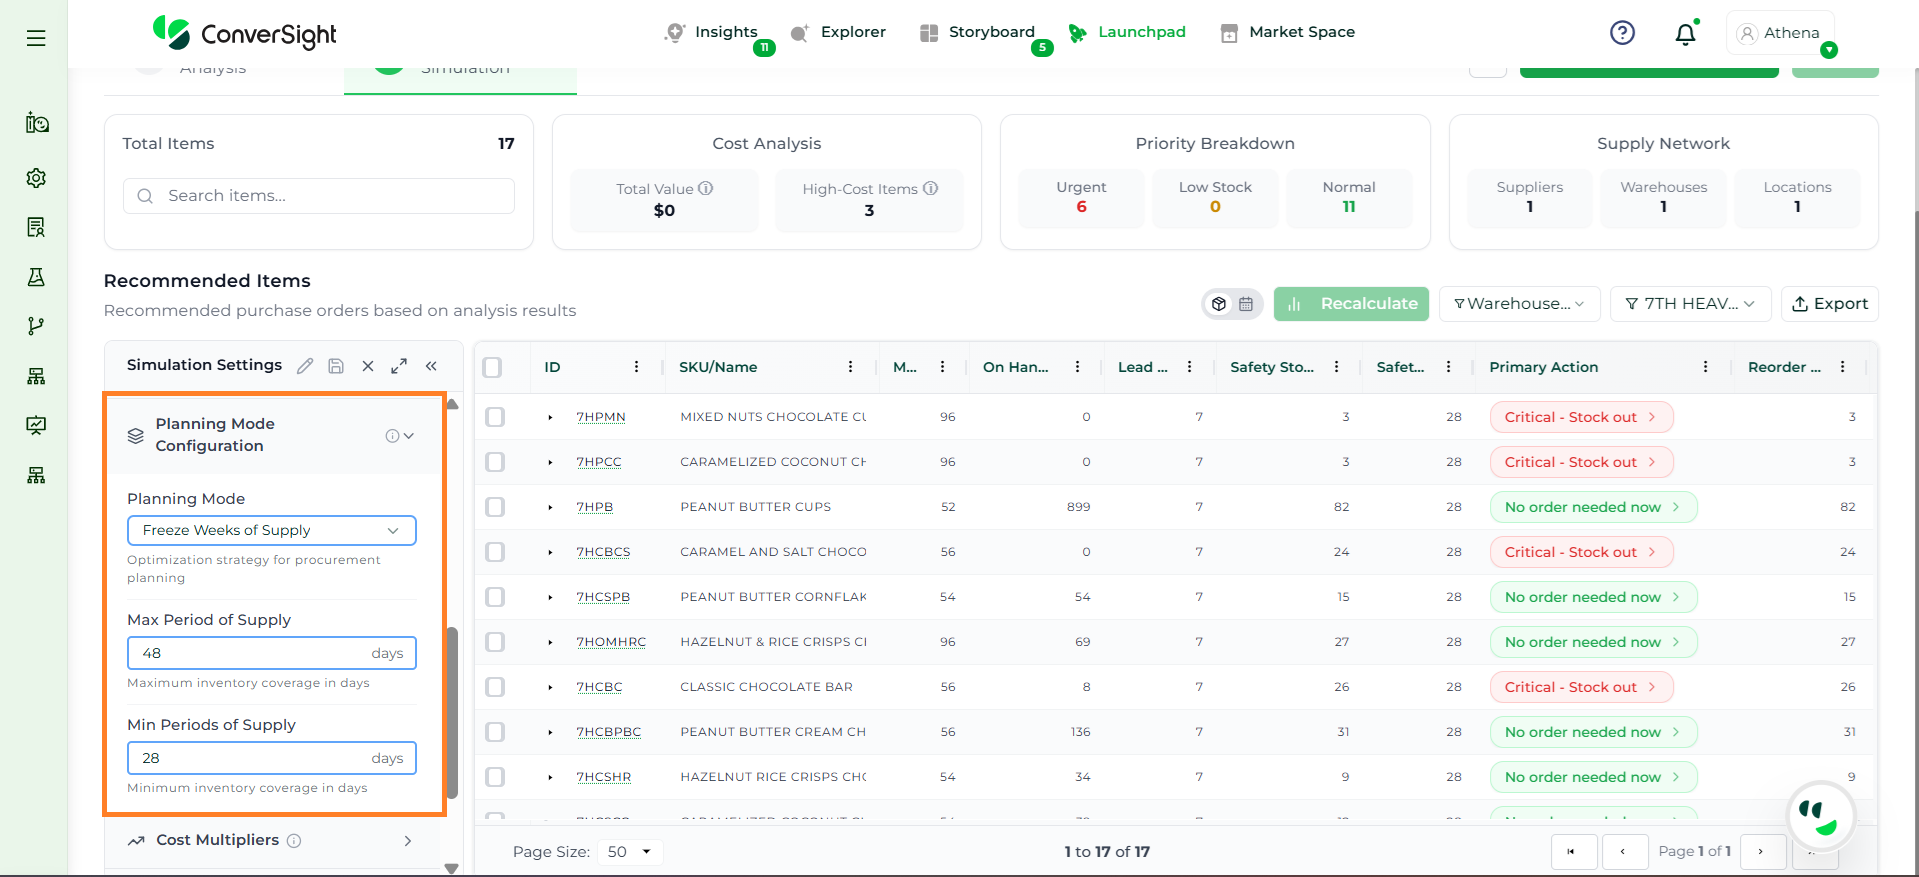
The Time Period Settings section defines how planning is structured over time, including the planning horizon, granularity, and demand coverage across periods.
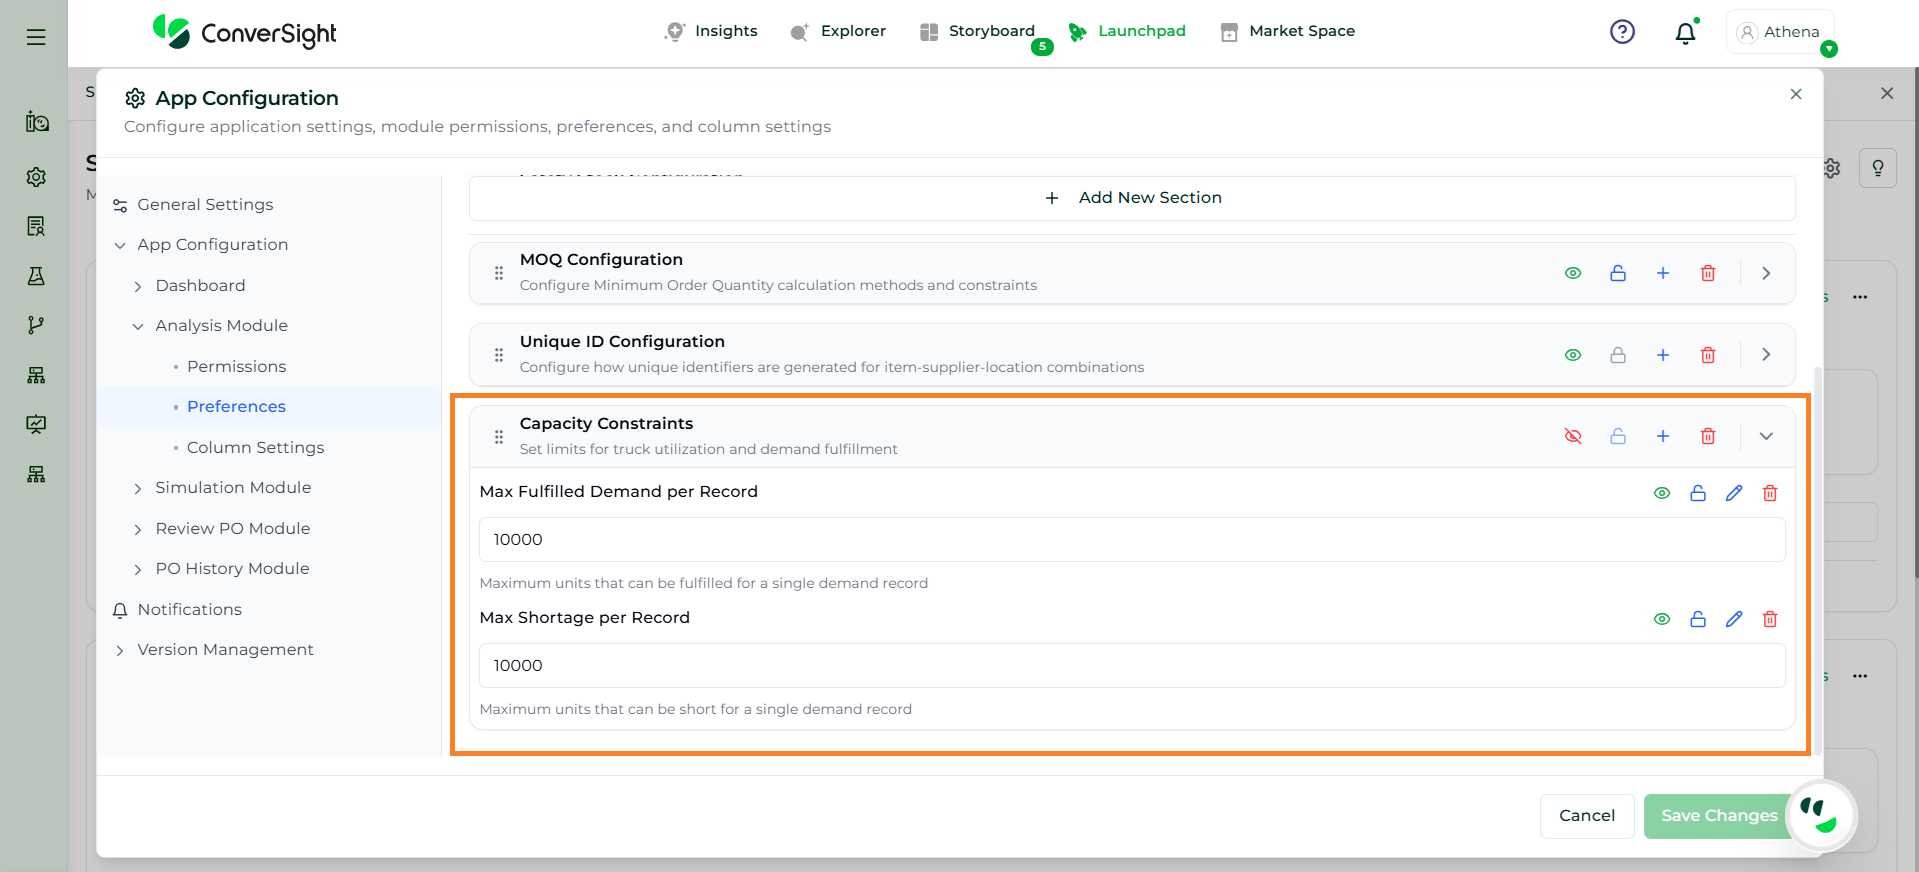
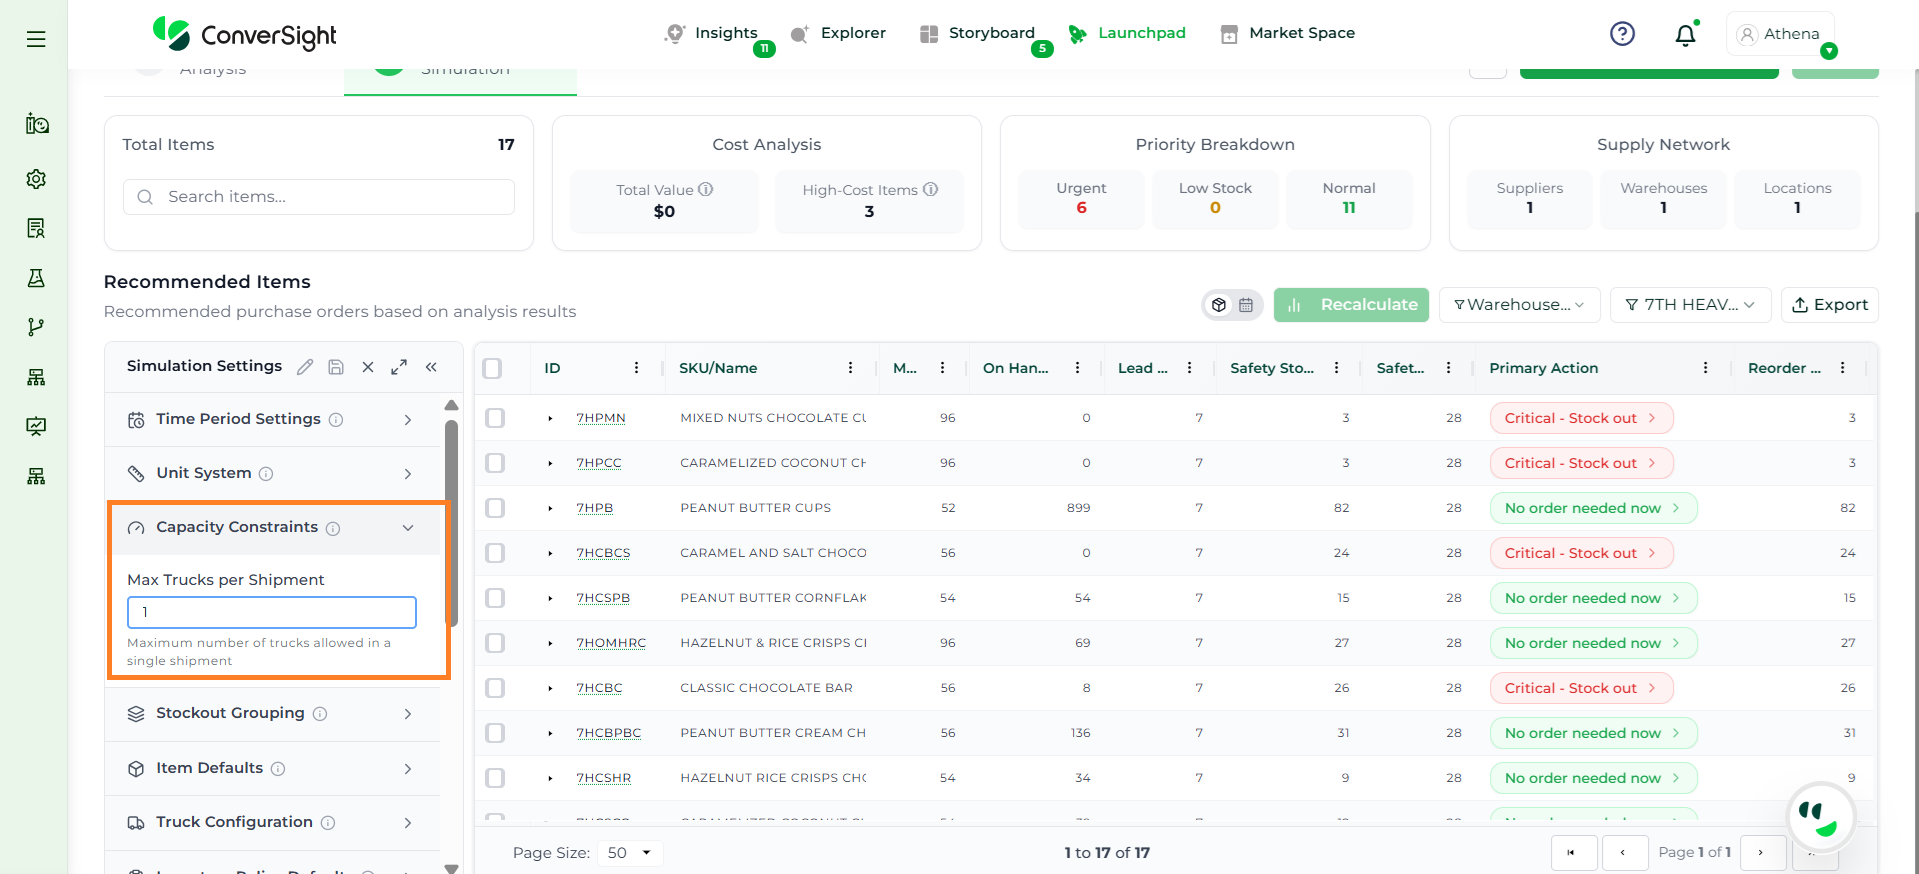
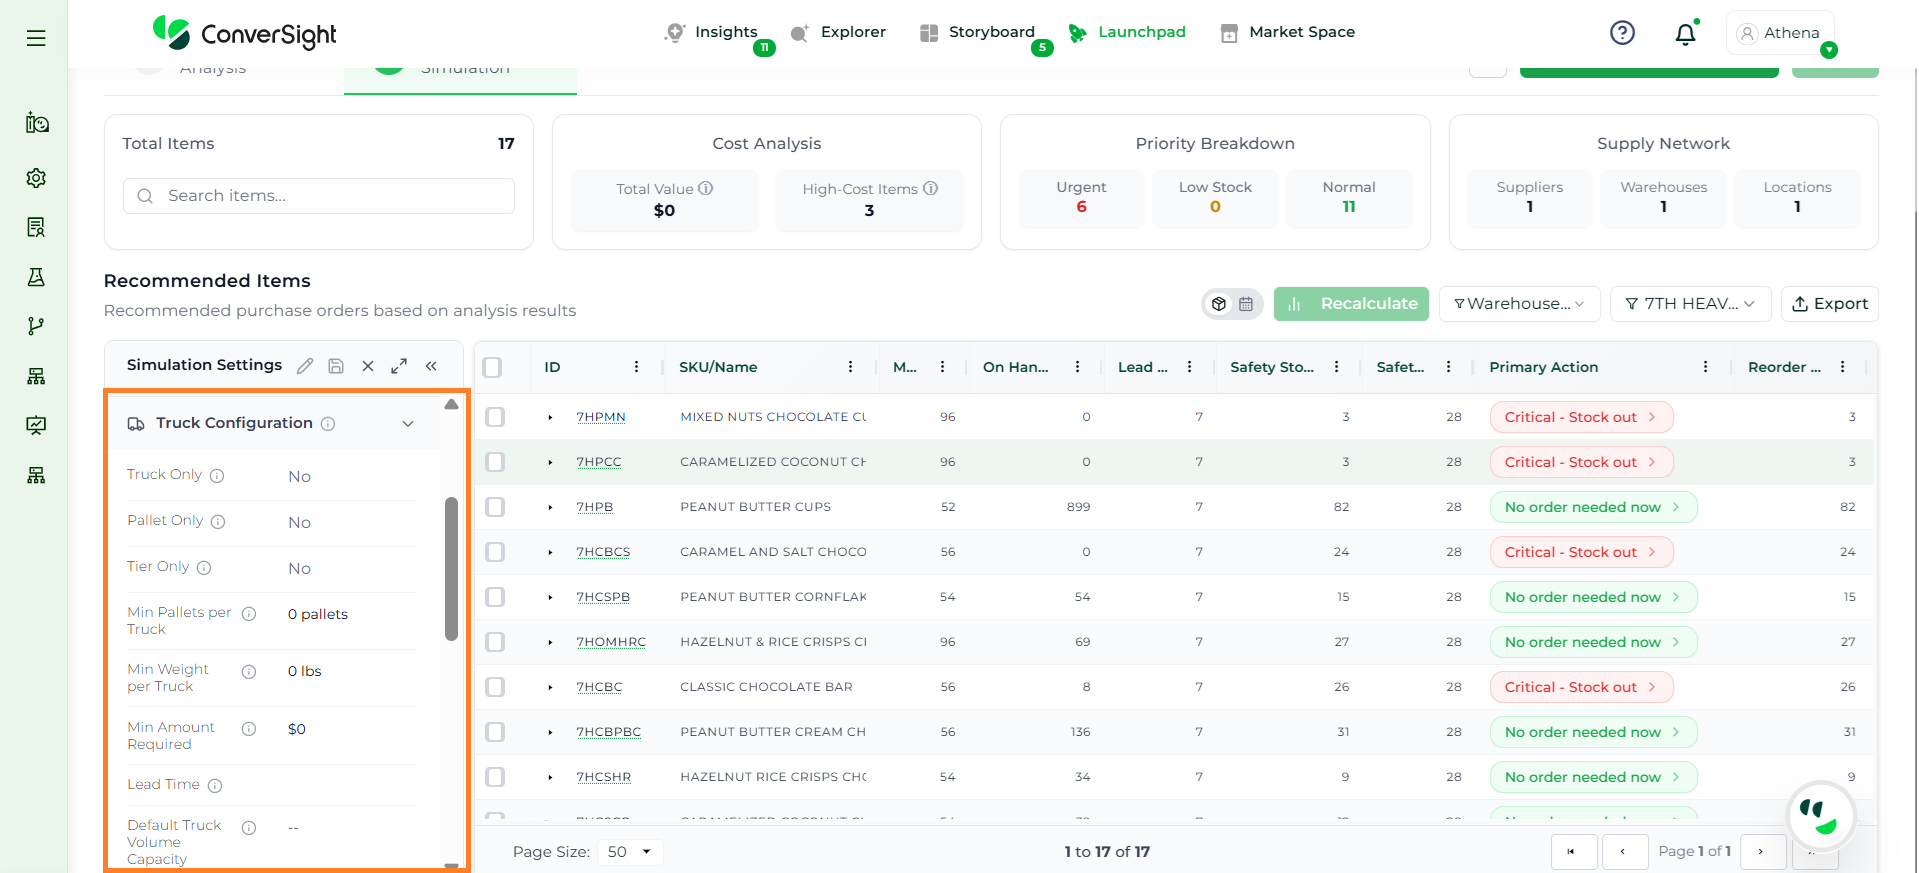
The Capacity Constraints section defines limits on transportation and fulfillment to ensure shipments and demand handling stay within operational constraints.
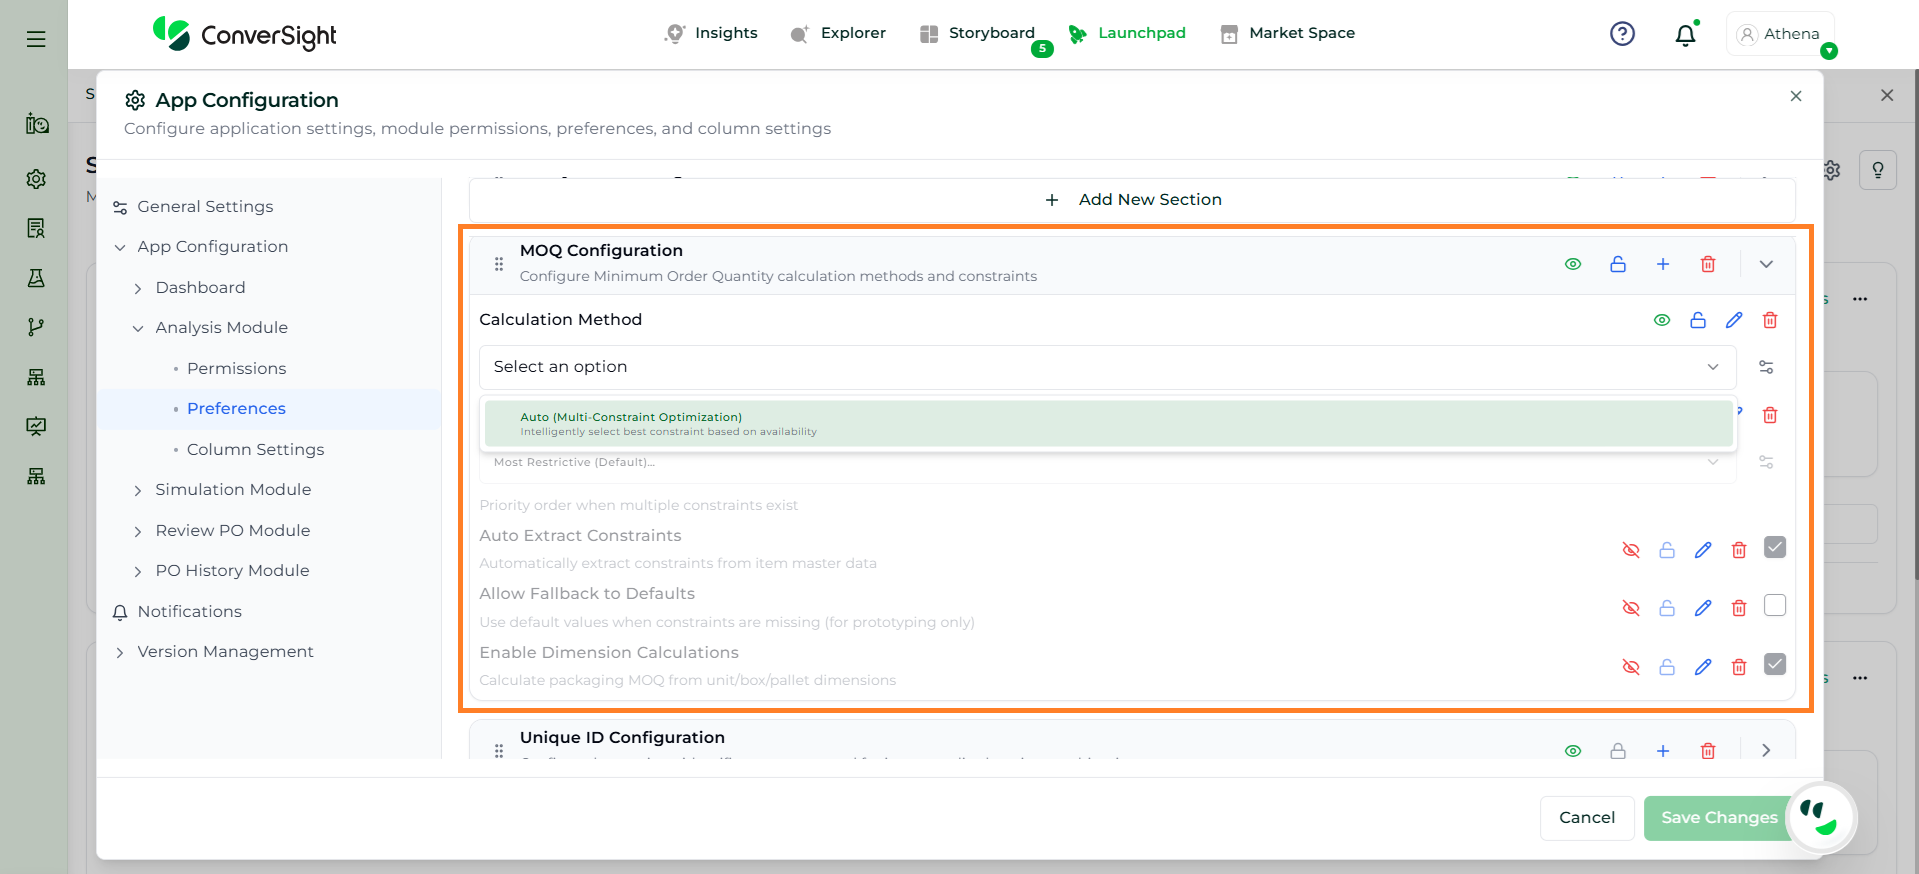
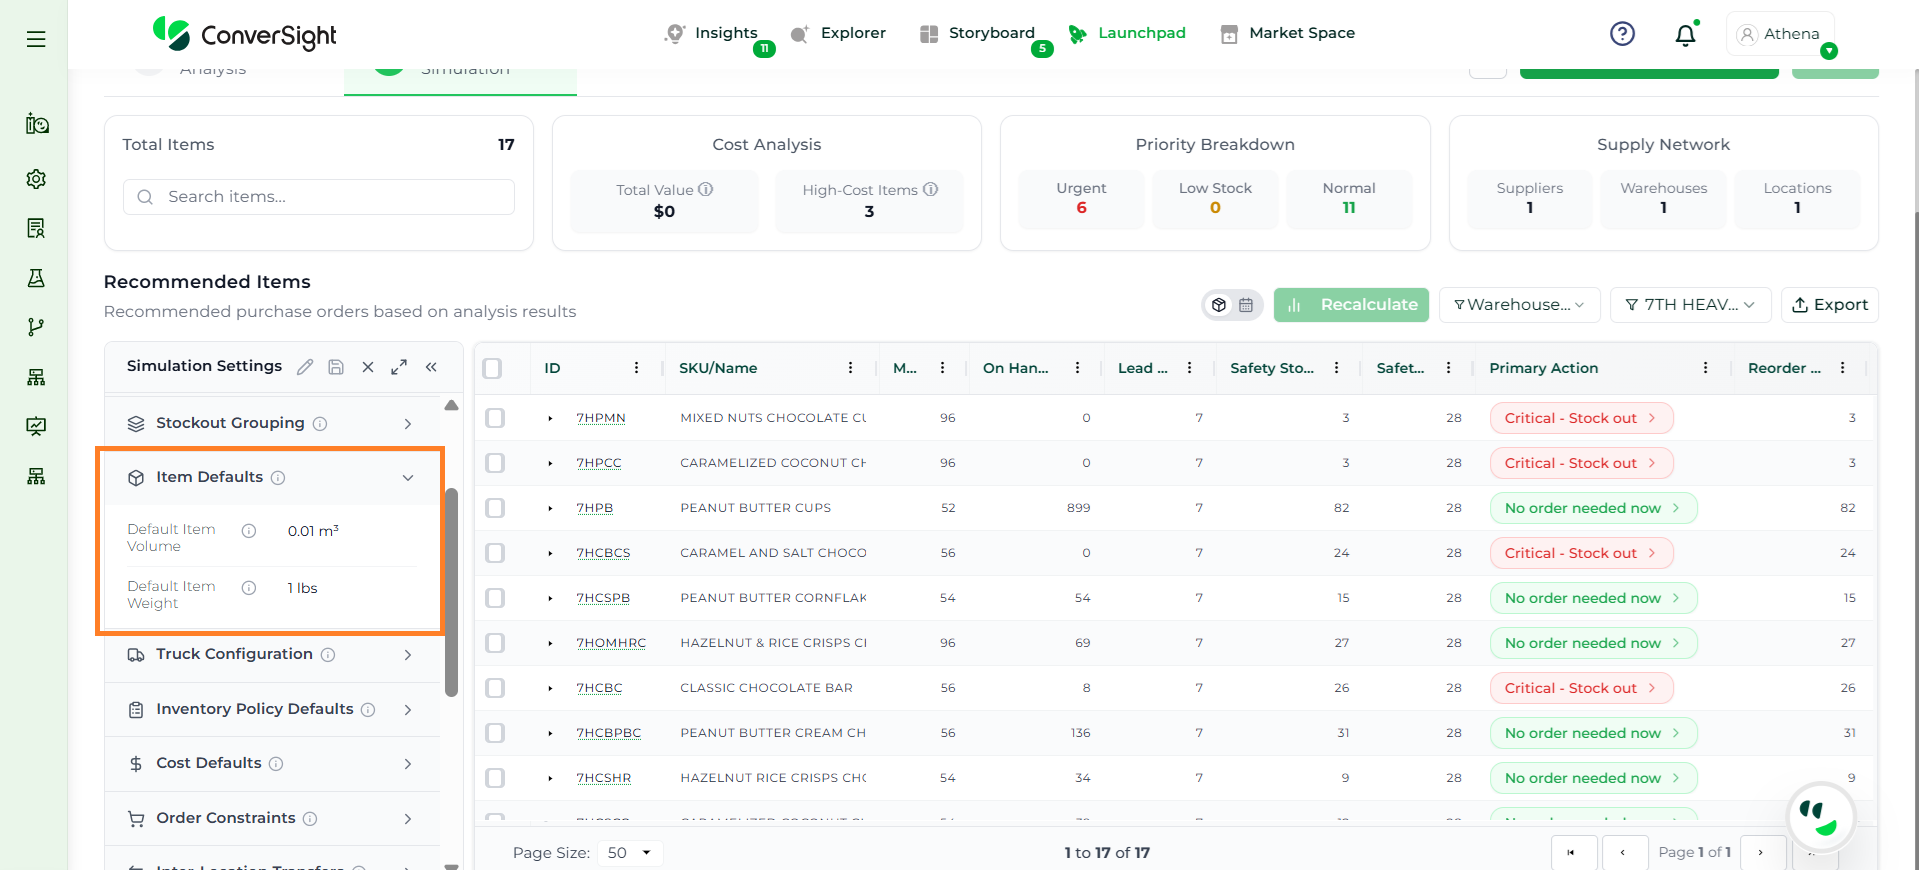
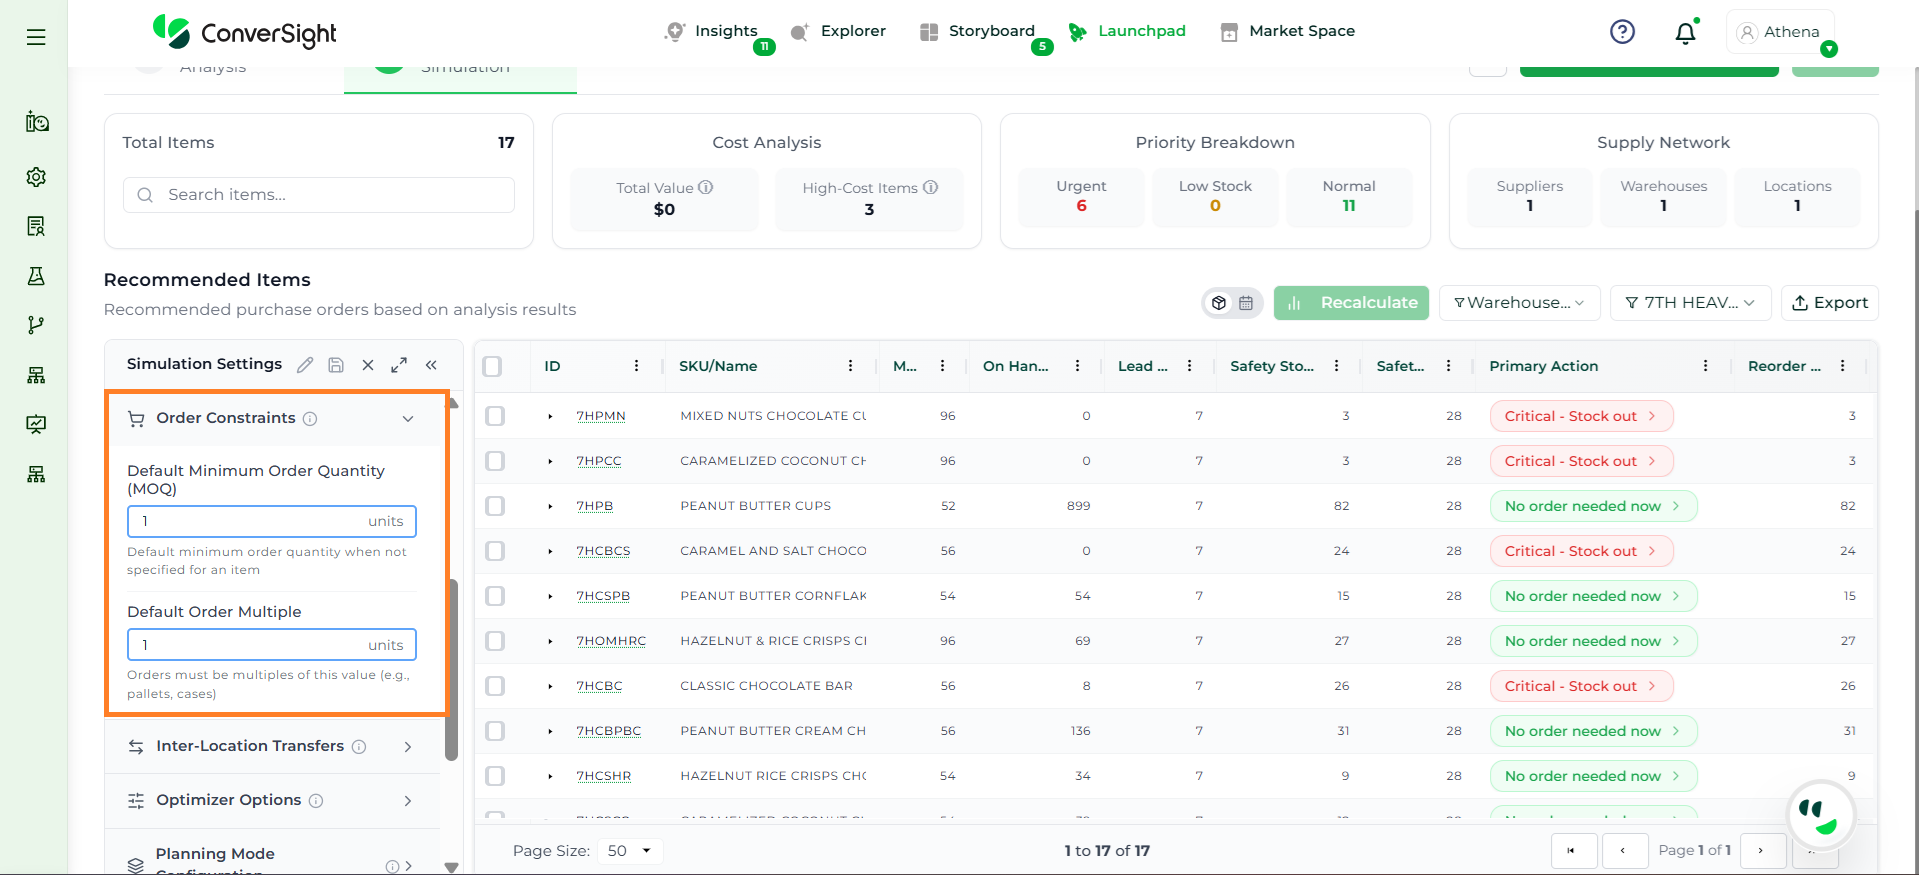
The Order Constraints section specifies default ordering rules such as minimum quantities and order multiples when item-specific values are not available.
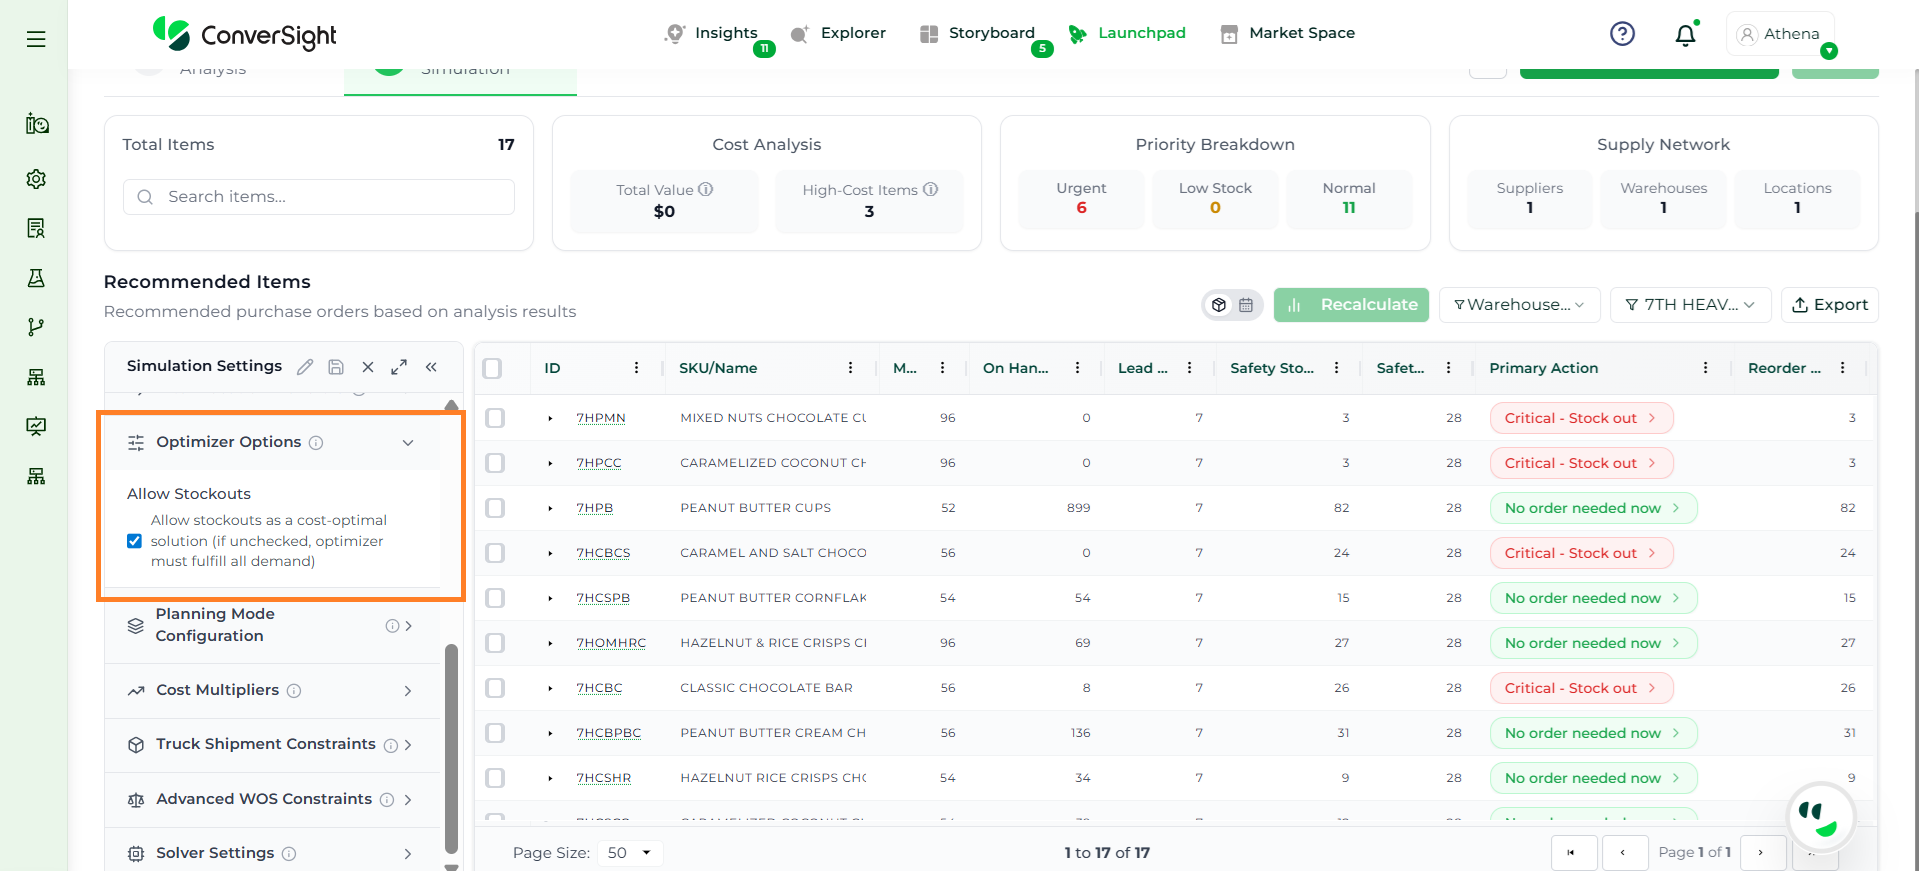
The Optimizer Options section defines system-level behaviors that control how the optimization engine balances constraints, validations, and planning flexibility.
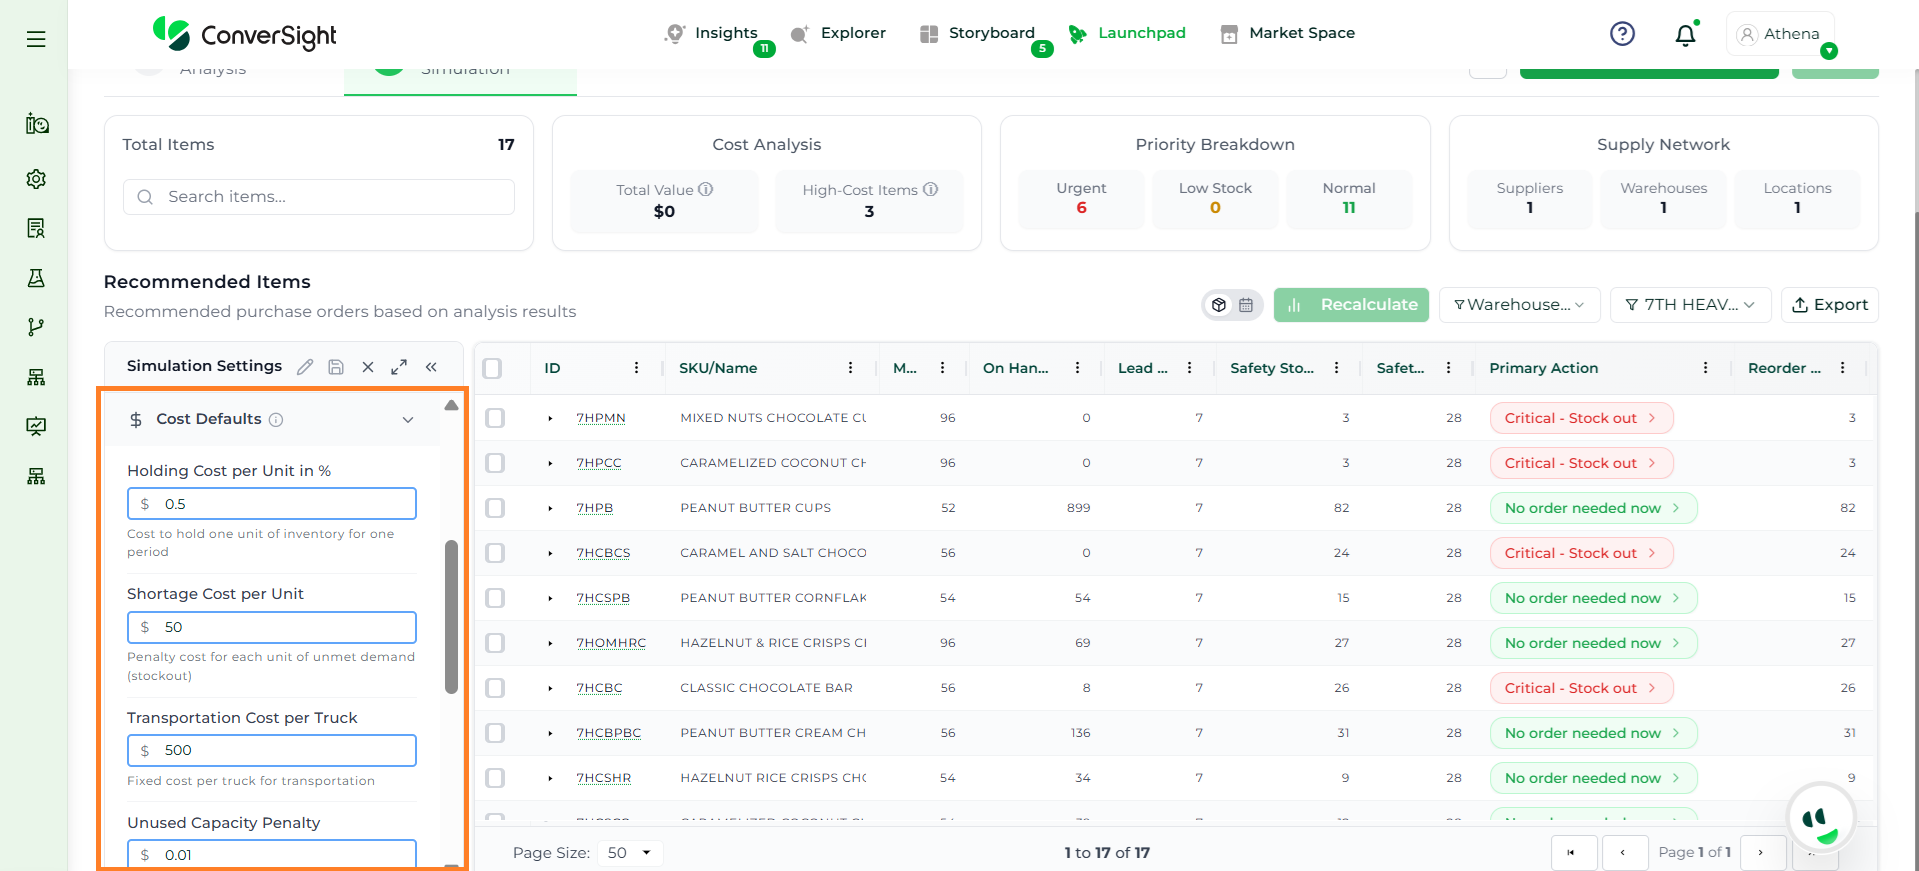
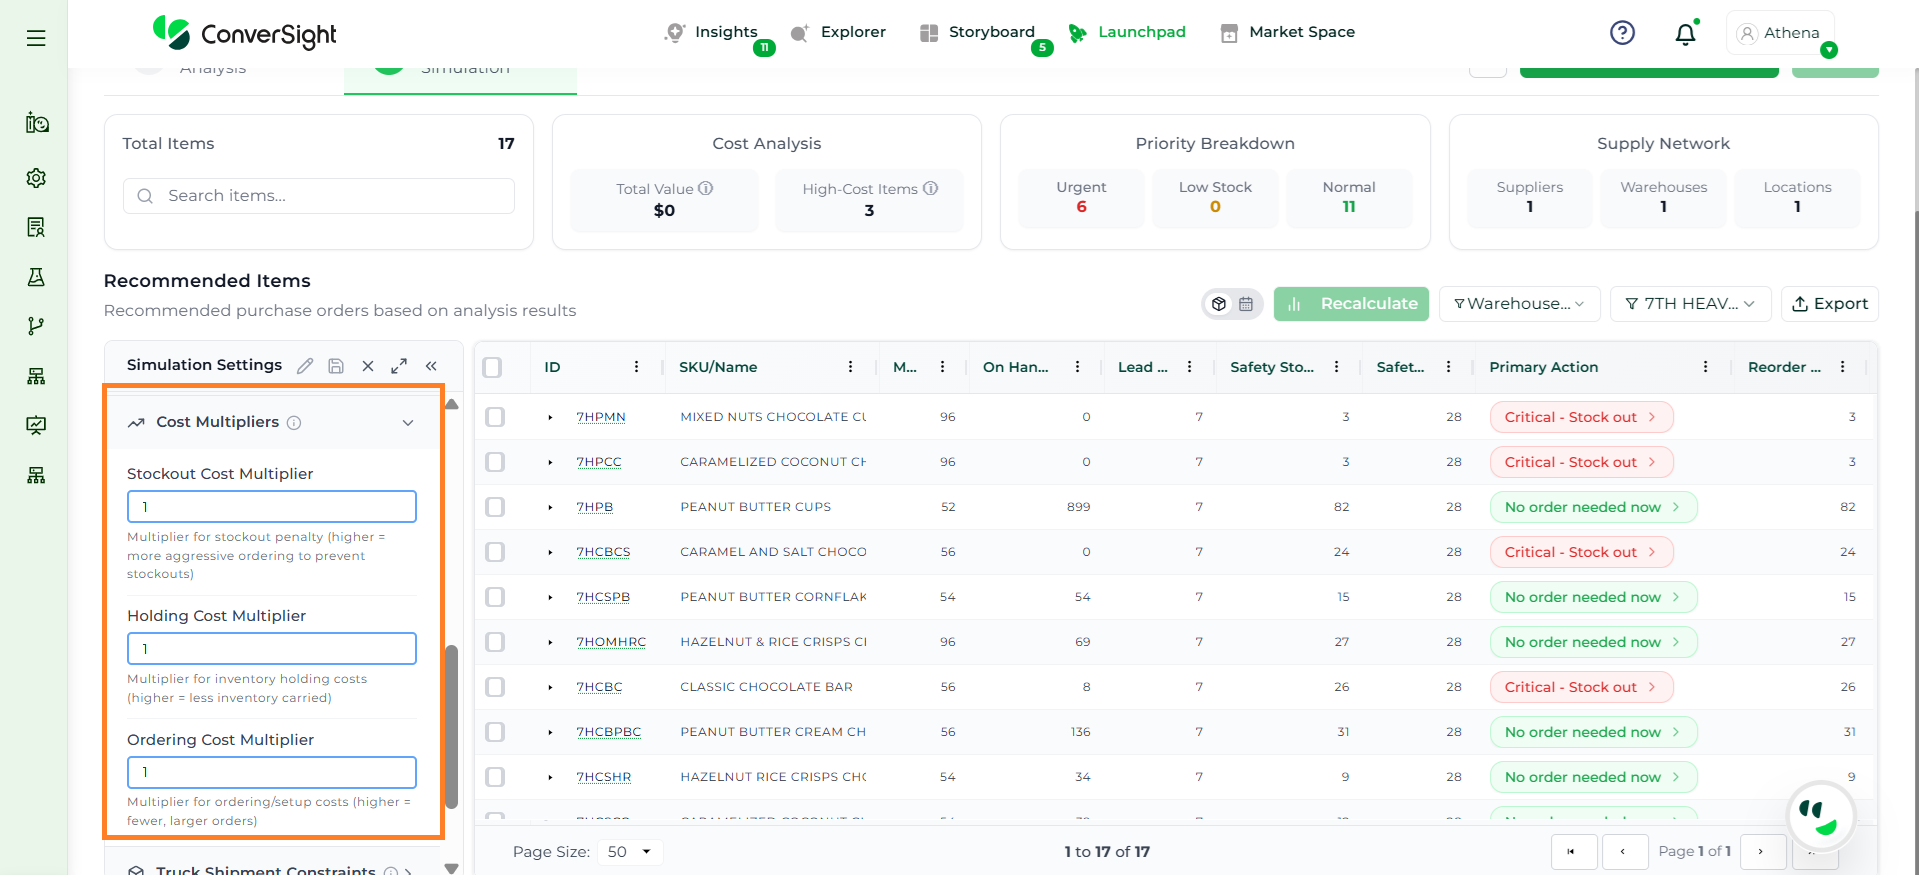
The Cost Multipliers section adjusts the relative importance of different cost factors, influencing how aggressively the system prioritizes stockouts, holding, and ordering.
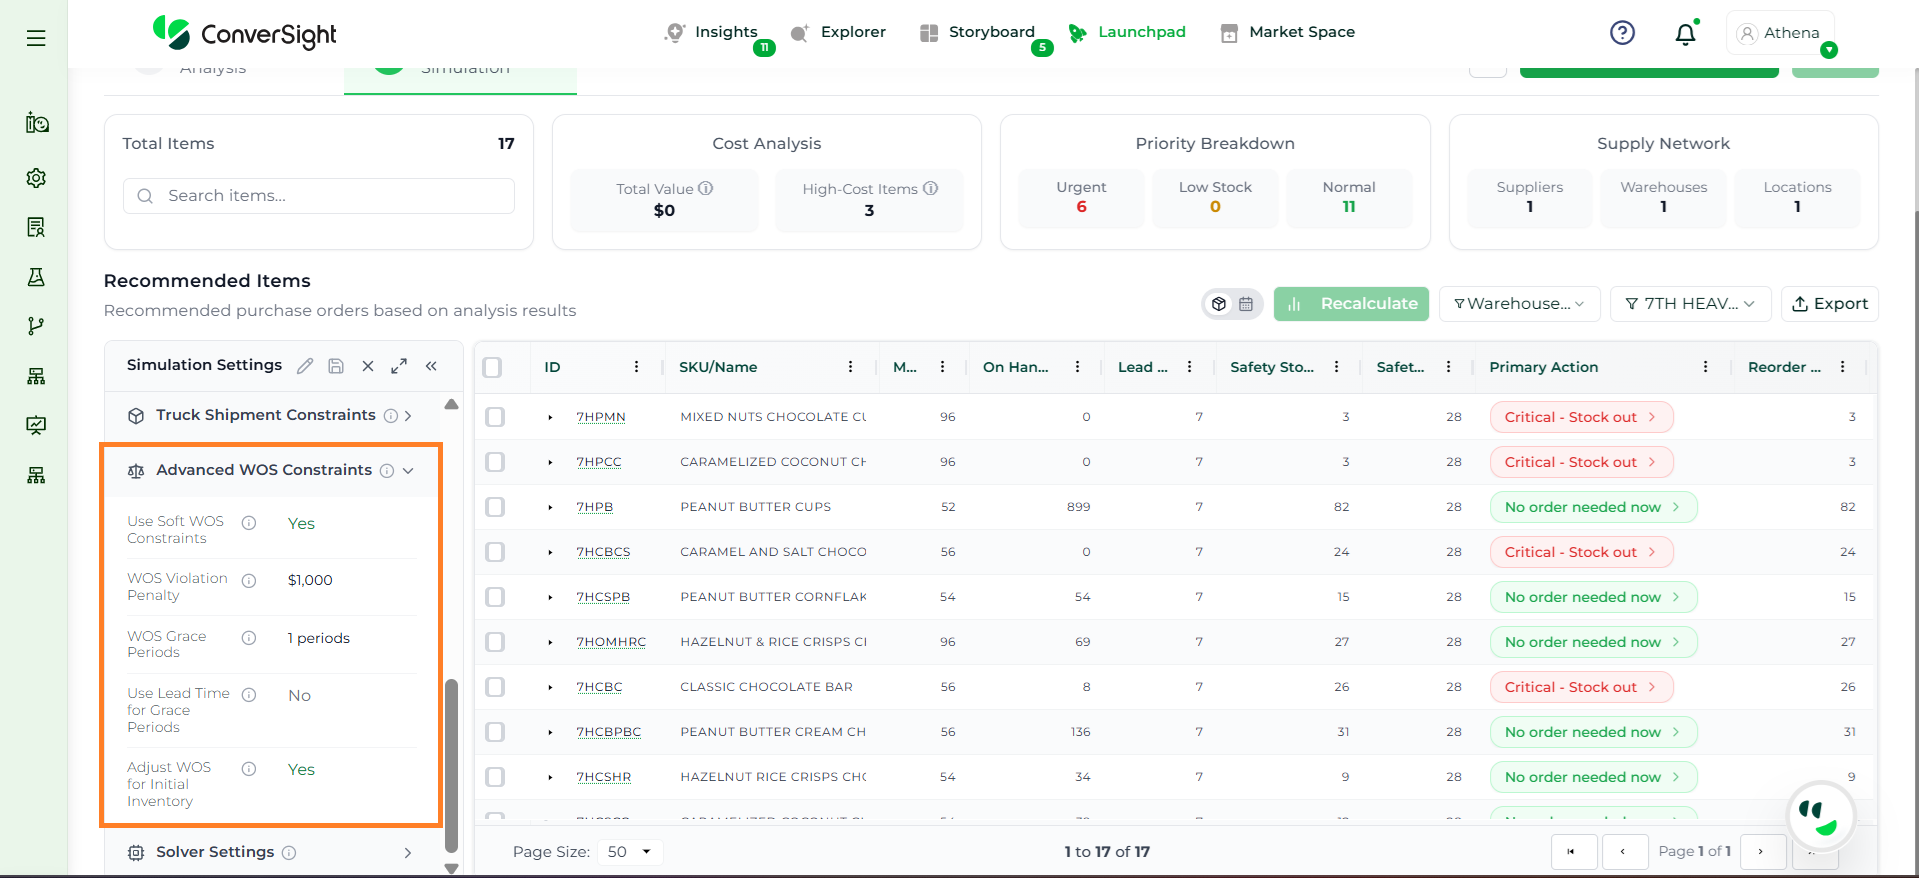
The Advanced WOS Constraints section provides additional flexibility in managing weeks of supply by allowing controlled deviations and applying penalties when limits are exceeded.
The Solver Settings section controls how the optimization engine executes, including performance limits, computational resources, and solution flexibility.
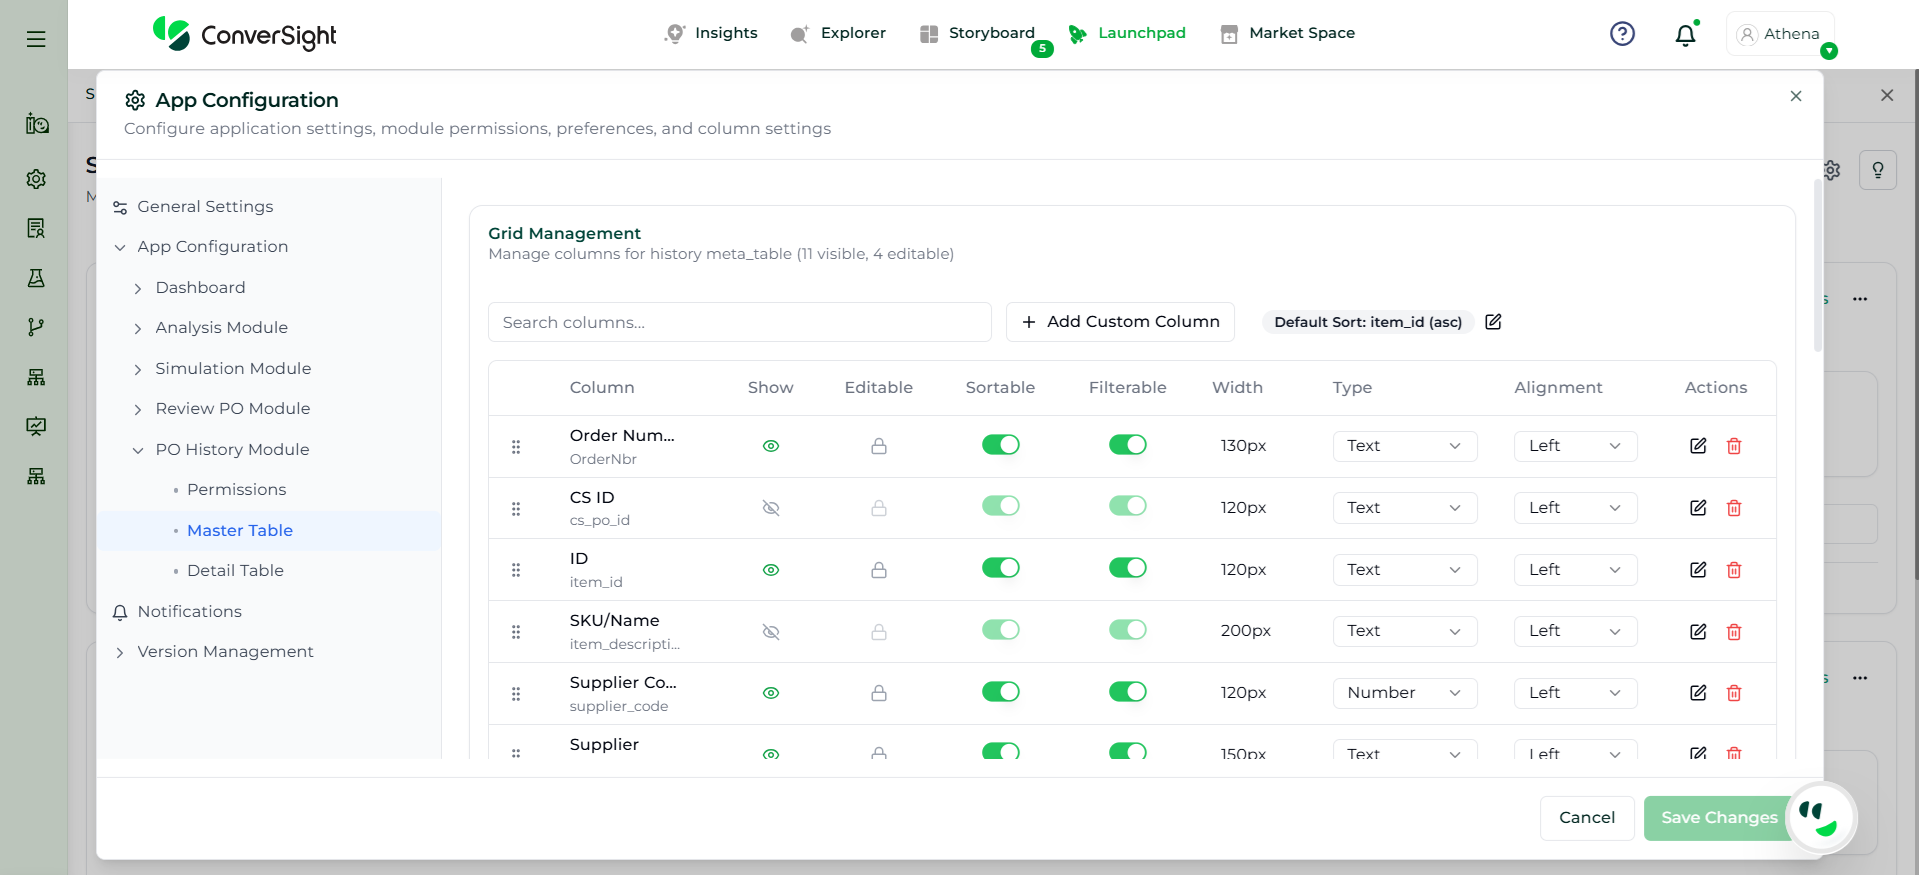
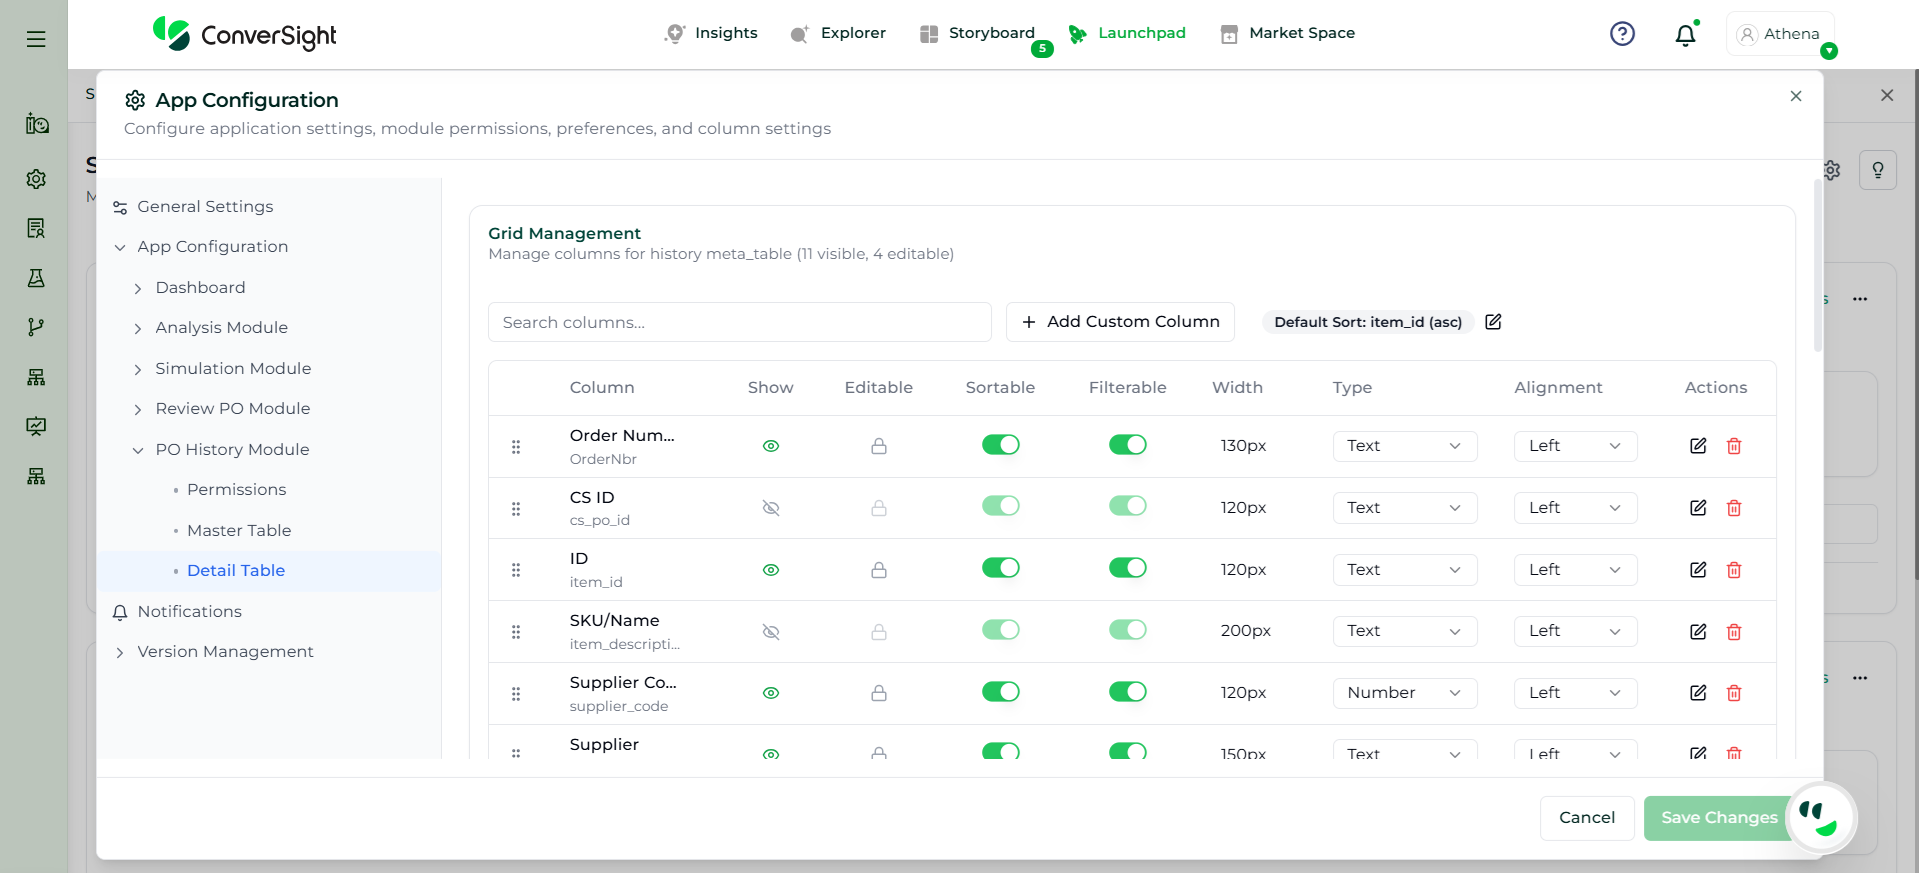
The Column Settings section allows administrators to configure how columns are displayed and managed within the Analysis grid. It helps control visibility, formatting, and user interaction with data, ensuring a more structured and user-friendly analysis experience.
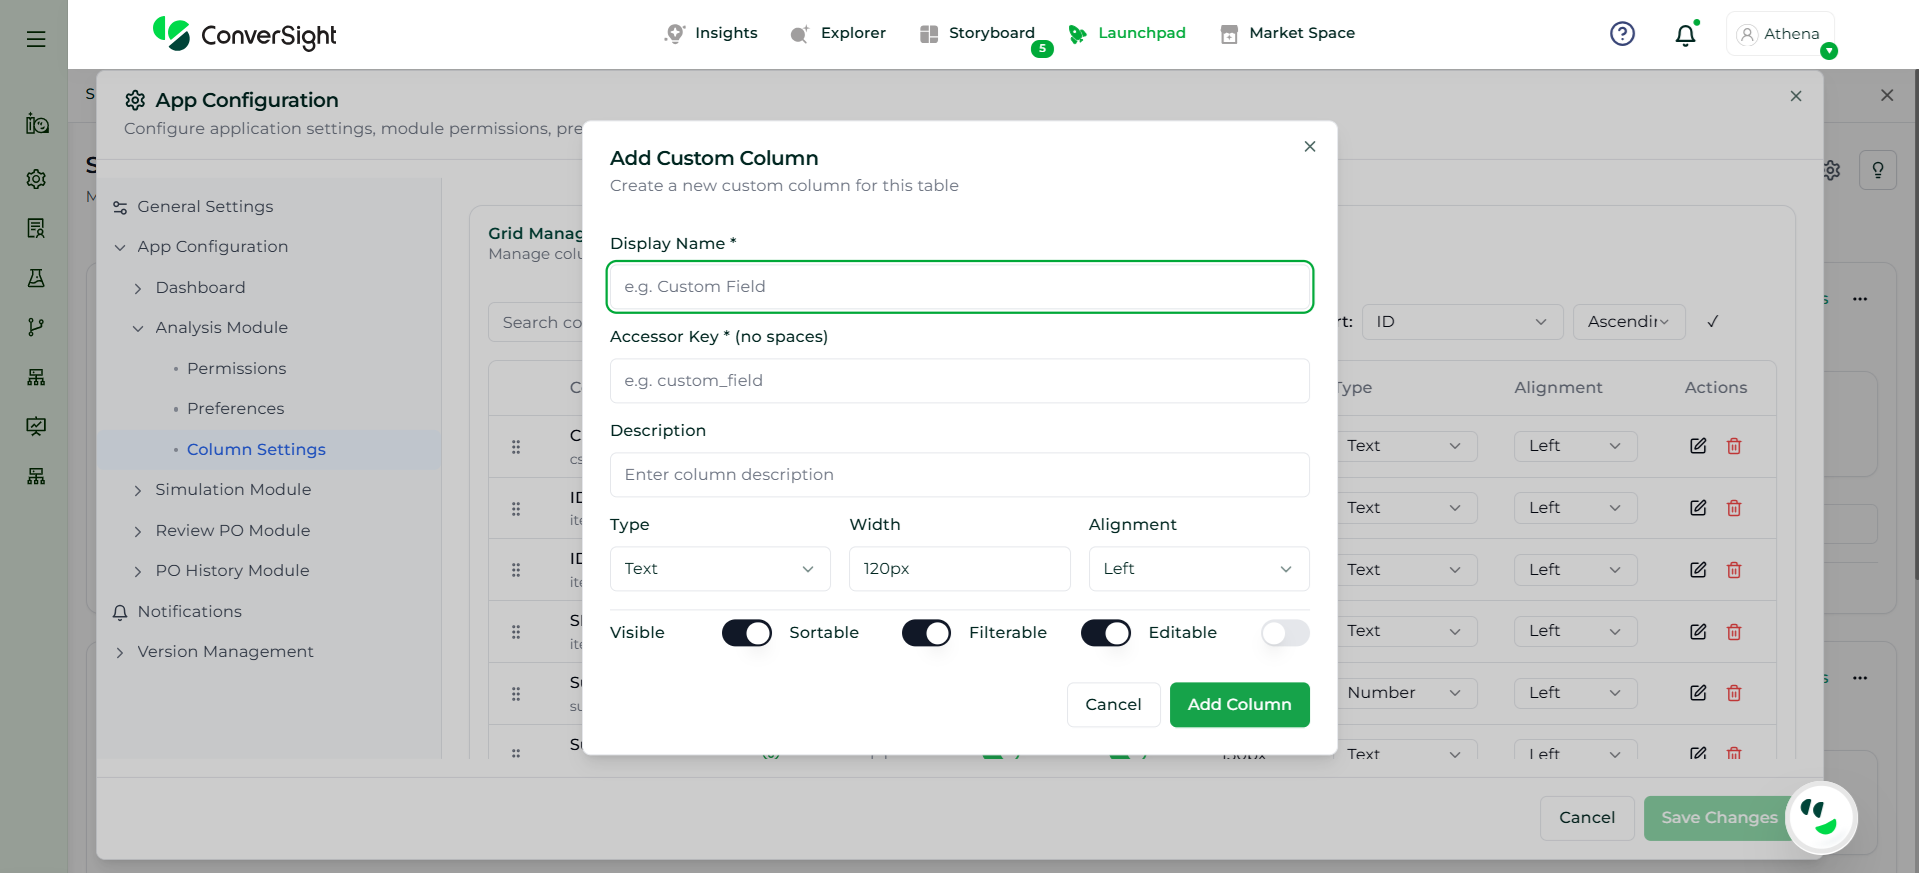
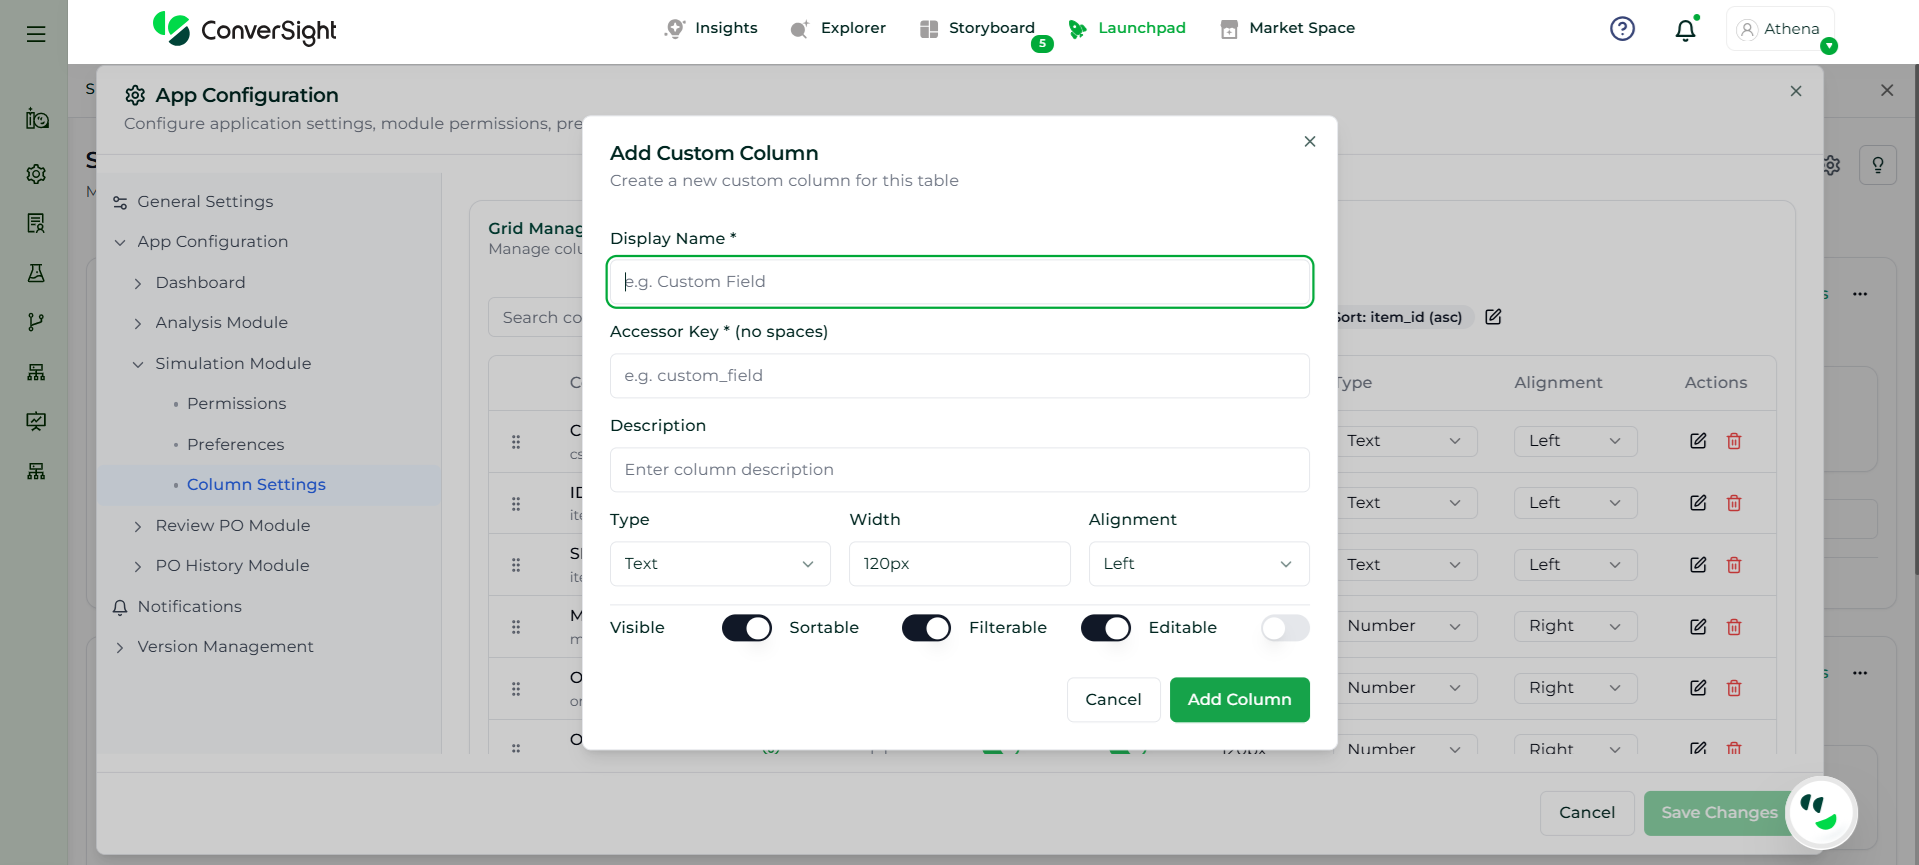
The Add Custom Column option enables users to create and configure additional fields within the simulation grid to capture business-specific data. Users must provide a Display Name, which defines how the column appears in the interface, along with an Accessor Key, which acts as a unique system identifier. An optional Description can be added for clarity.
Users can define the data type (text, number, date, boolean, or currency) to ensure proper formatting and usage. Layout properties such as column width and alignment can also be configured for better readability.
Additionally, users can control column behavior by enabling or disabling:
Visibility
Sorting
Filtering
Editability
Once created, the custom column is added to the simulation grid, allowing users to view, update, and analyze additional data points, enhancing flexibility and decision-making.
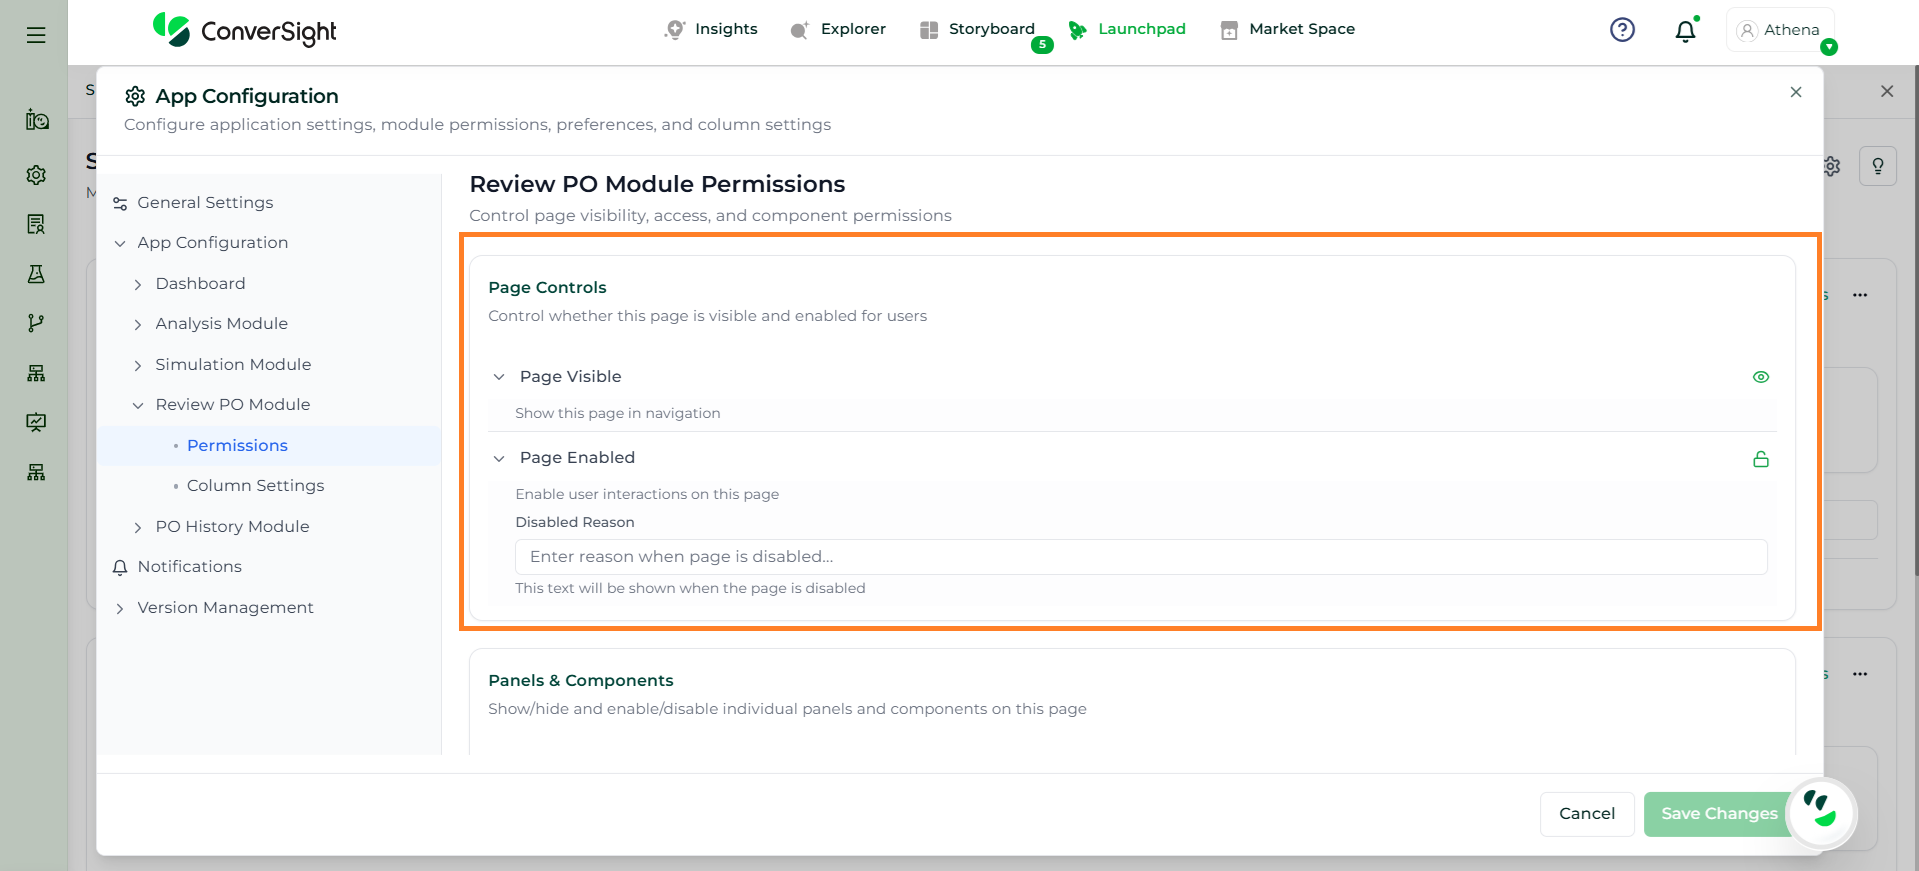
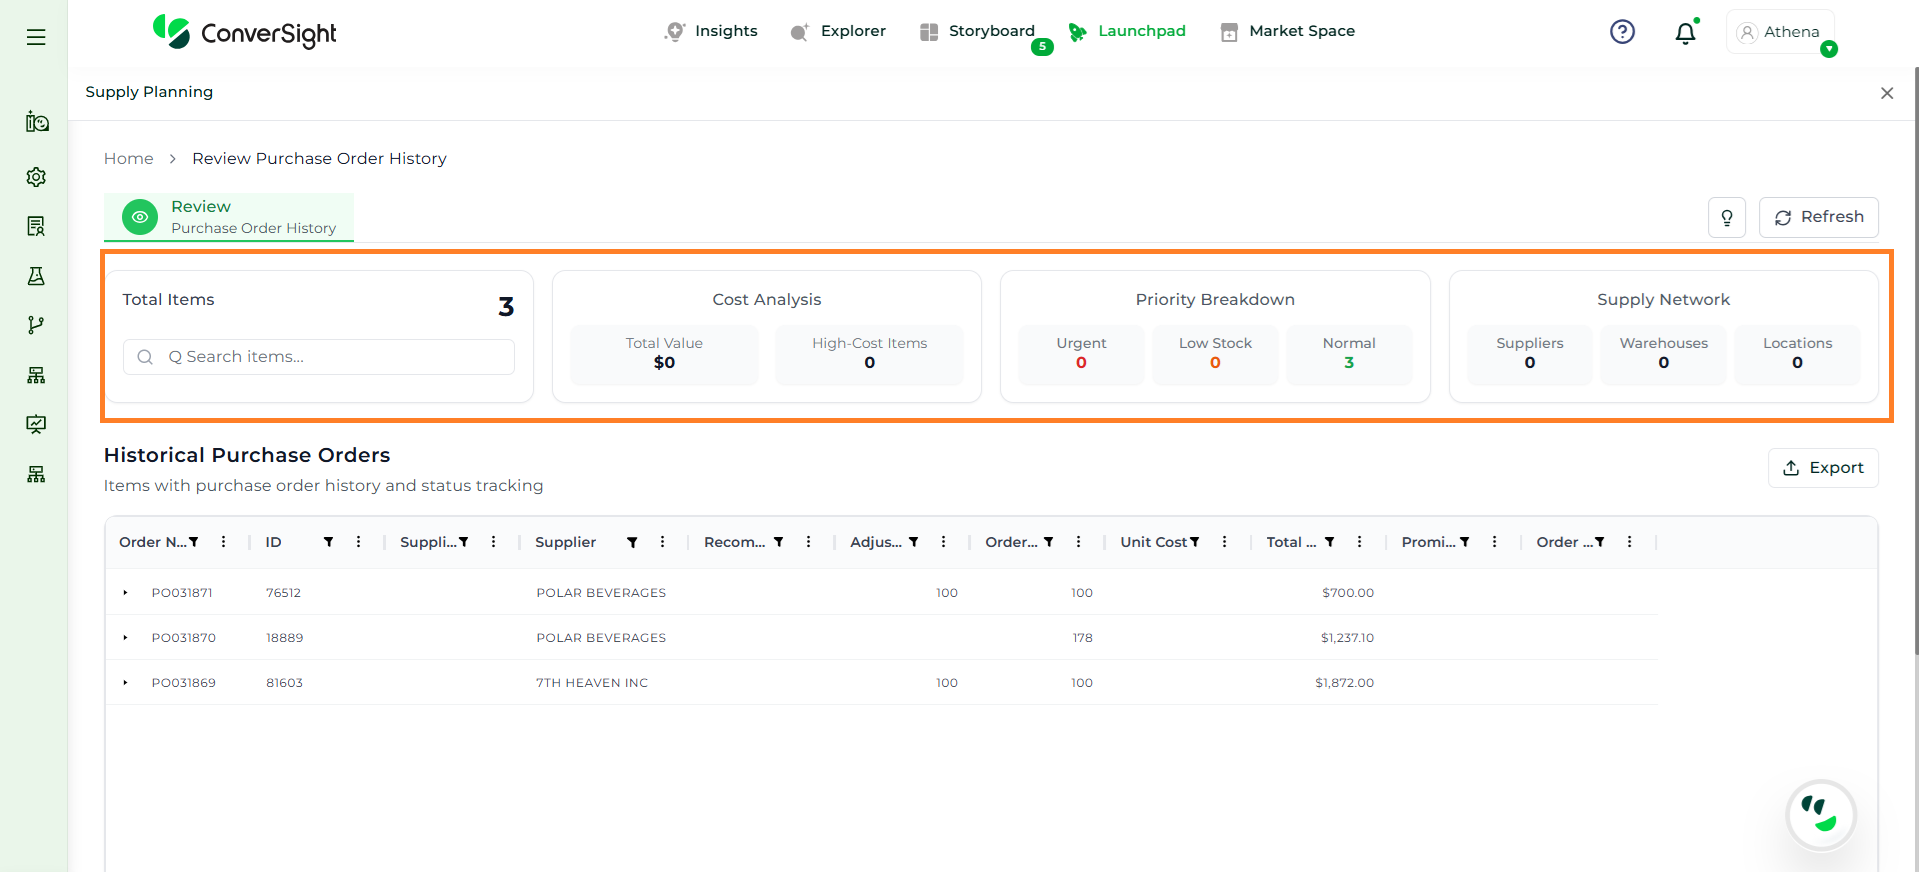
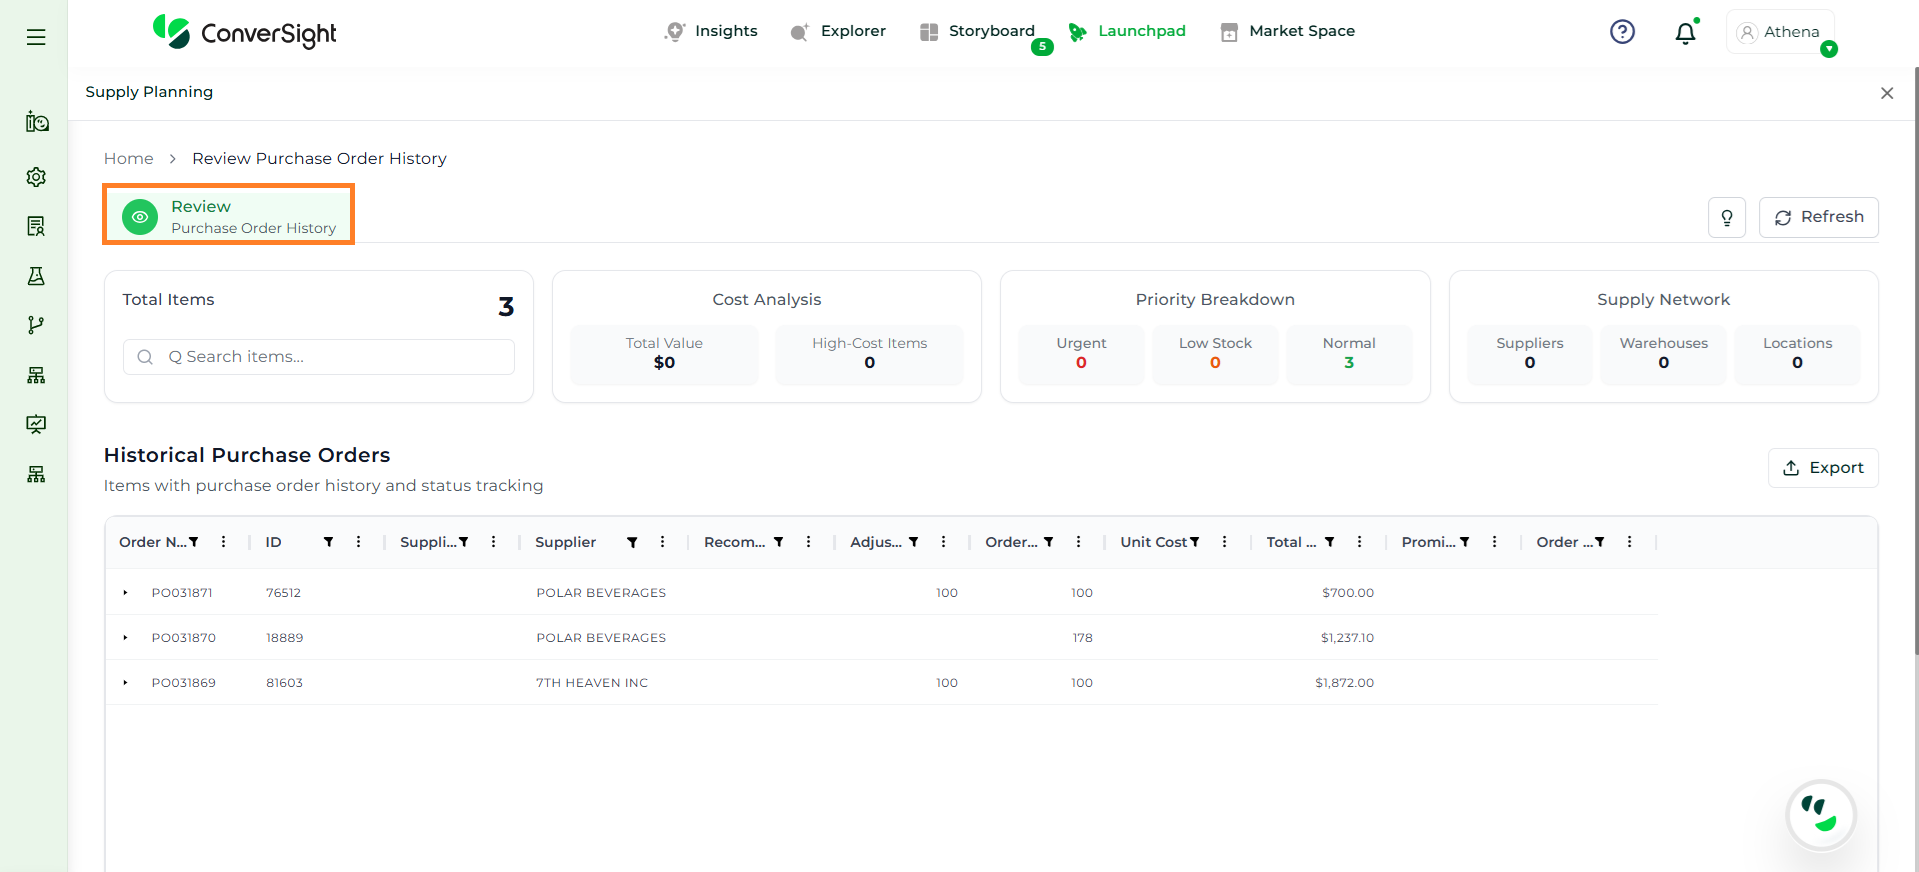
Provides a comprehensive view of purchase order history with configurable master and detail tables, enabling users to monitor, analyze, and manage past procurement data efficiently.
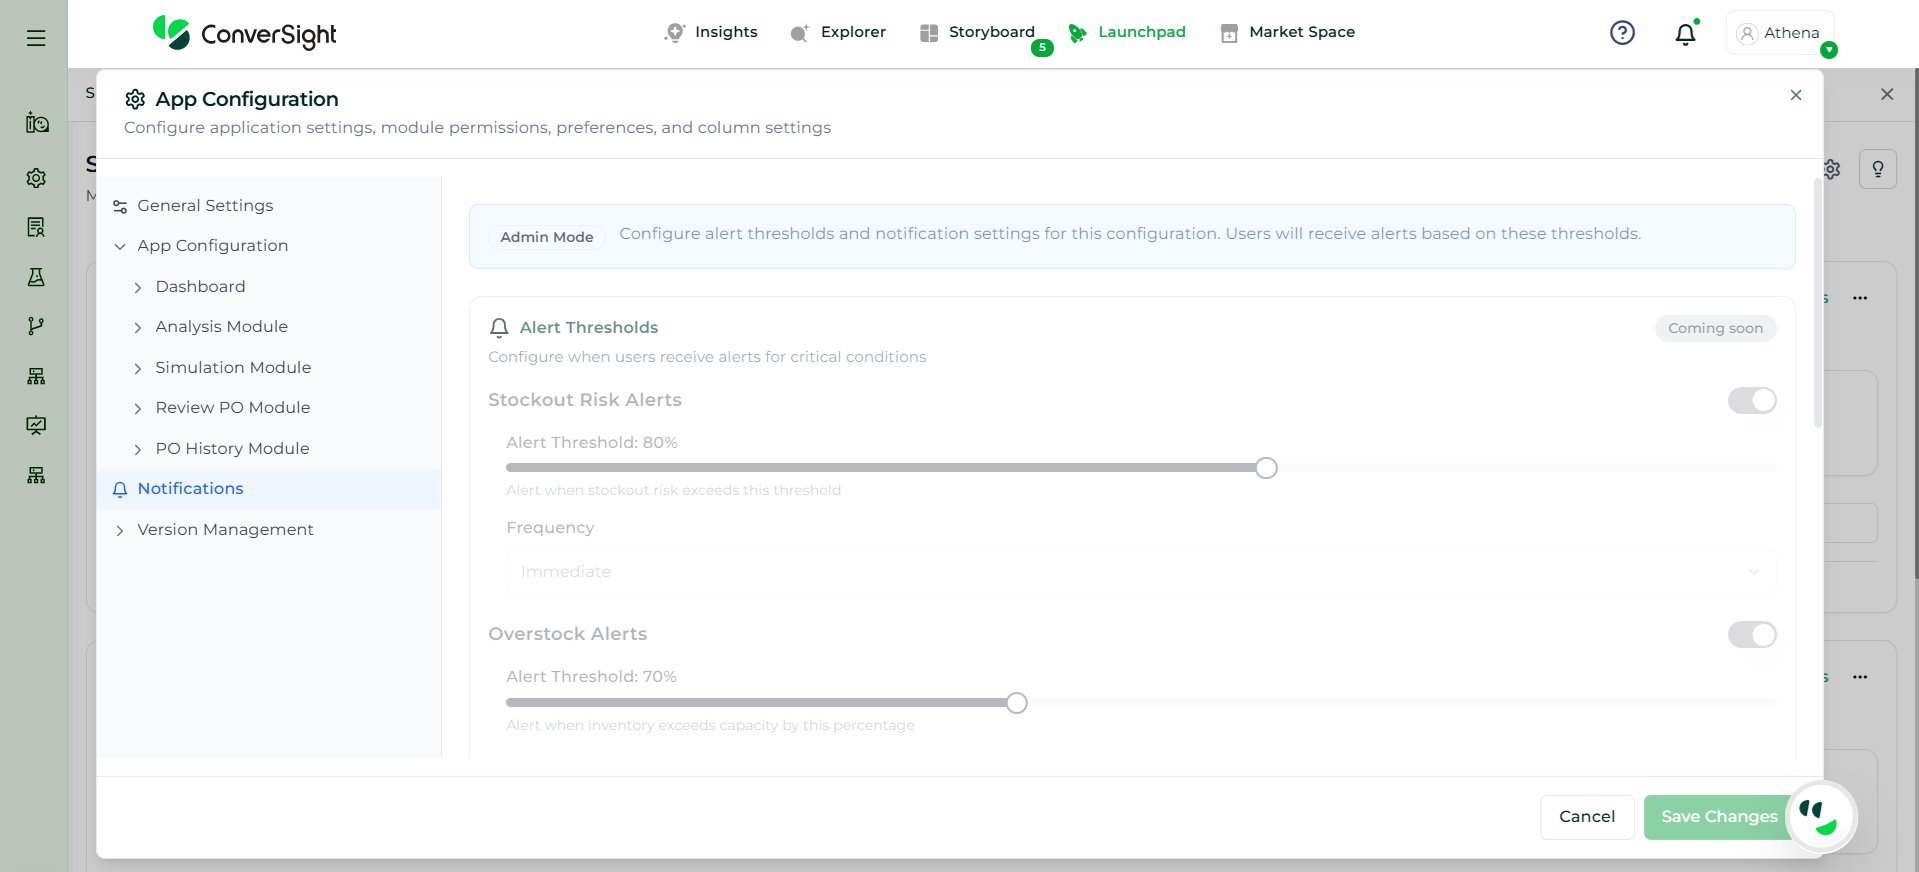
The Notifications section helps users stay informed about key planning events and system changes.
Users can configure alert thresholds for scenarios such as:
Stockout risks
Overstock conditions
Cost variances
When thresholds are exceeded, the system triggers alerts to enable faster decision-making.
This section also supports email notifications, allowing alerts to be sent to selected recipients. Users can define a primary email and additional recipients to ensure proper communication.
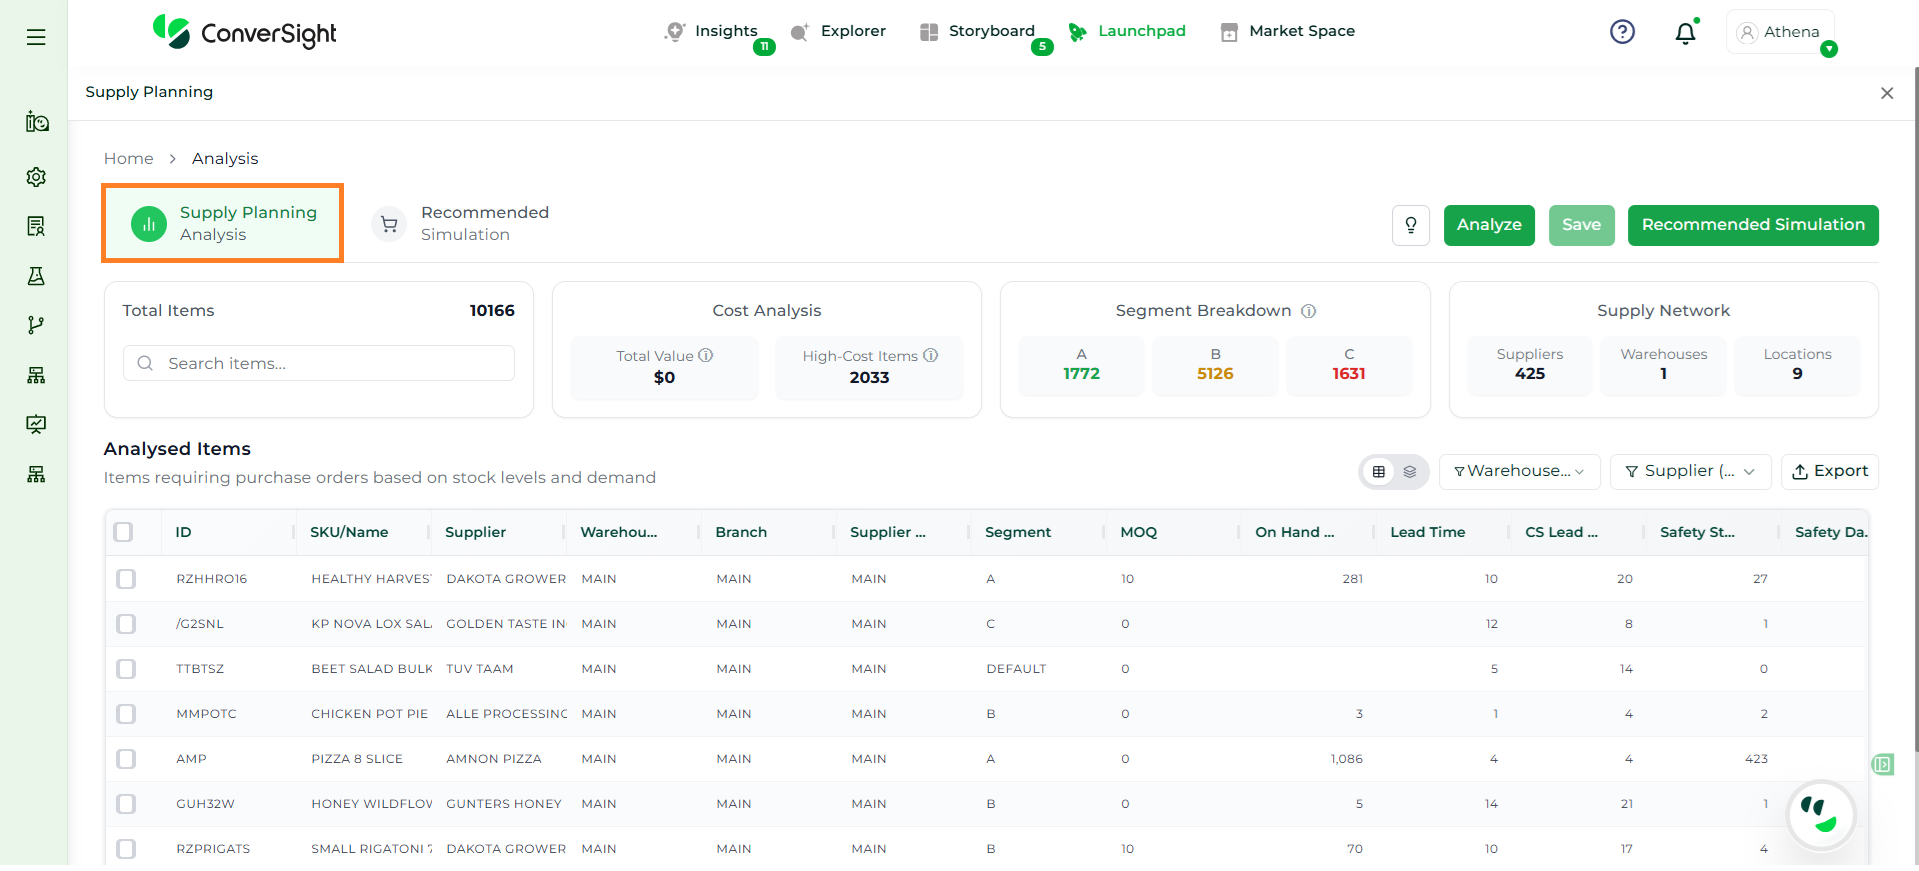
In Supply Planning, understanding your inventory before taking action is critical to make accurate and confident decisions. The Analysis module in ConverSight Supply Planning enables business users to evaluate current stock levels, demand patterns and supply conditions in a single workspace. Built as the first step in the planning workflow, the Analysis module transforms raw inventory and demand data into meaningful insights. It allows users to configure planning parameters, review item-level performance, and identify what requires attention before moving to simulation or purchase planning. By combining visibility, control and guided actions, the module ensures users can move from data to decisions with clarity.
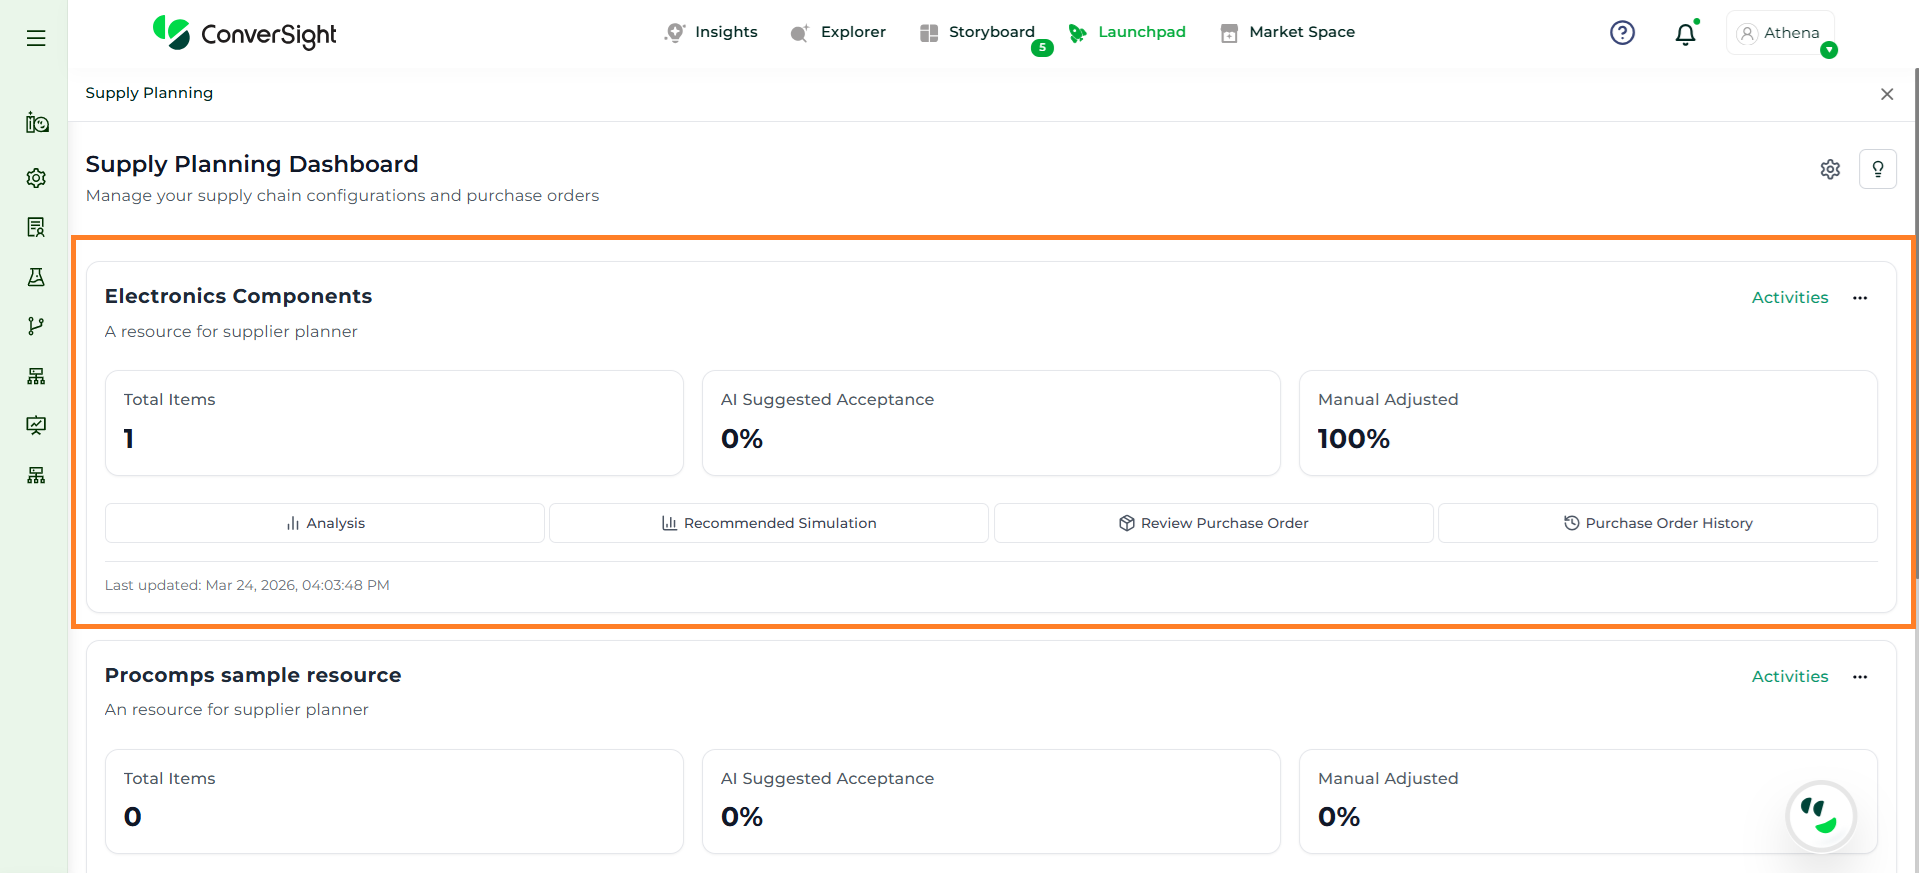
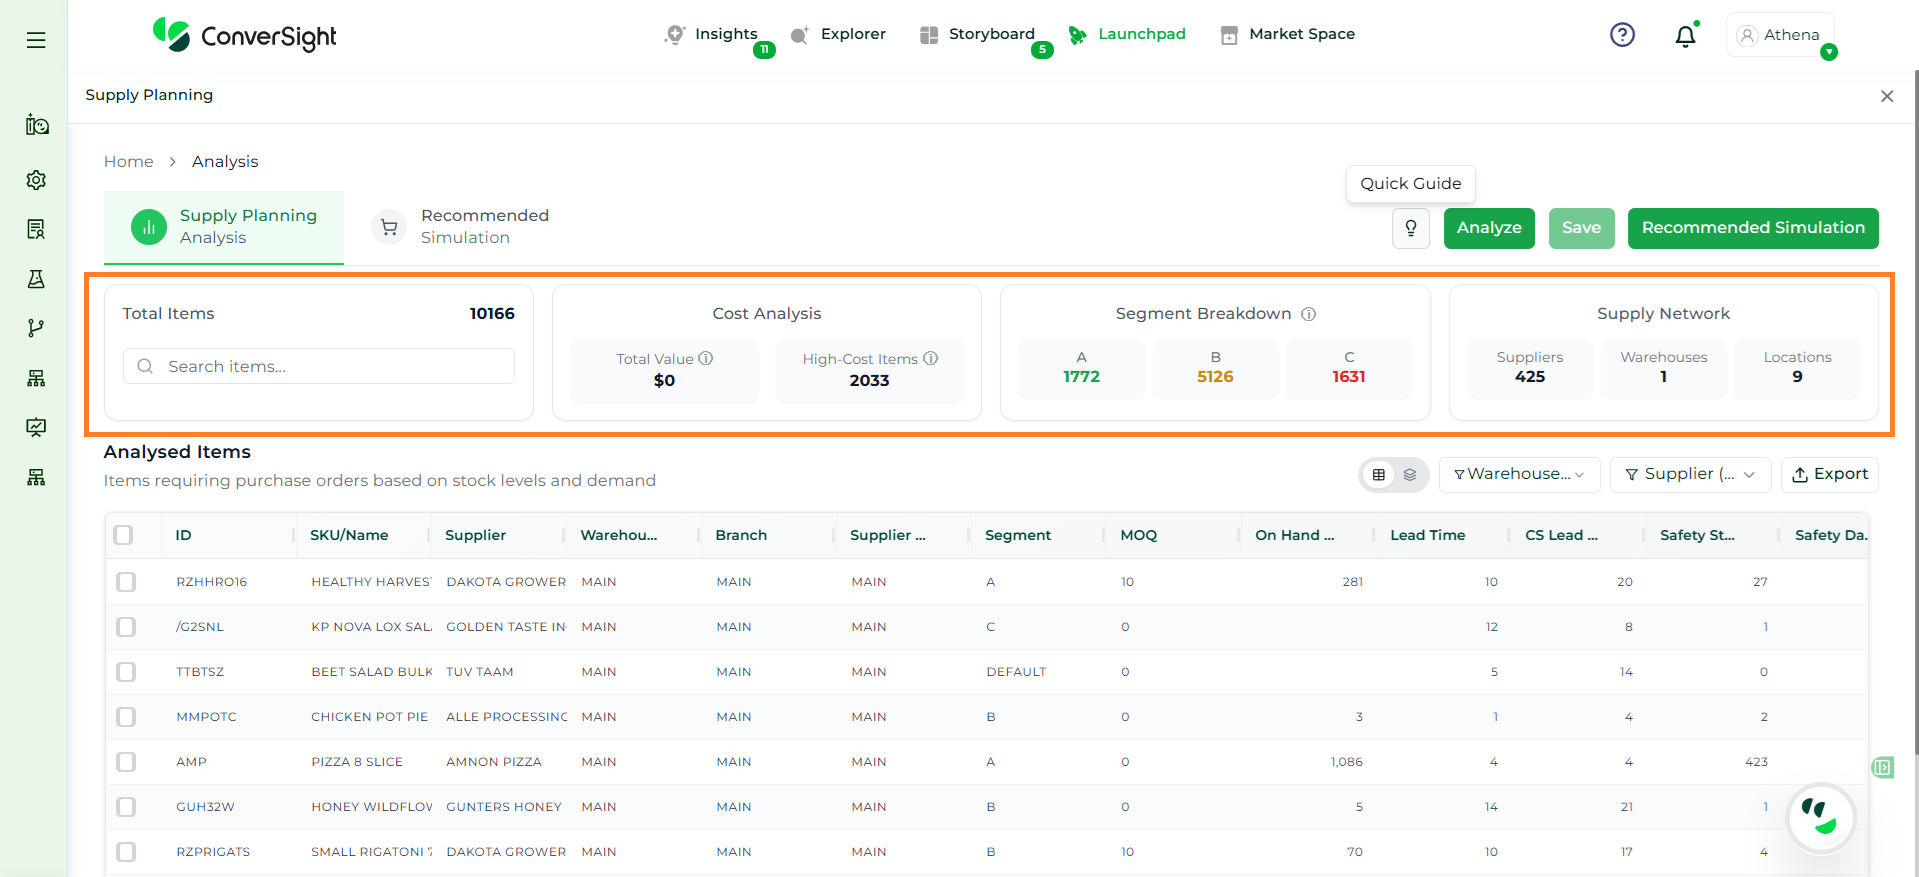
The Analysis page provides a consolidated view of inventory data along with key summaries that help users quickly understand the overall situation.
Section
Description
Total Items Being Analyzed
Displays the number of SKUs included in the analysis. It shows how many items are currently visible versus the total available, helping users understand the scope of the dataset. Users can use the search option to quickly locate specific items based on SKU, name, or supplier.
Cost Analysis Overview
Highlights the total inventory value and identifies high-cost items. These items typically require closer monitoring as they have a significant impact on working capital, budgeting, and supplier negotiations.
ABC Segmentation
Classifies items into A, B, and C segments based on their contribution to overall value. A-items require tight control, B-items need moderate monitoring, and C-items require basic oversight, helping users prioritize effectively.
Supply Network Overview
Provides visibility into the supply chain by showing the number of suppliers, warehouse locations, and distribution points involved. This helps users understand the operational complexity of the inventory being analyzed.
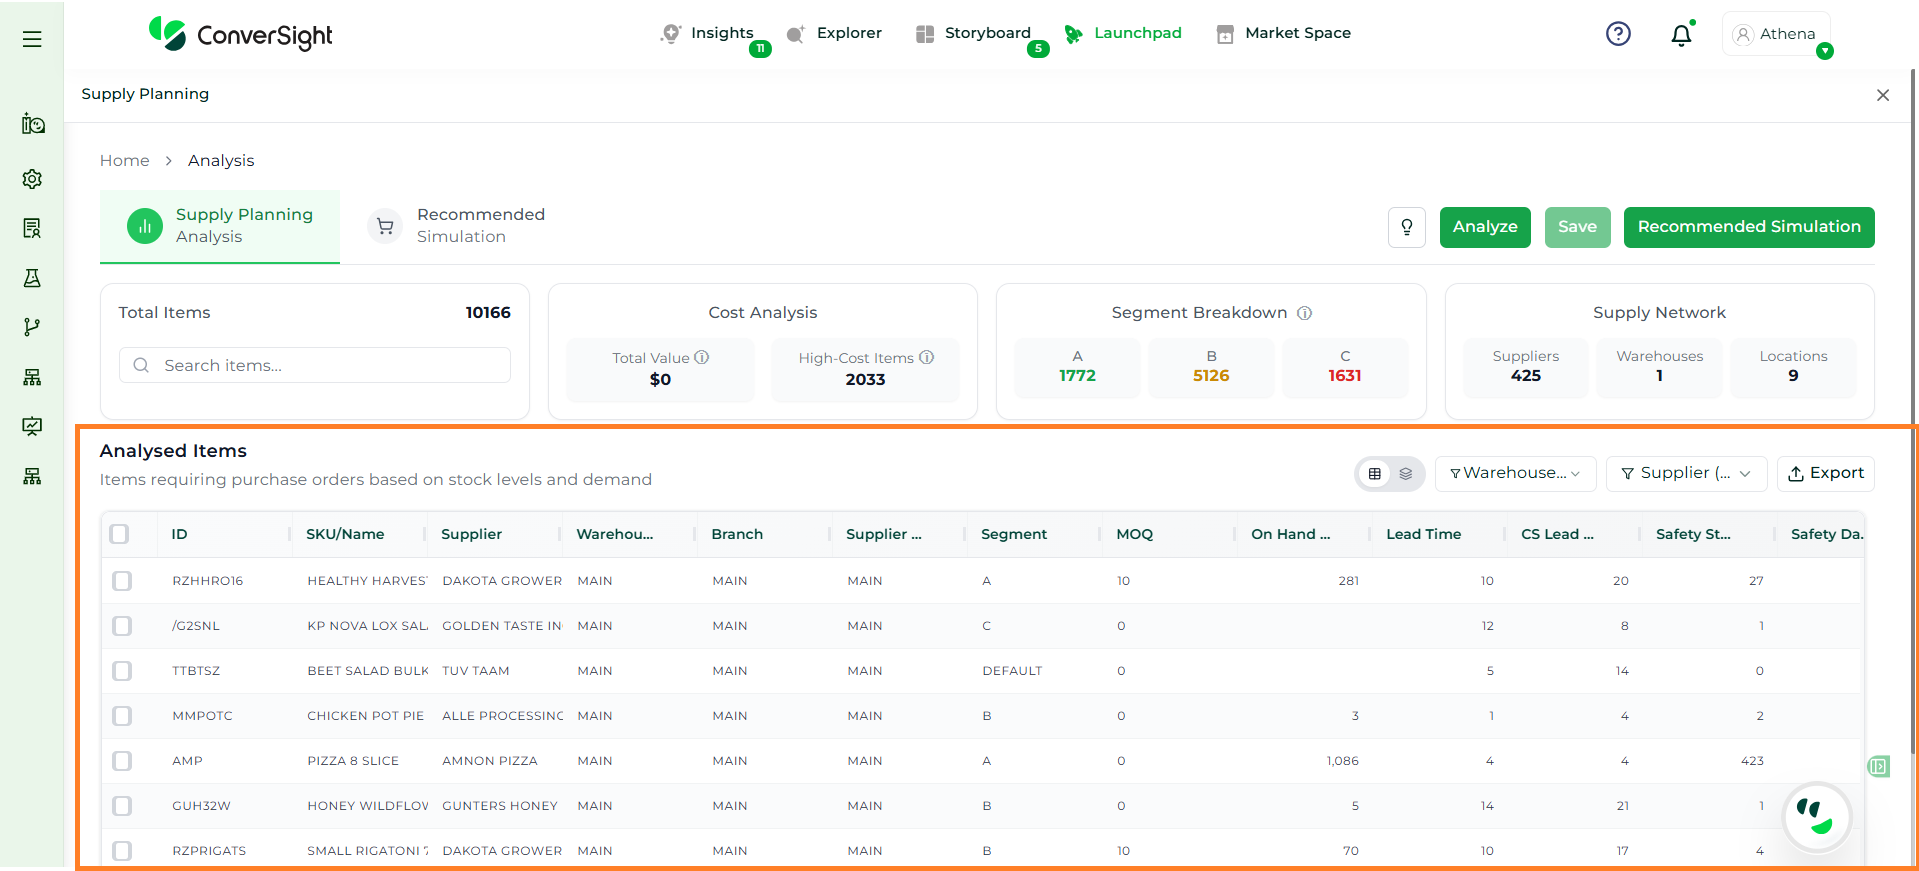
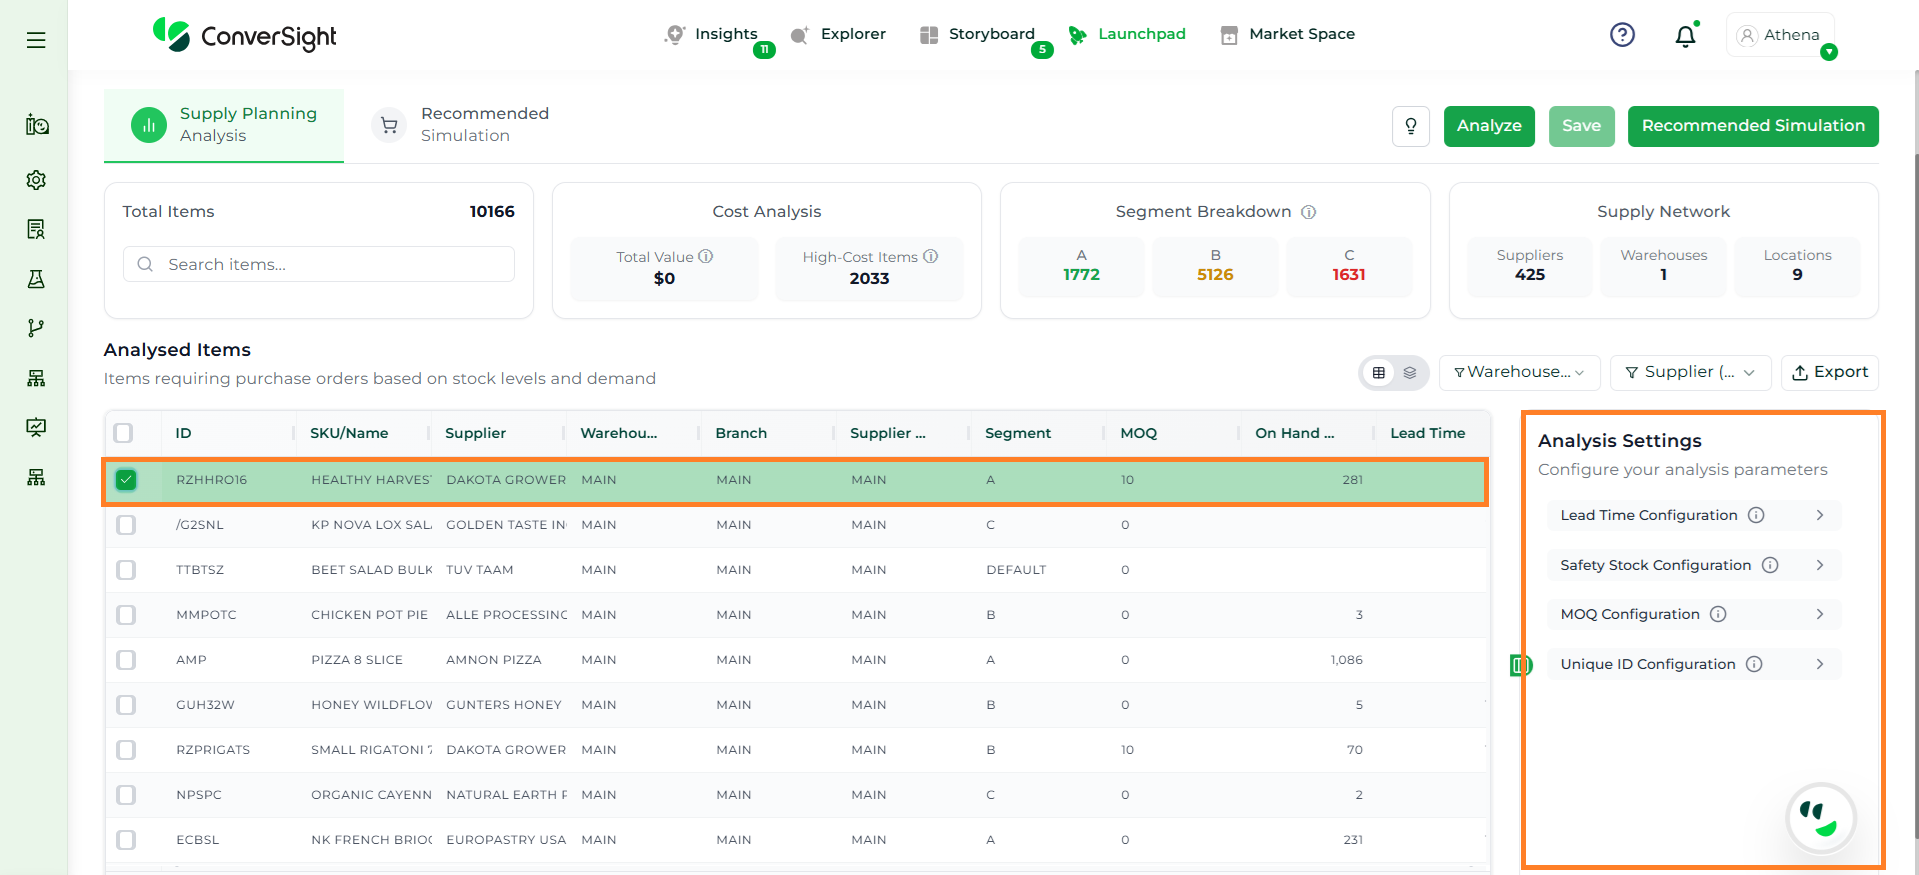
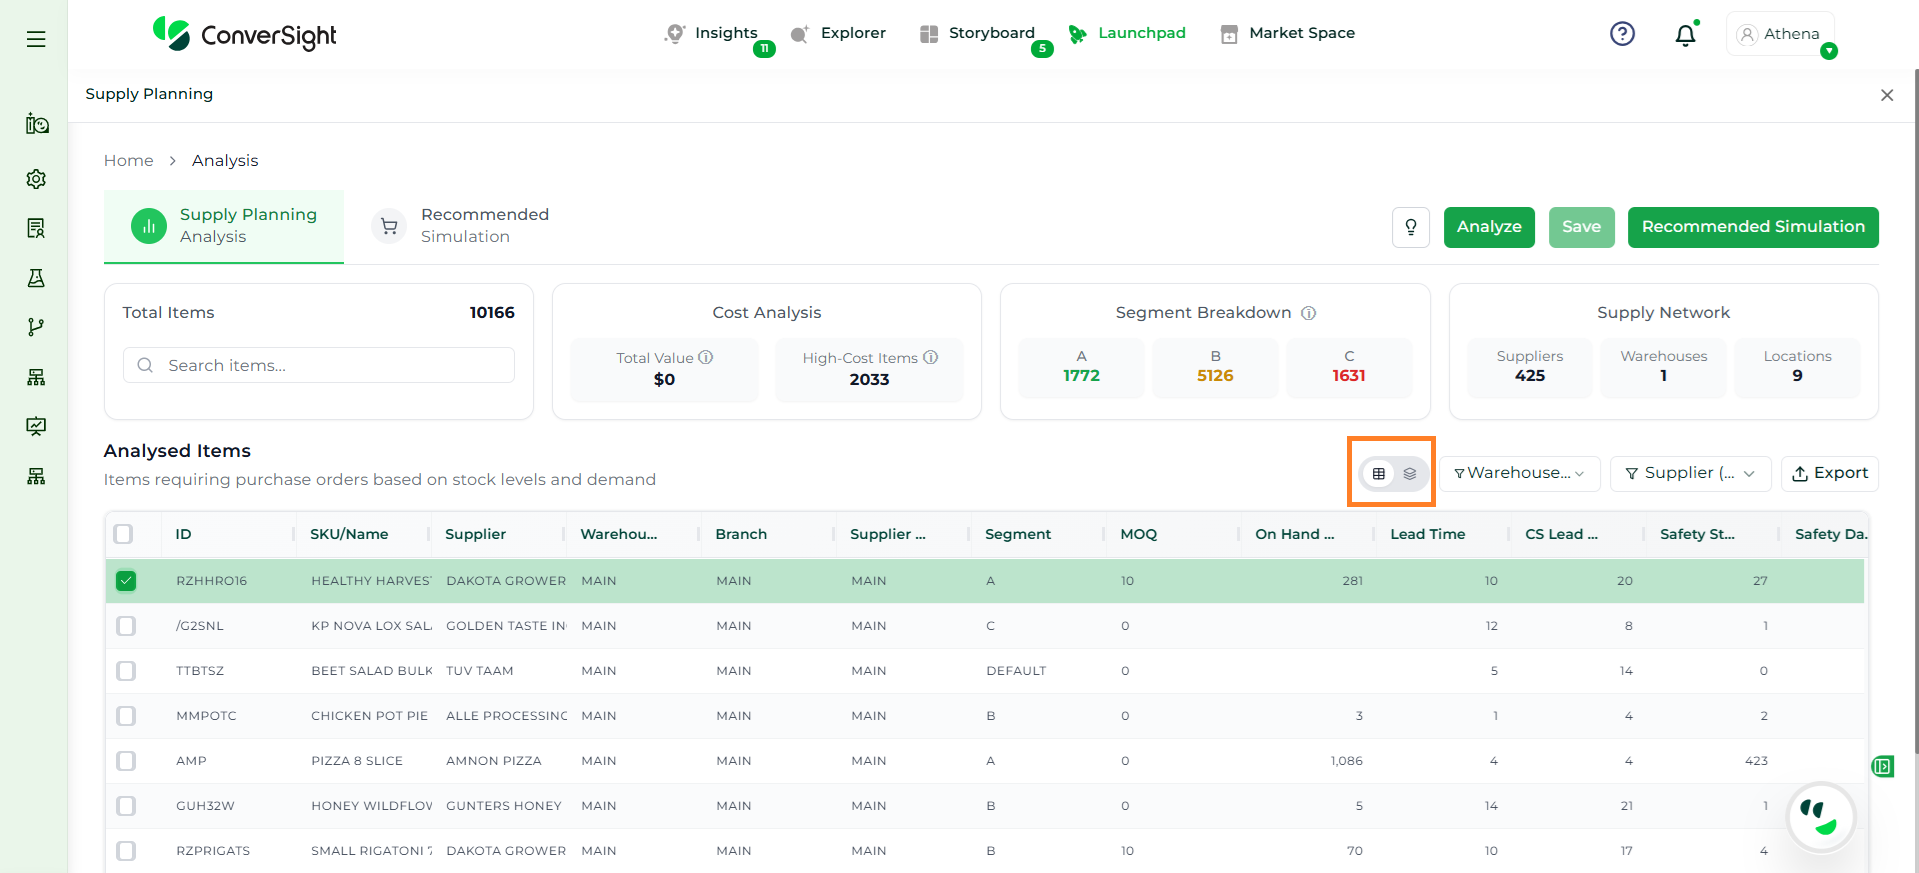
The Analysed Items section displays the detailed, item-level output of the analysis. It provides a structured table where each row represents a SKU and its associated planning data. This section helps users evaluate inventory position, demand behavior and planning parameters in one place, enabling informed decision-making.
Users can review stock levels, supplier details, lead times, safety stock and cost-related metrics directly within this grid. It also supports actions such as filtering, sorting, and exporting, making it easier to analyze large datasets efficiently.
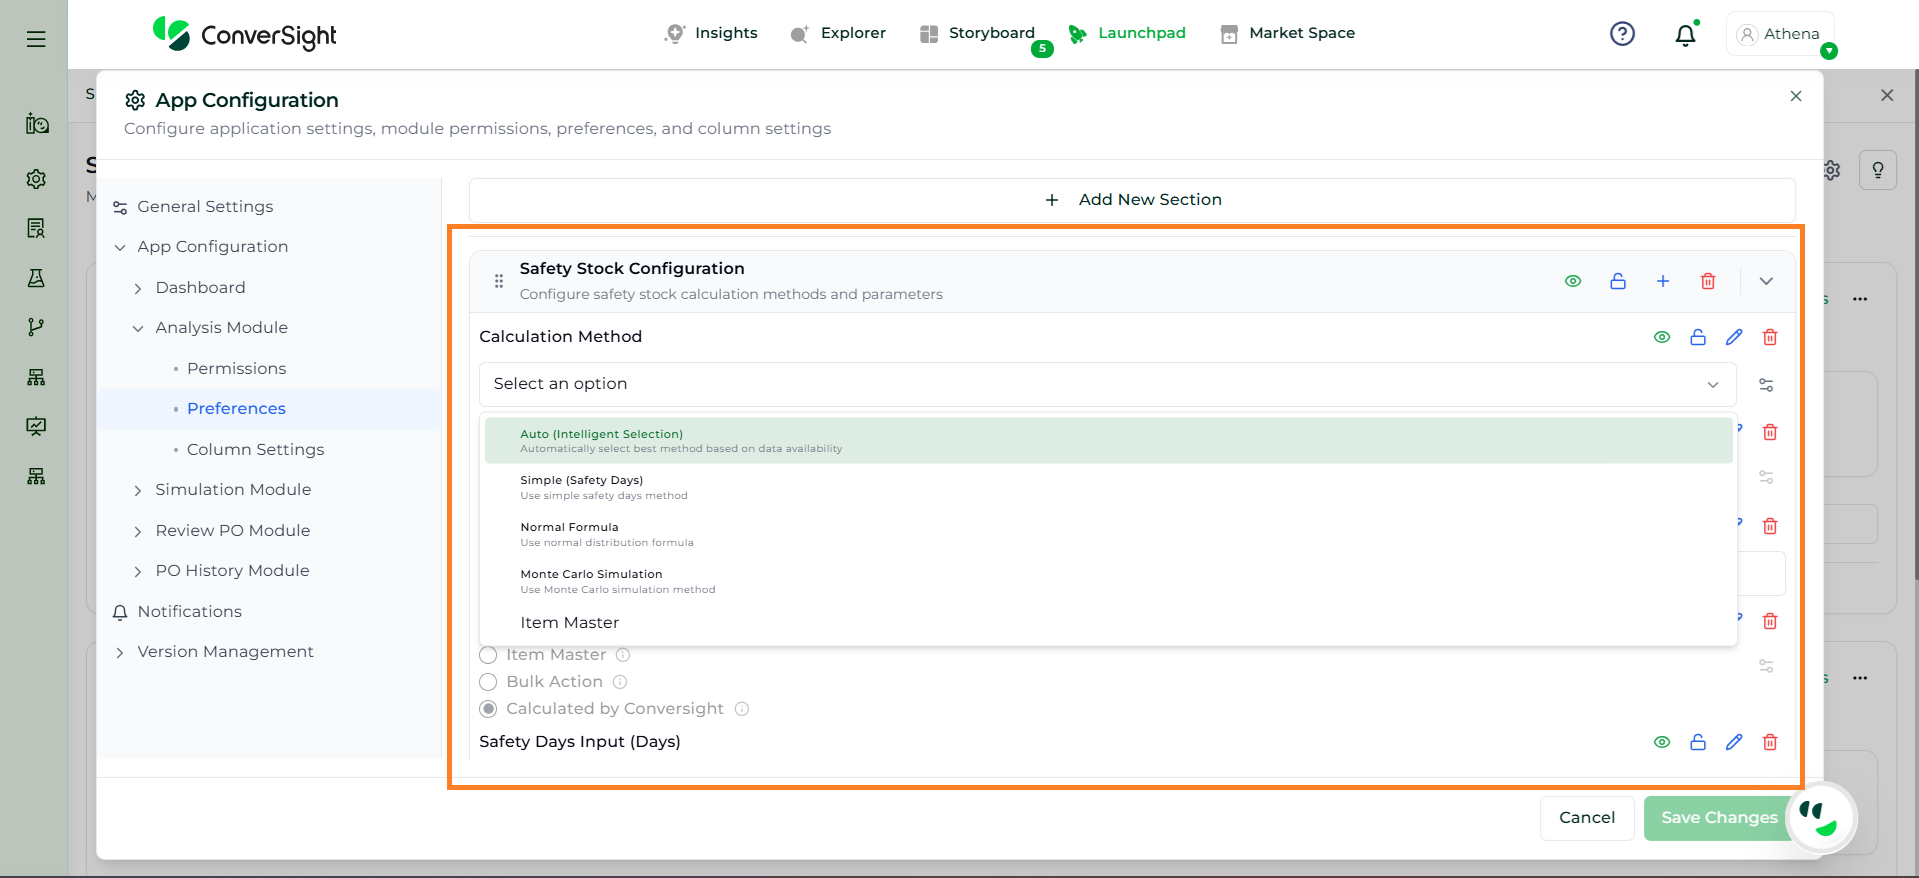
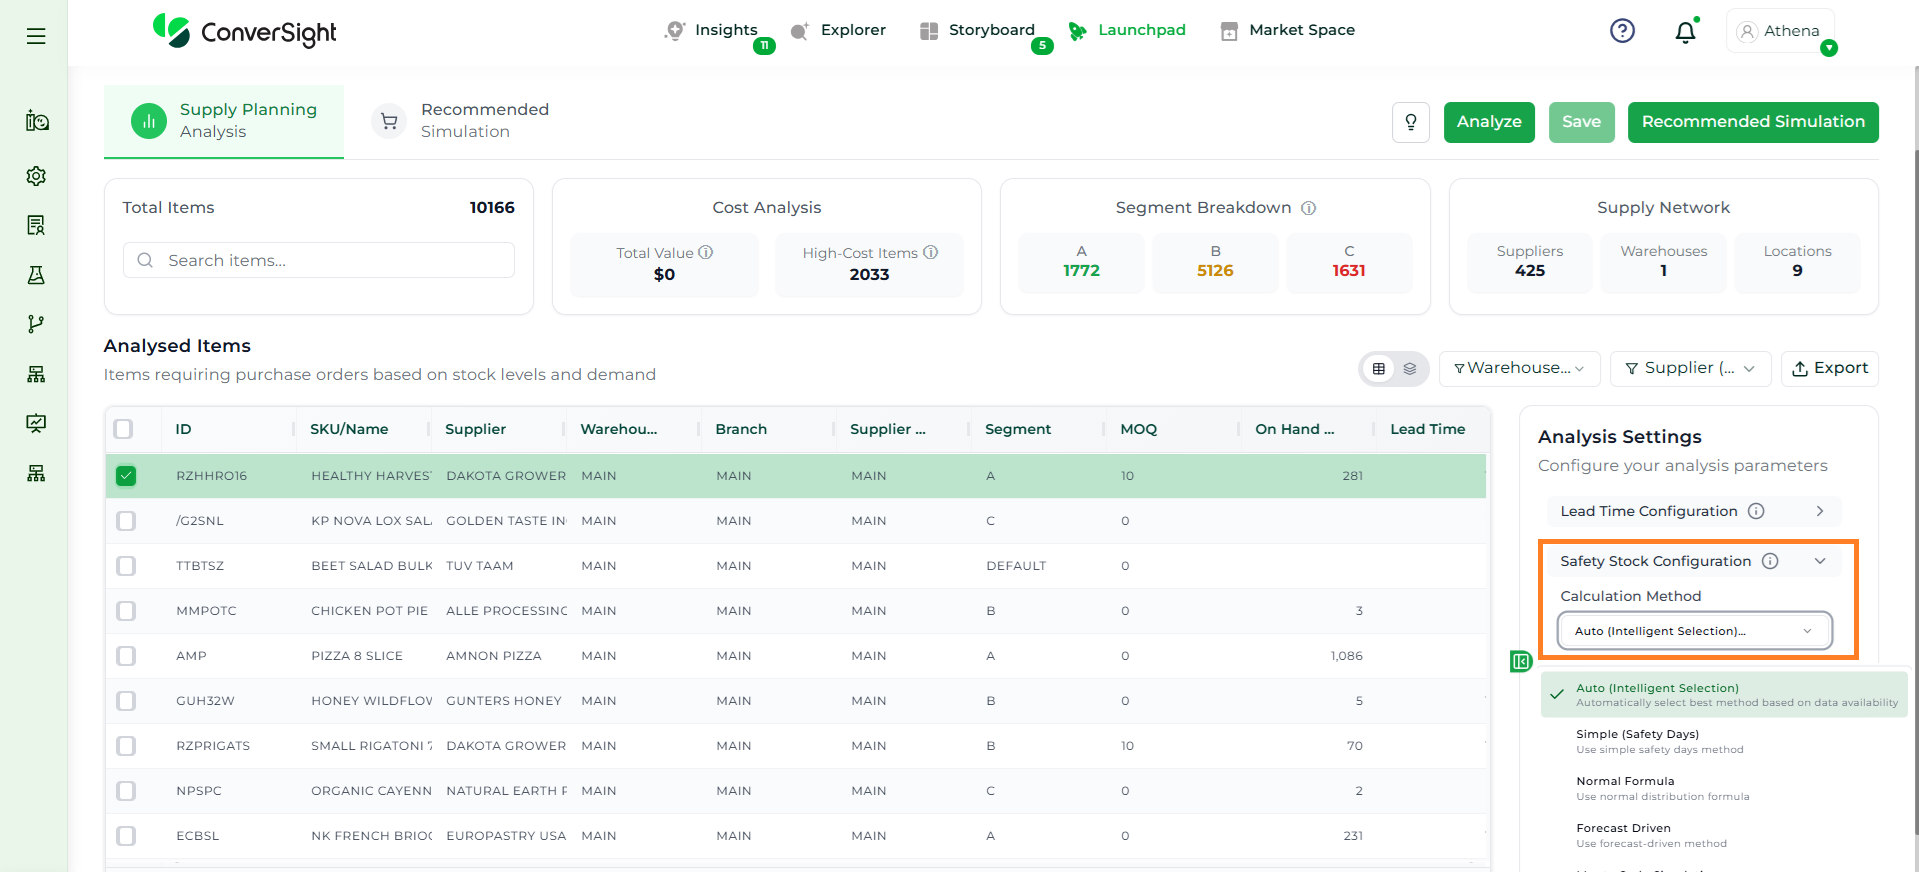
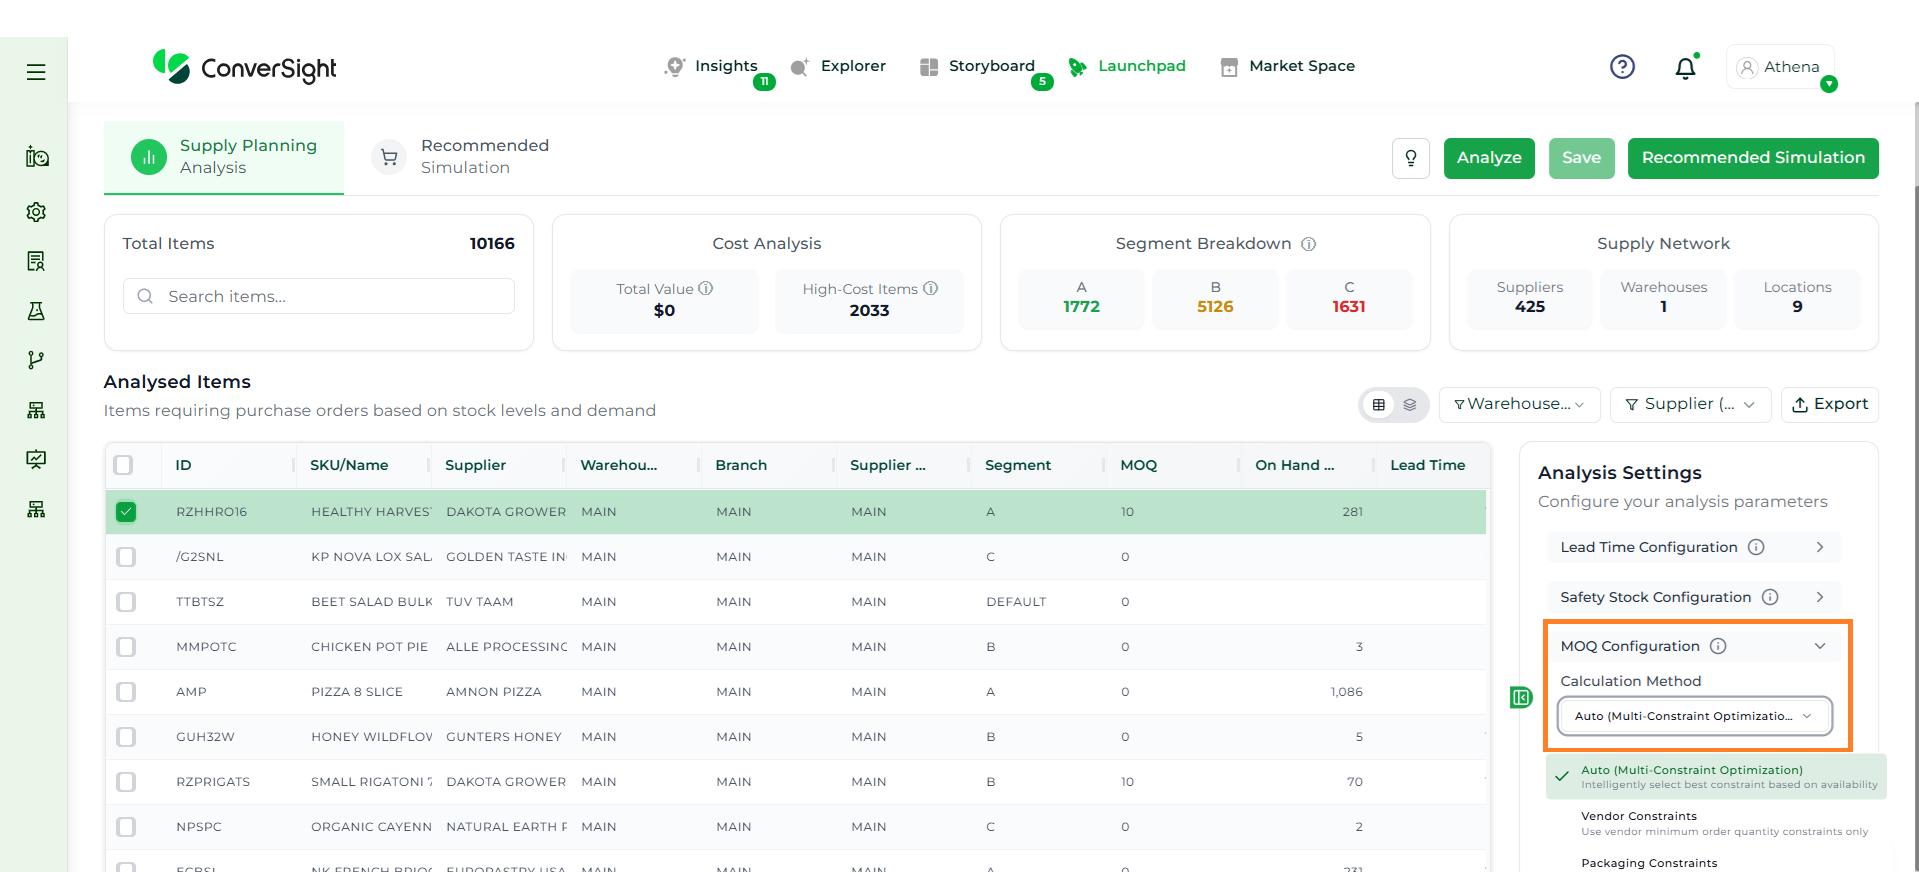
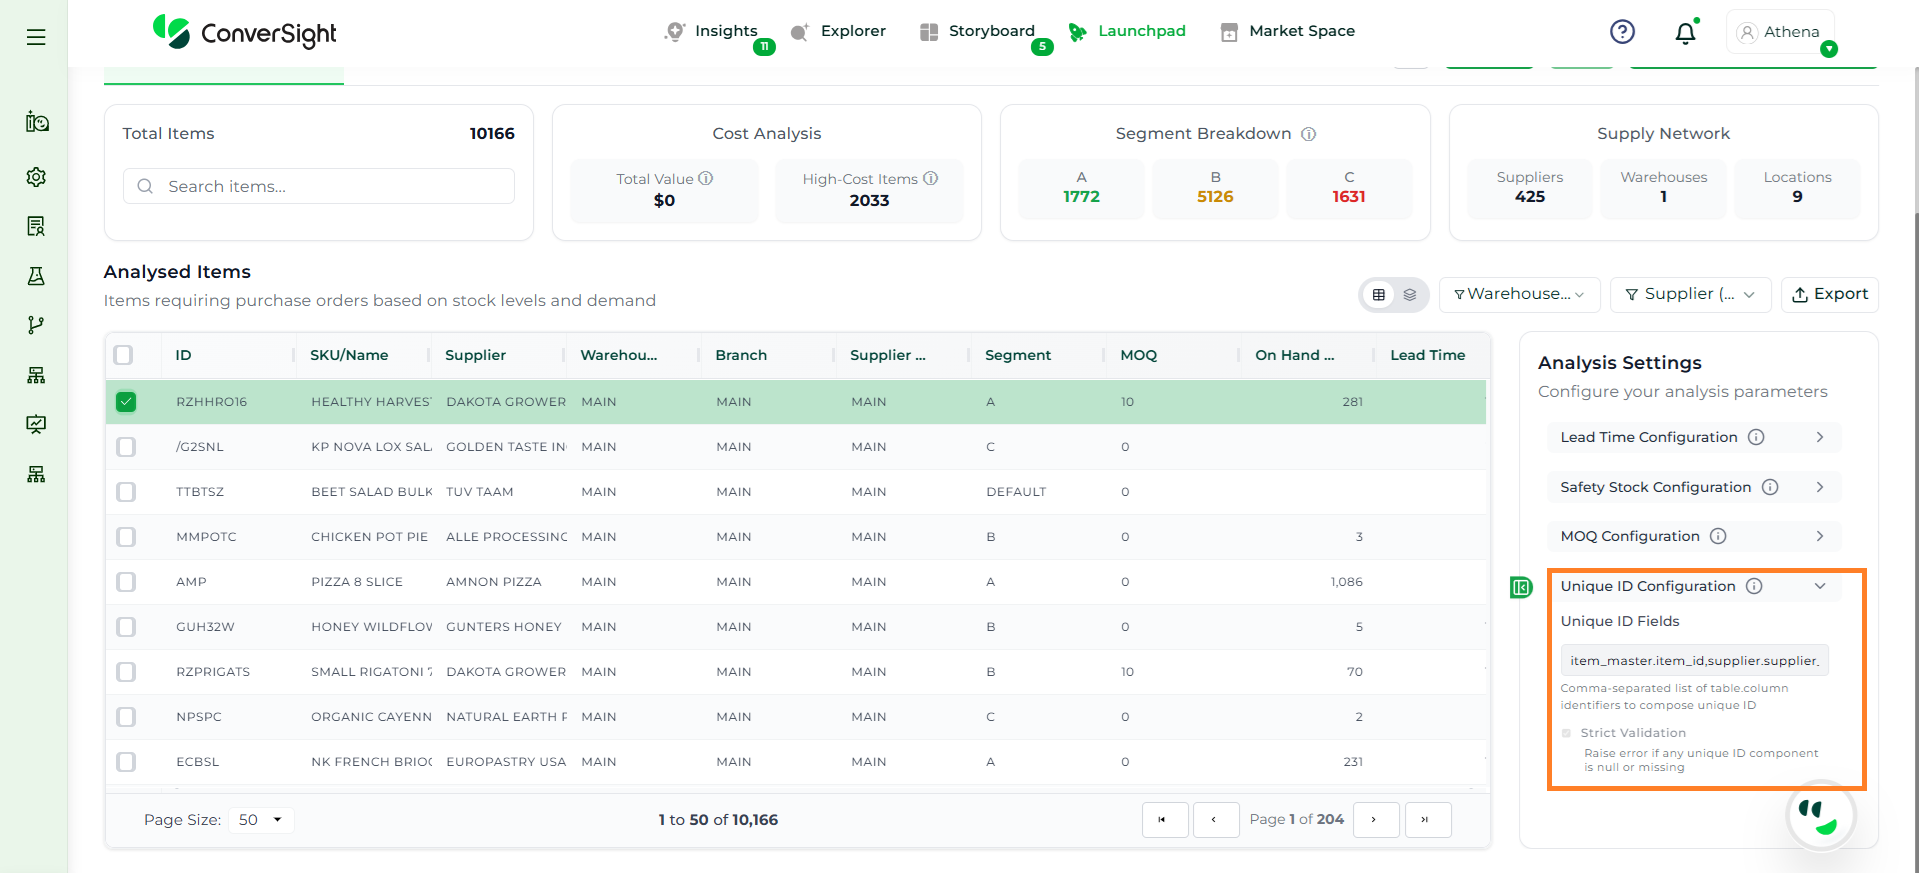
The Analysis Settings section allows users to define key planning parameters by selecting items before running the analysis. By selecting items using the checkbox, users can apply configurations to the chosen set of records. These settings determine how the system calculates inventory positions, identifies risks and generates recommendations, ensuring the results align with business rules and operational realities.
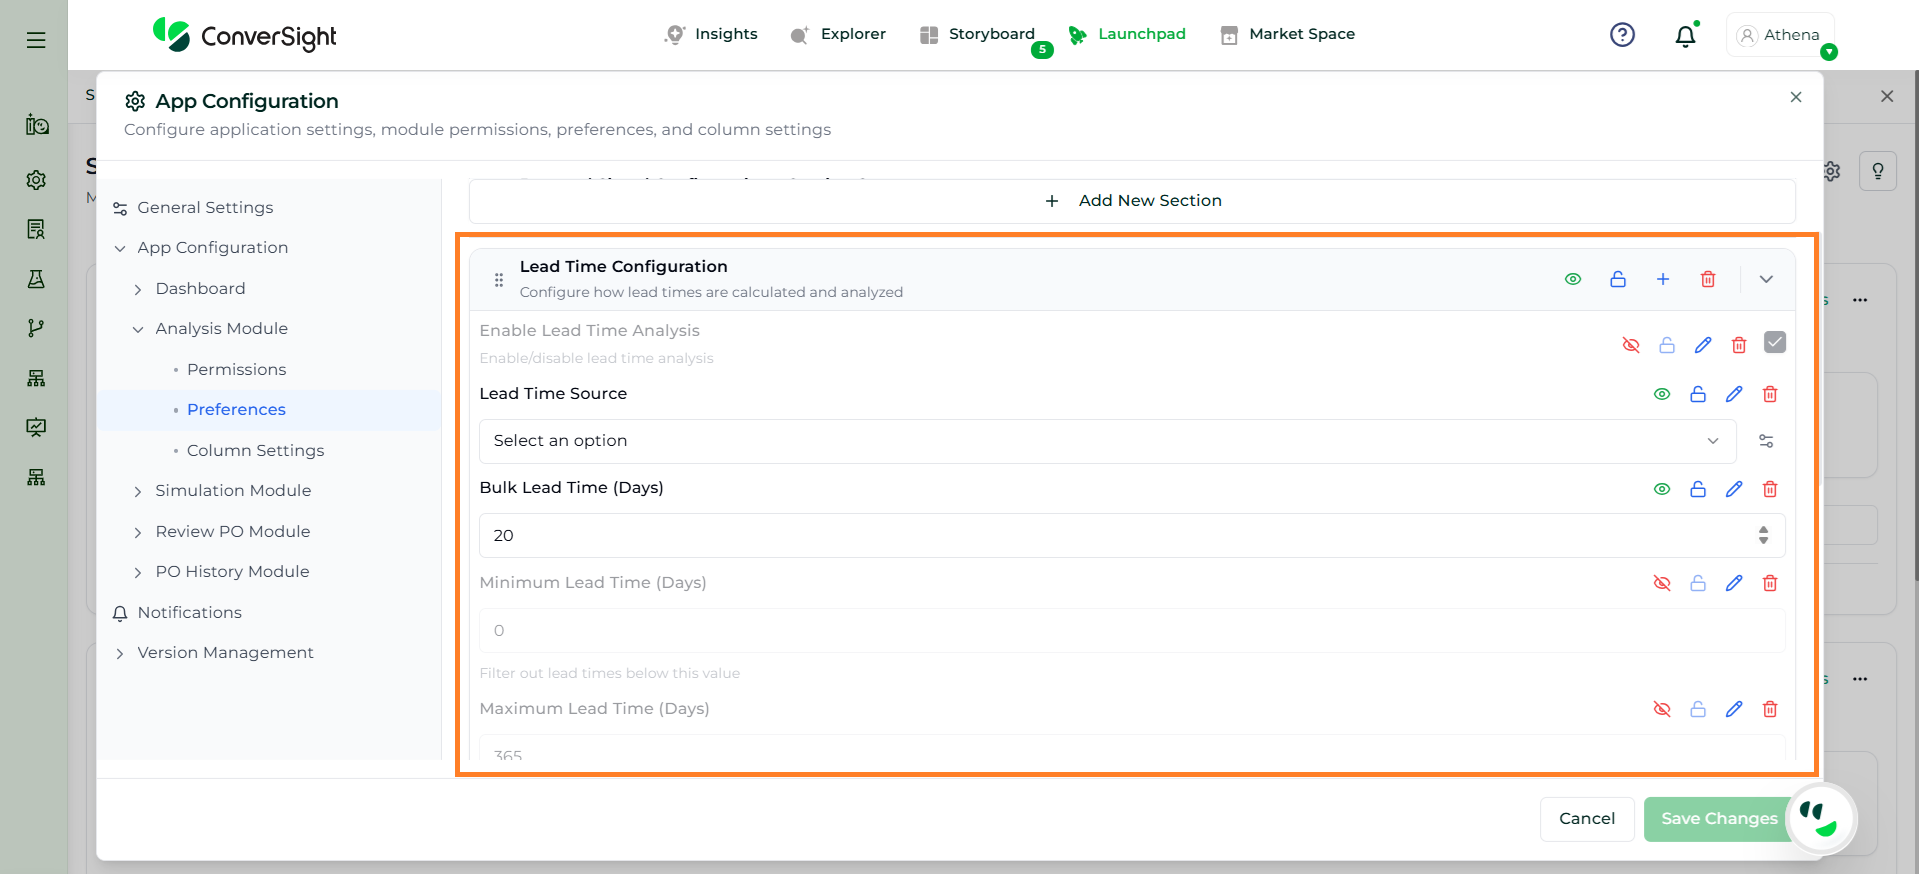
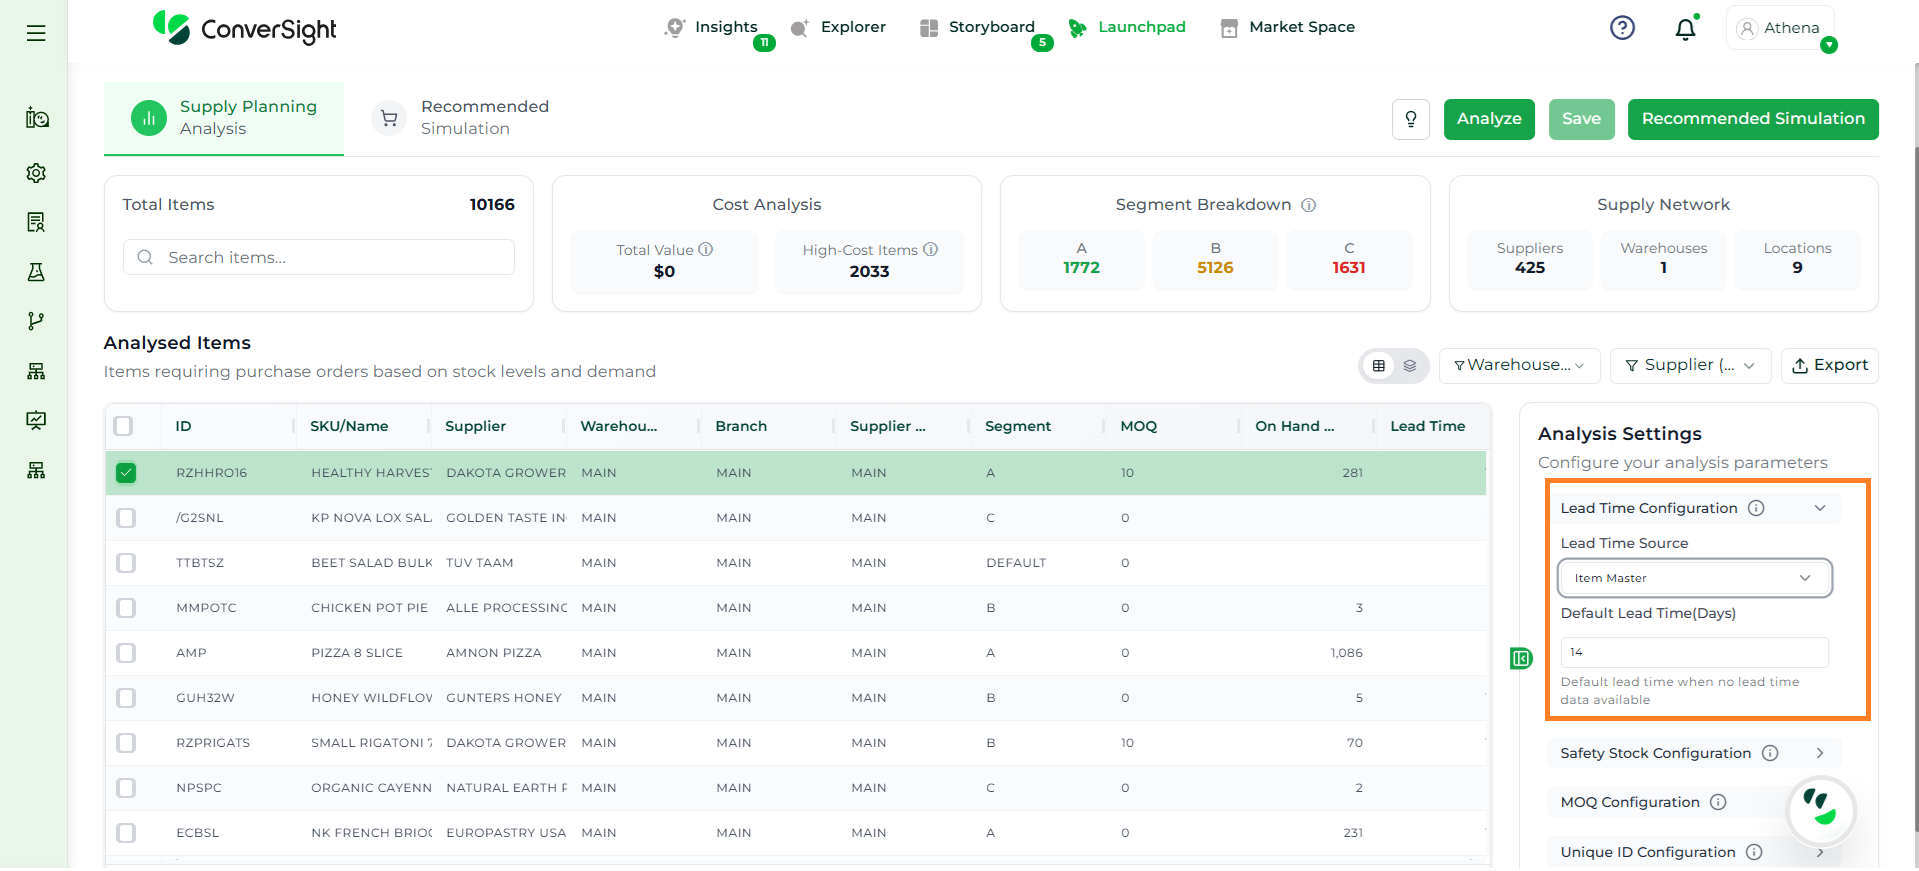
The Lead Time Configuration defines how the system determines the time required to replenish items.
Lead Time Source
Field
Description
Item Master
Uses predefined lead time values available in the item master data
ConverSight Calculated
Automatically calculates lead time using historical data and statistical methods
Bulk Action
Applies a fixed lead time value across selected items
Default Lead Time (Days)
Defines a fallback value used when no lead time data is available from the selected source. This ensures continuity in calculations and prevents gaps in analysis.
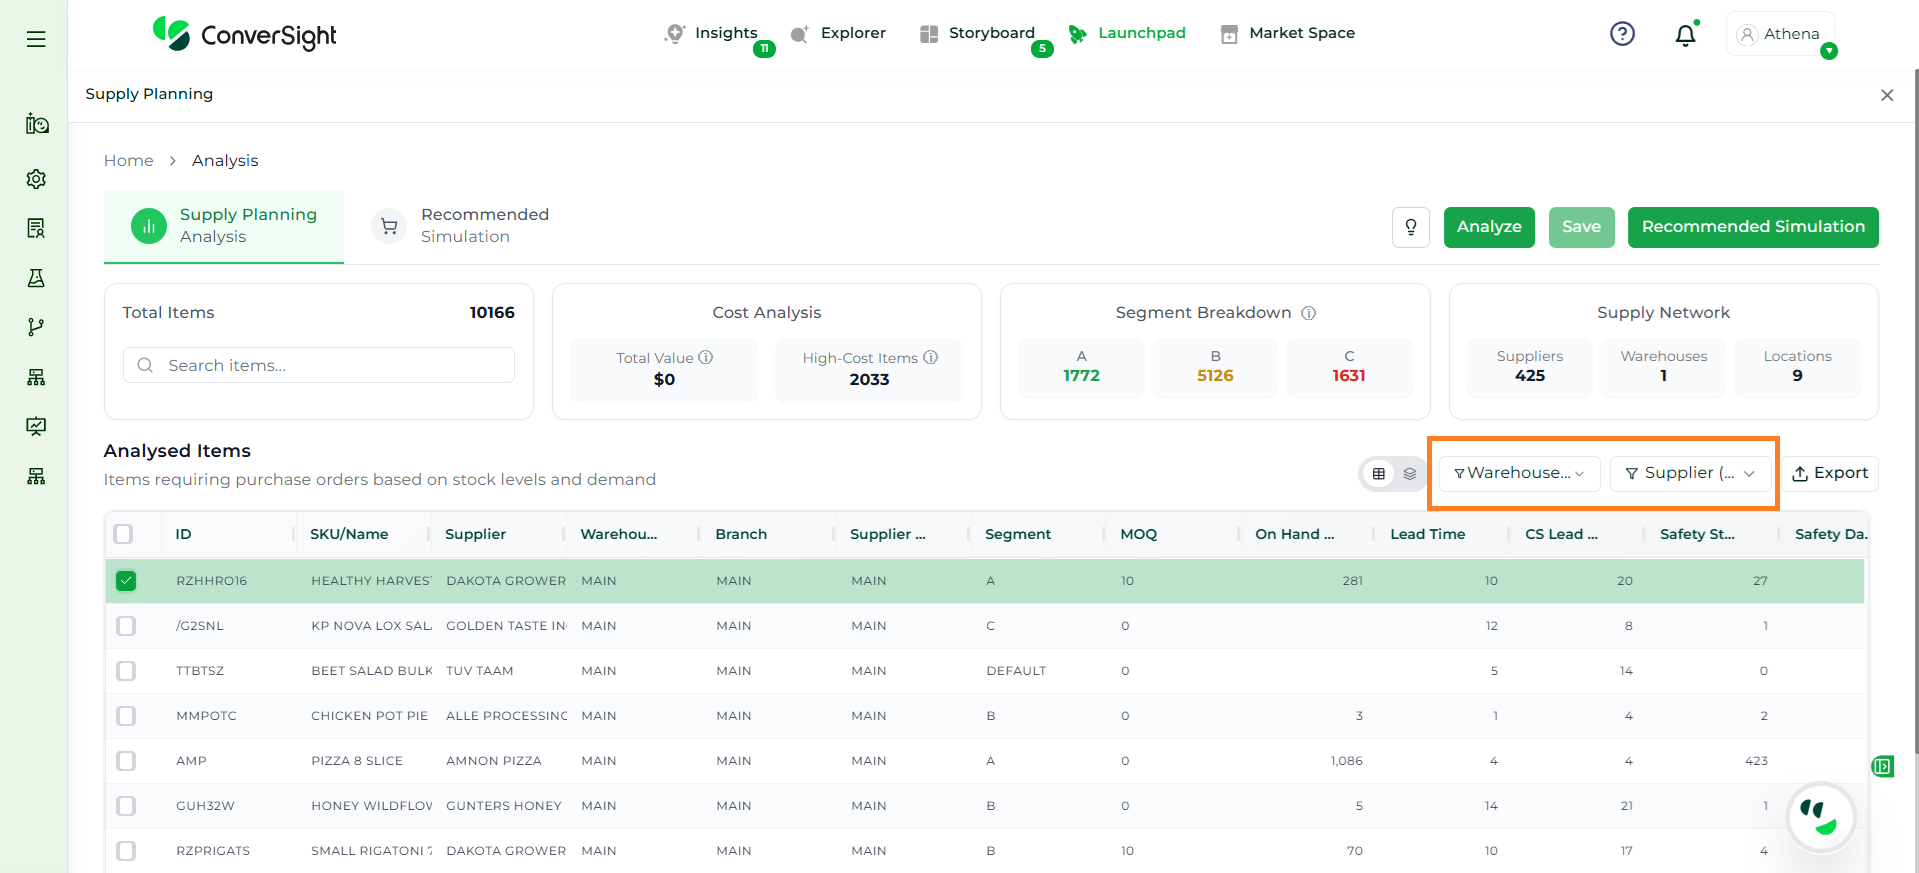
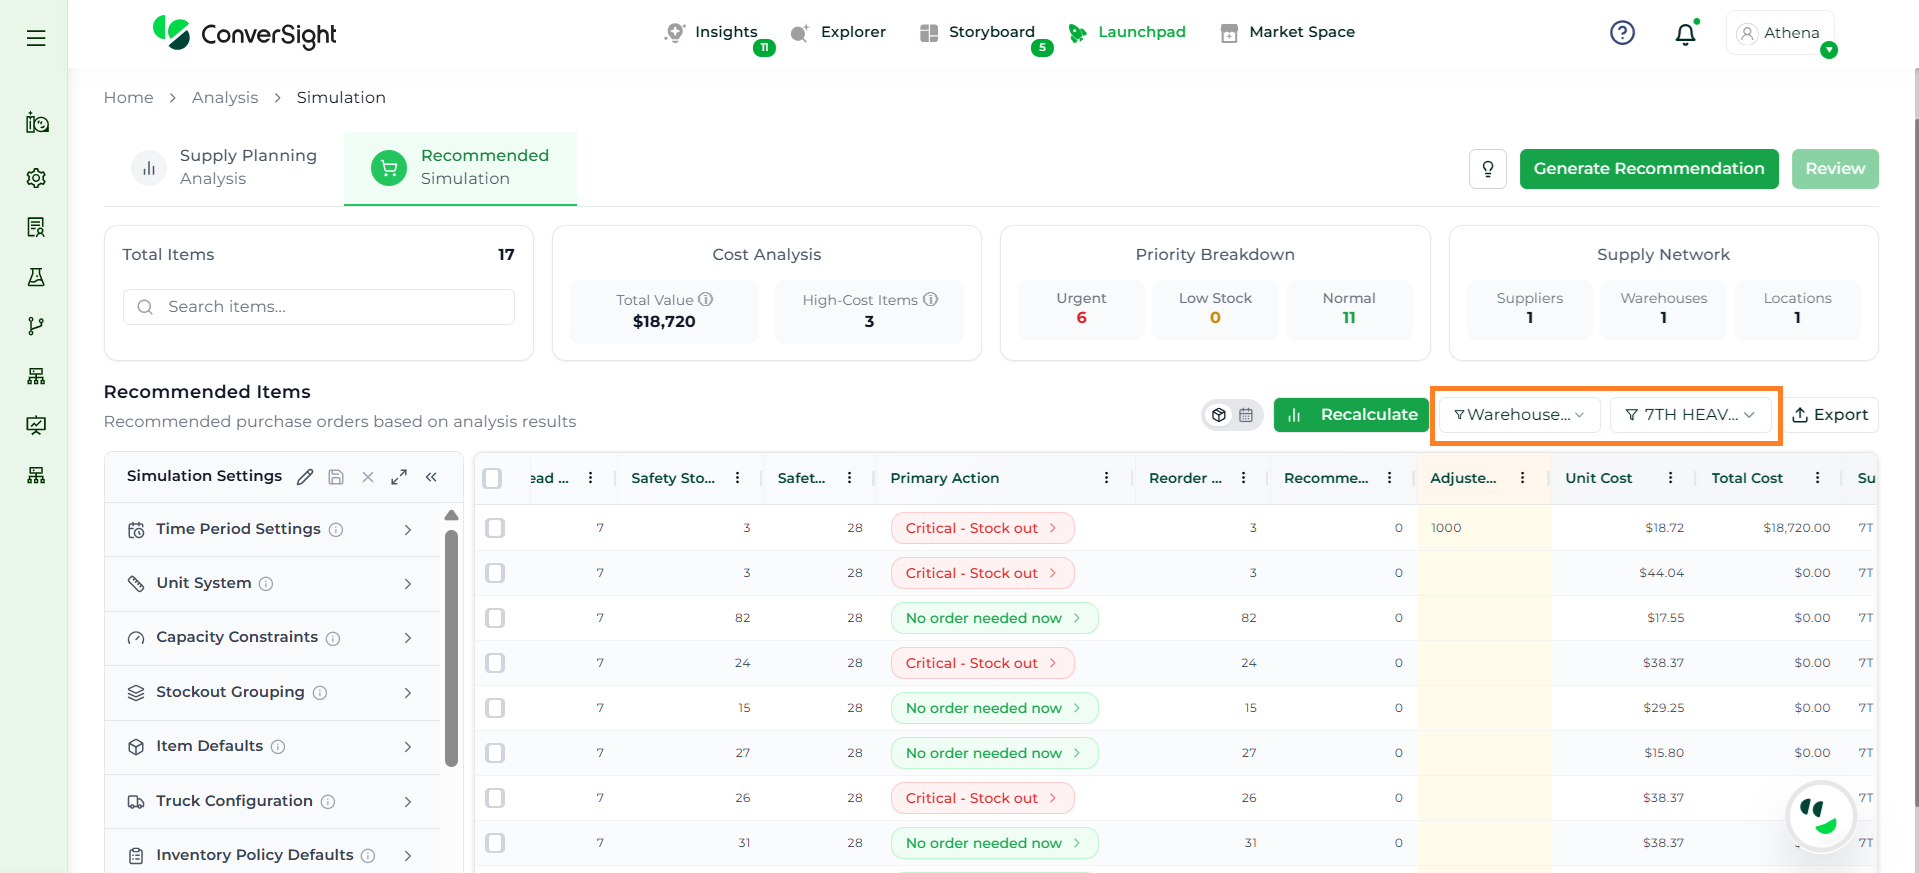
The Filters section allows users to refine the dataset based on specific criteria, making it easier to focus on relevant items.
Filter
Description
Warehouse
Allows users to filter items by warehouse. By default, it may show All, or users can select a specific warehouse such as Main to narrow down results.
Supplier
Enables users to filter items by suppliers. Users can search for a specific supplier and quickly locate relevant items. The dropdown also supports easy selection and sorting for better usability.
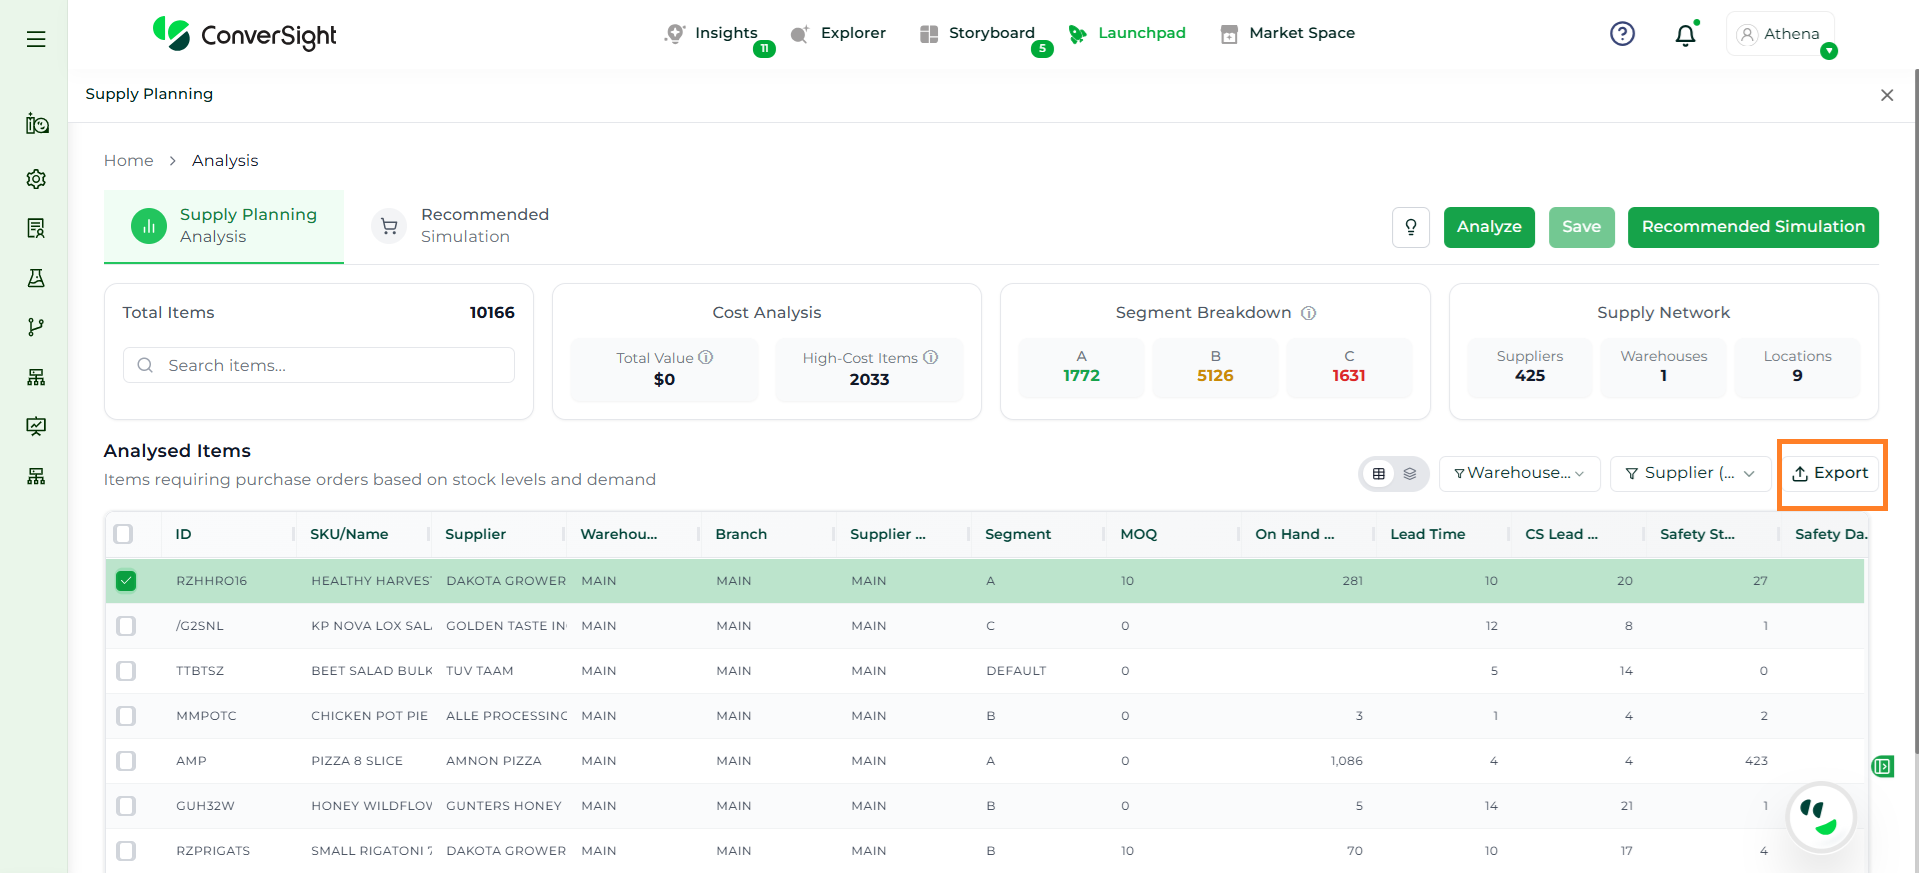
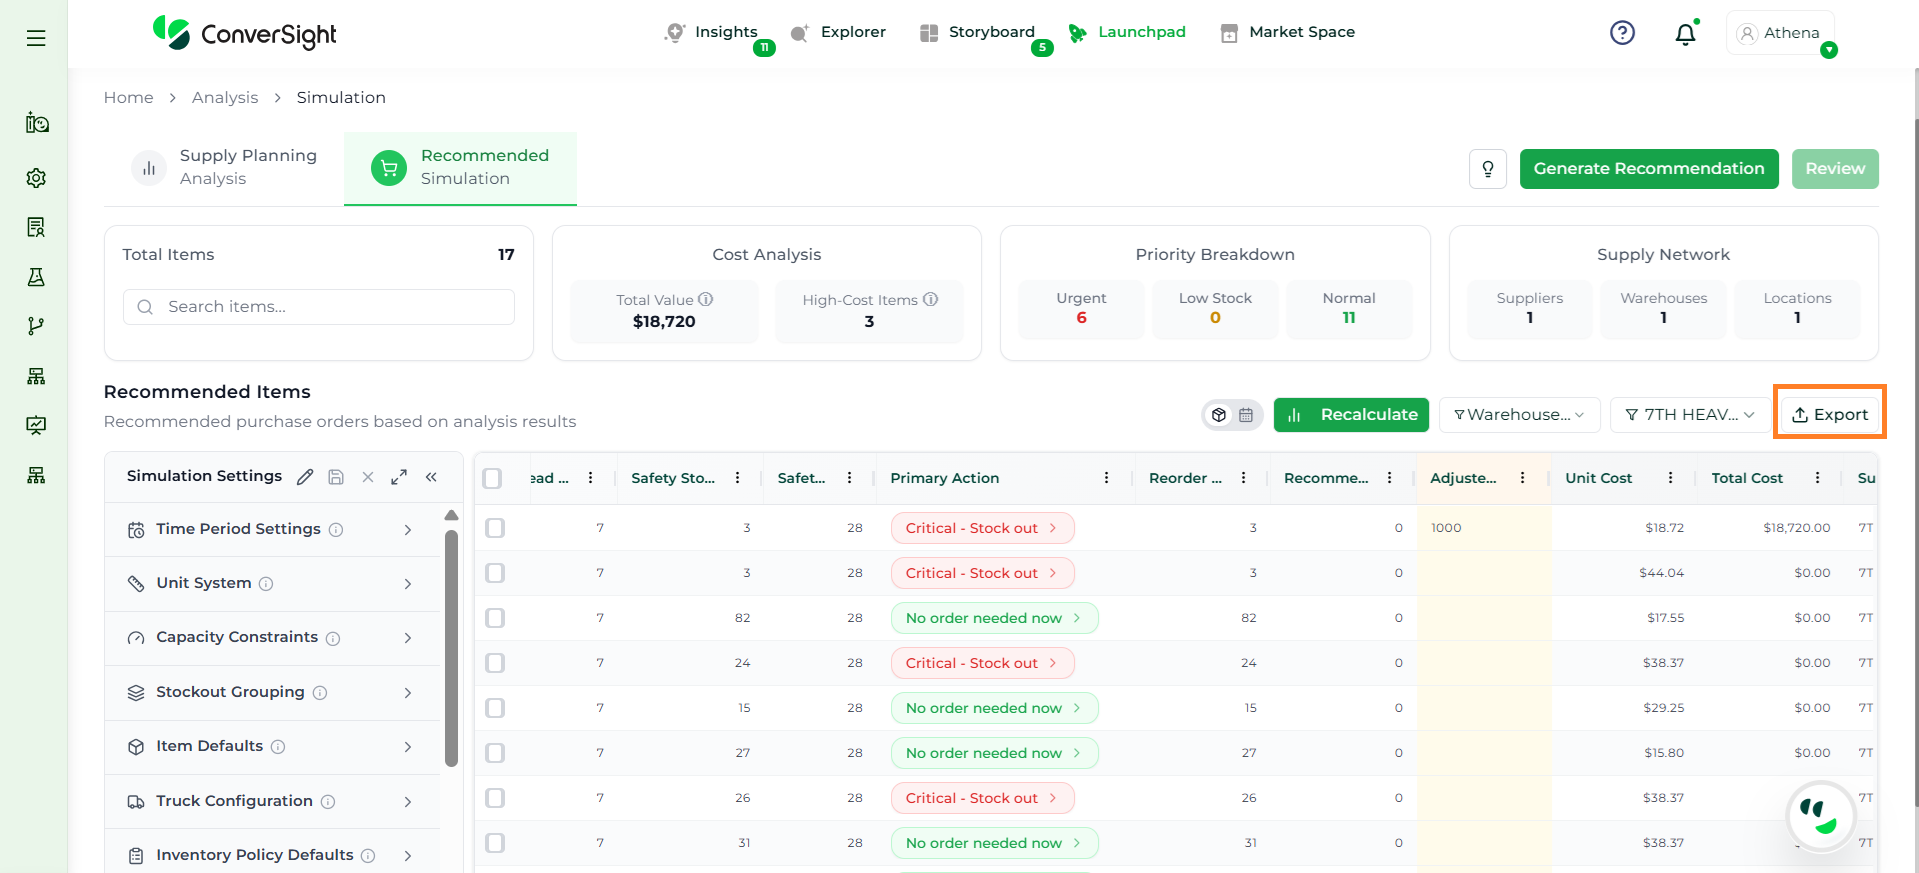
The Export option allows users to extract analysis results for external use.
Option
Description
Export
Downloads the current analysis data (based on applied filters and visible columns) into an Excel file for offline review, sharing, or further processing.
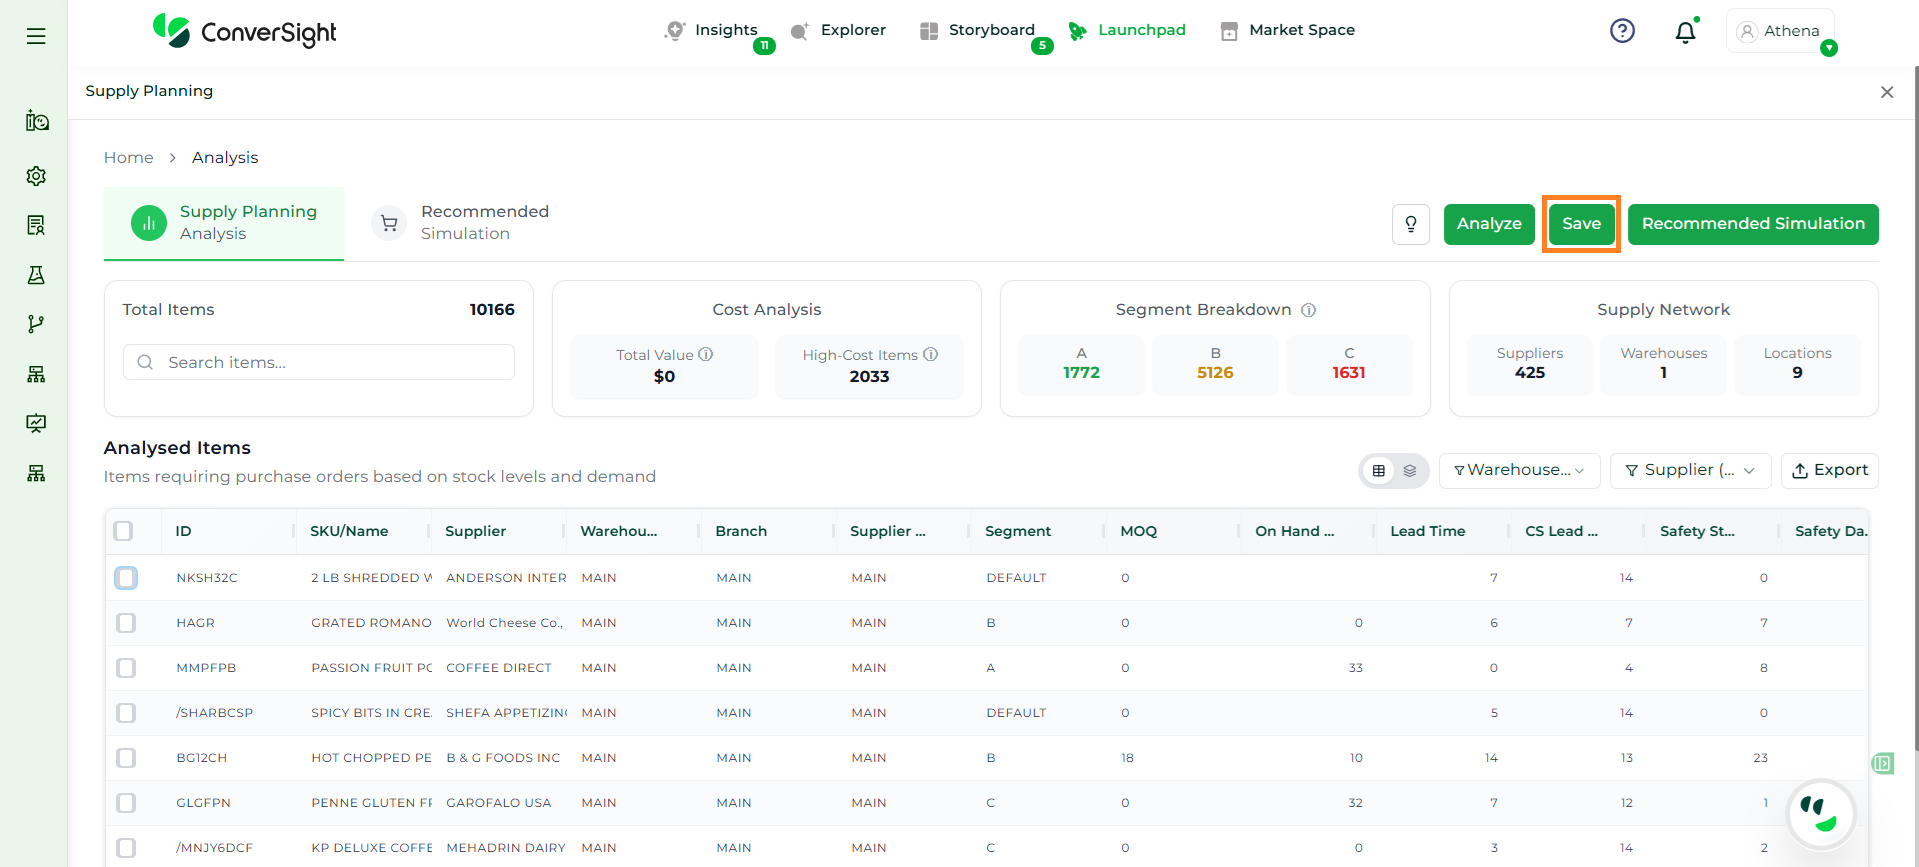
The Save option allows users to preserve the current analysis state, including any configurations or manual adjustments. This ensures continuity and enables collaboration across teams.
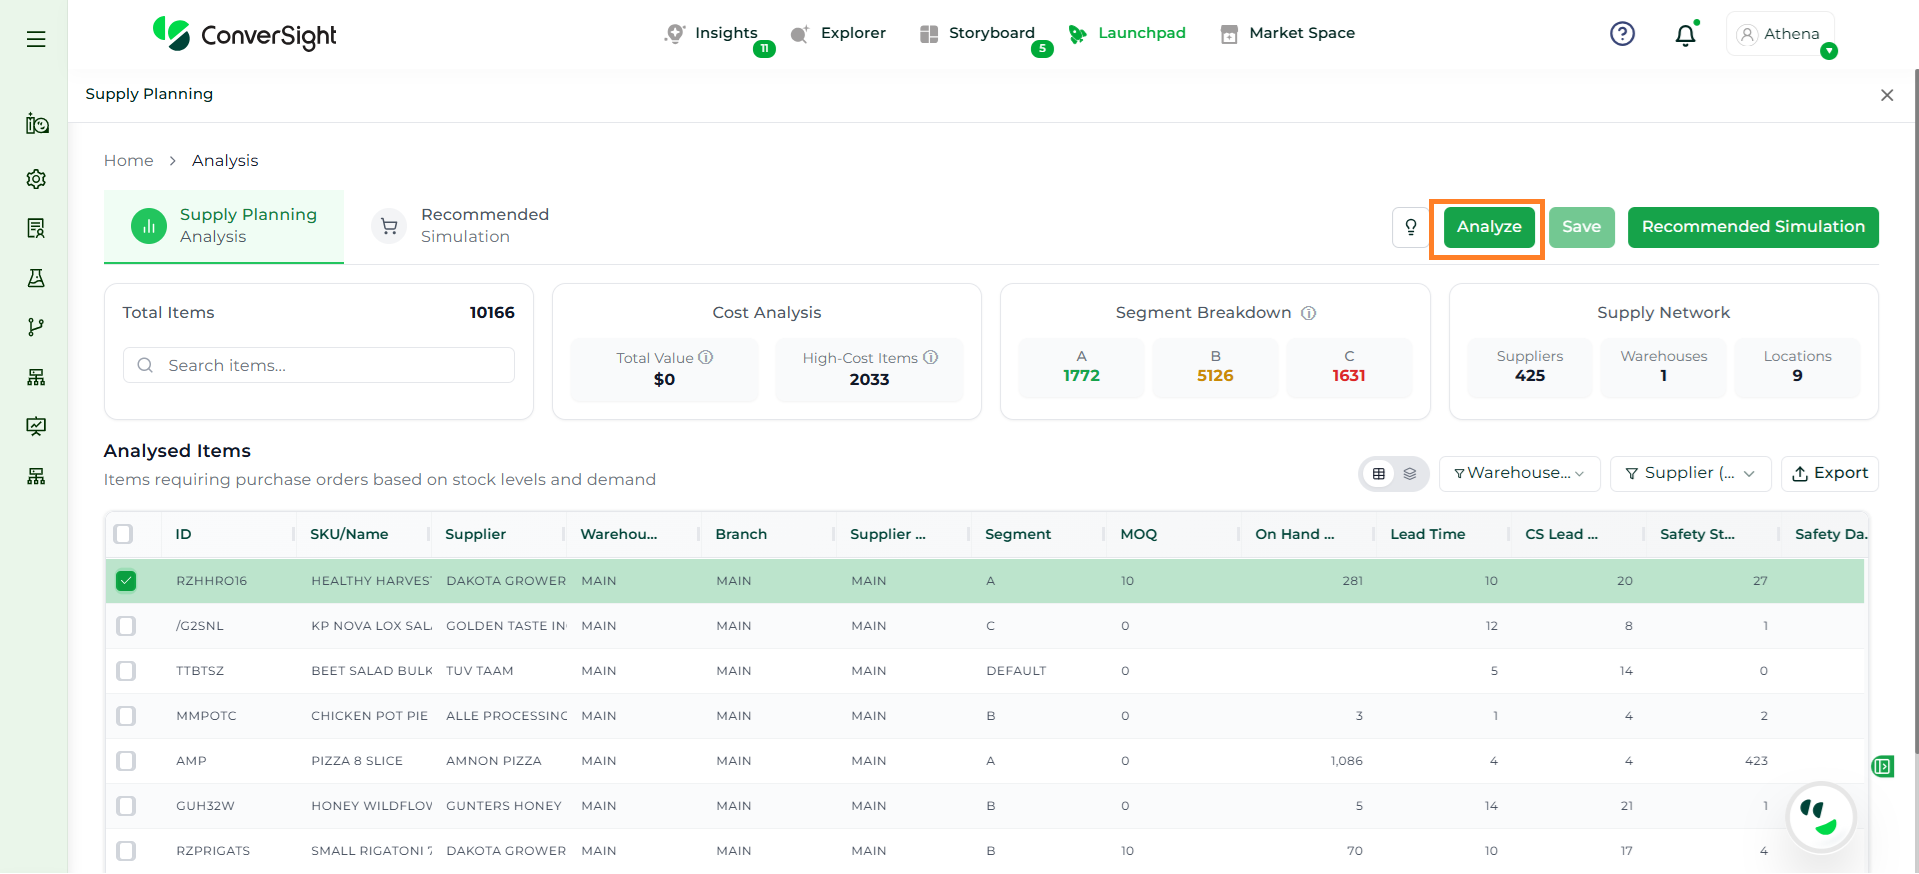
Once the configurations are completed, users can execute the analysis by clicking on the Analyze button to process the data using current inventory levels, demand forecasts and configured parameters. The system evaluates each item and identifies conditions such as understock, overstock, and items requiring immediate action.
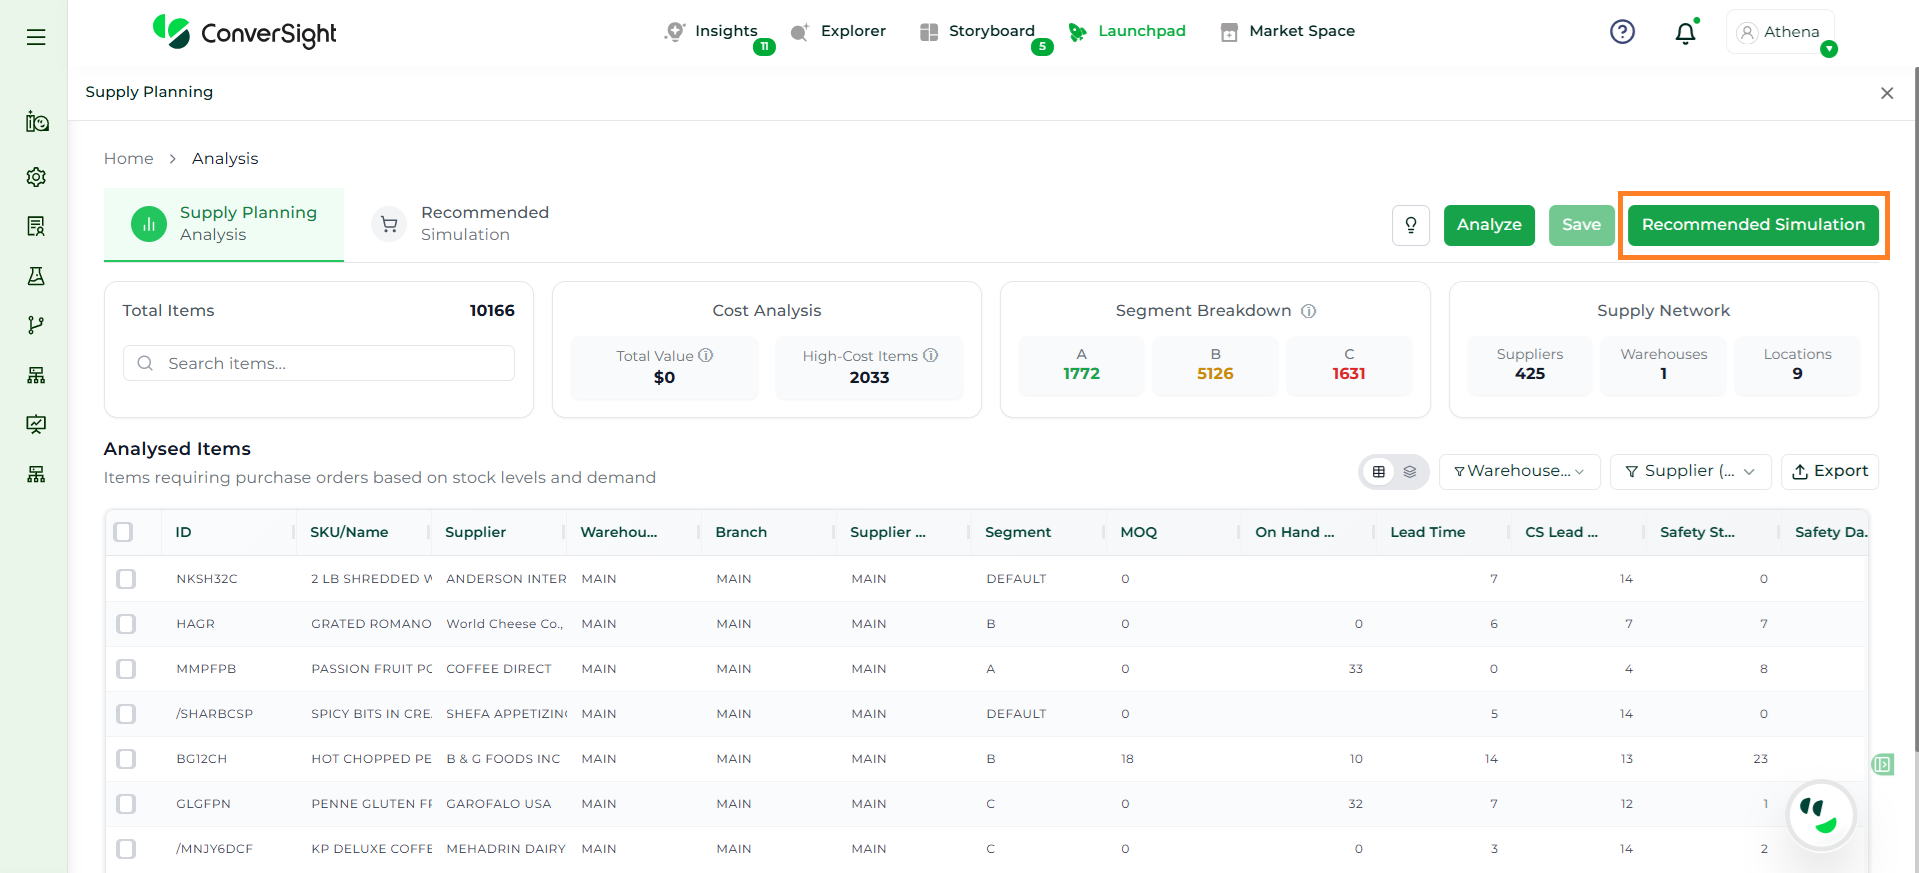
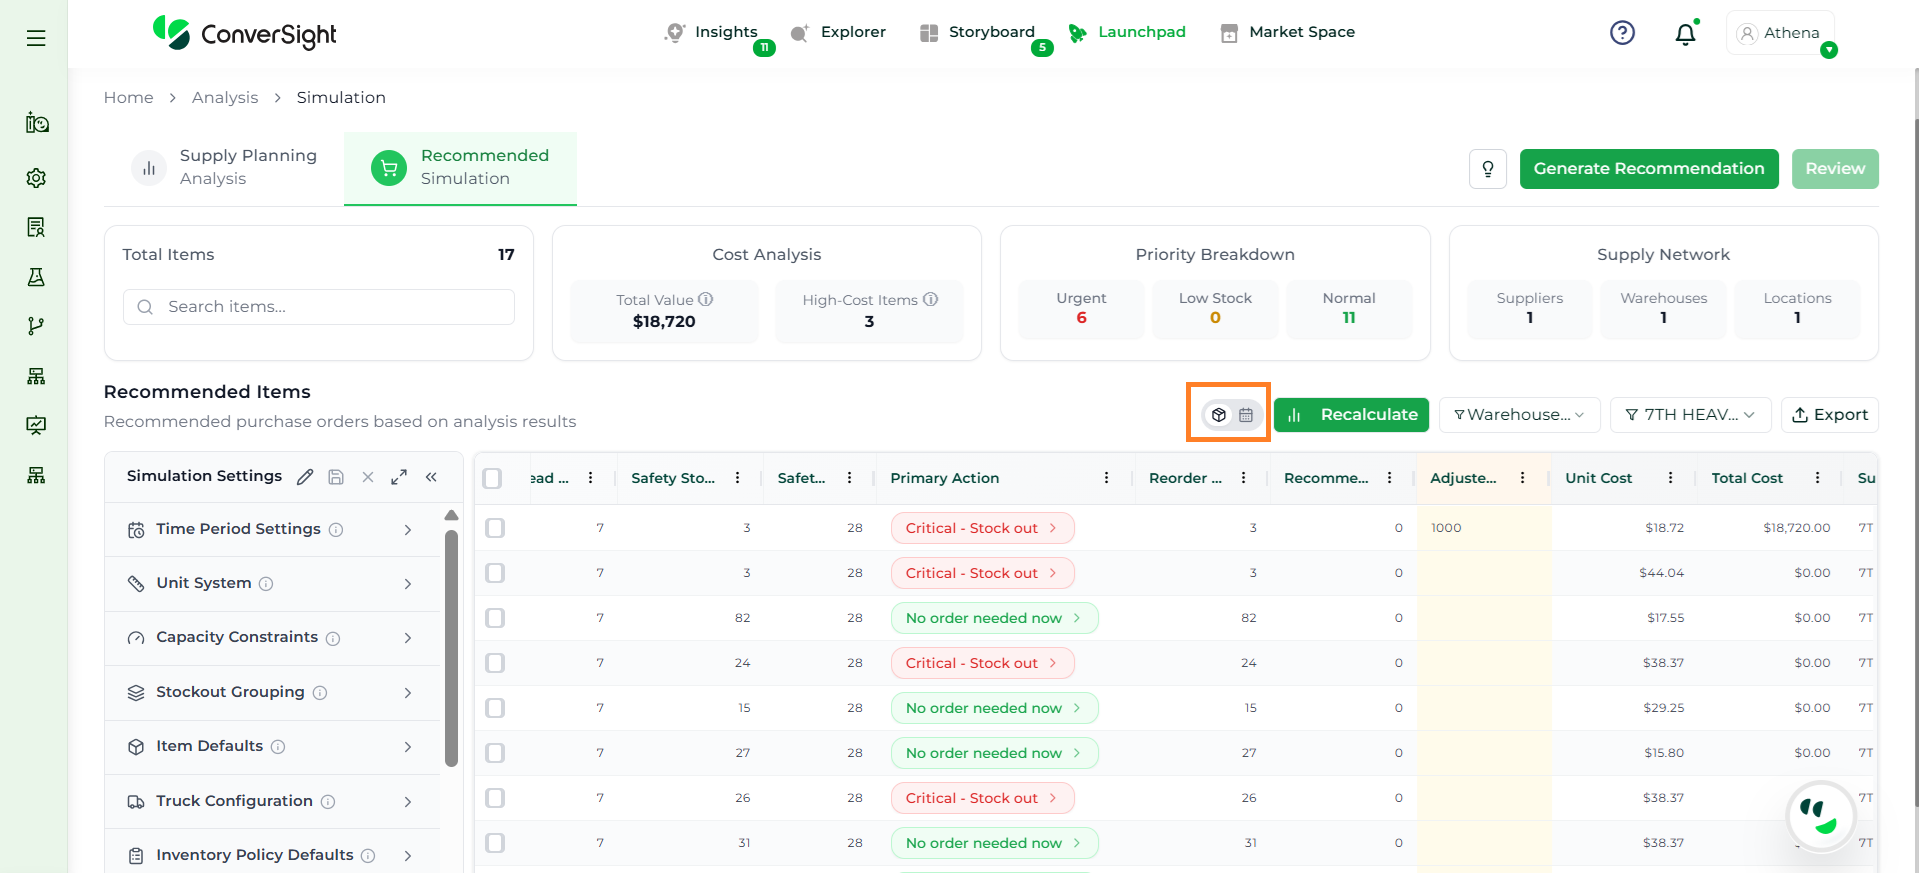
The Recommended Simulation uses AI logic to transform analyzed inventory data into actionable purchase recommendations, helping users decide what to order, when to order, and how much to order.
This module evaluates demand forecasts, current inventory, lead times, safety stock, and operational constraints to generate optimized, week-by-week replenishment plans. It not only provides recommendations but also allows users to review, adjust, and refine them based on business needs.
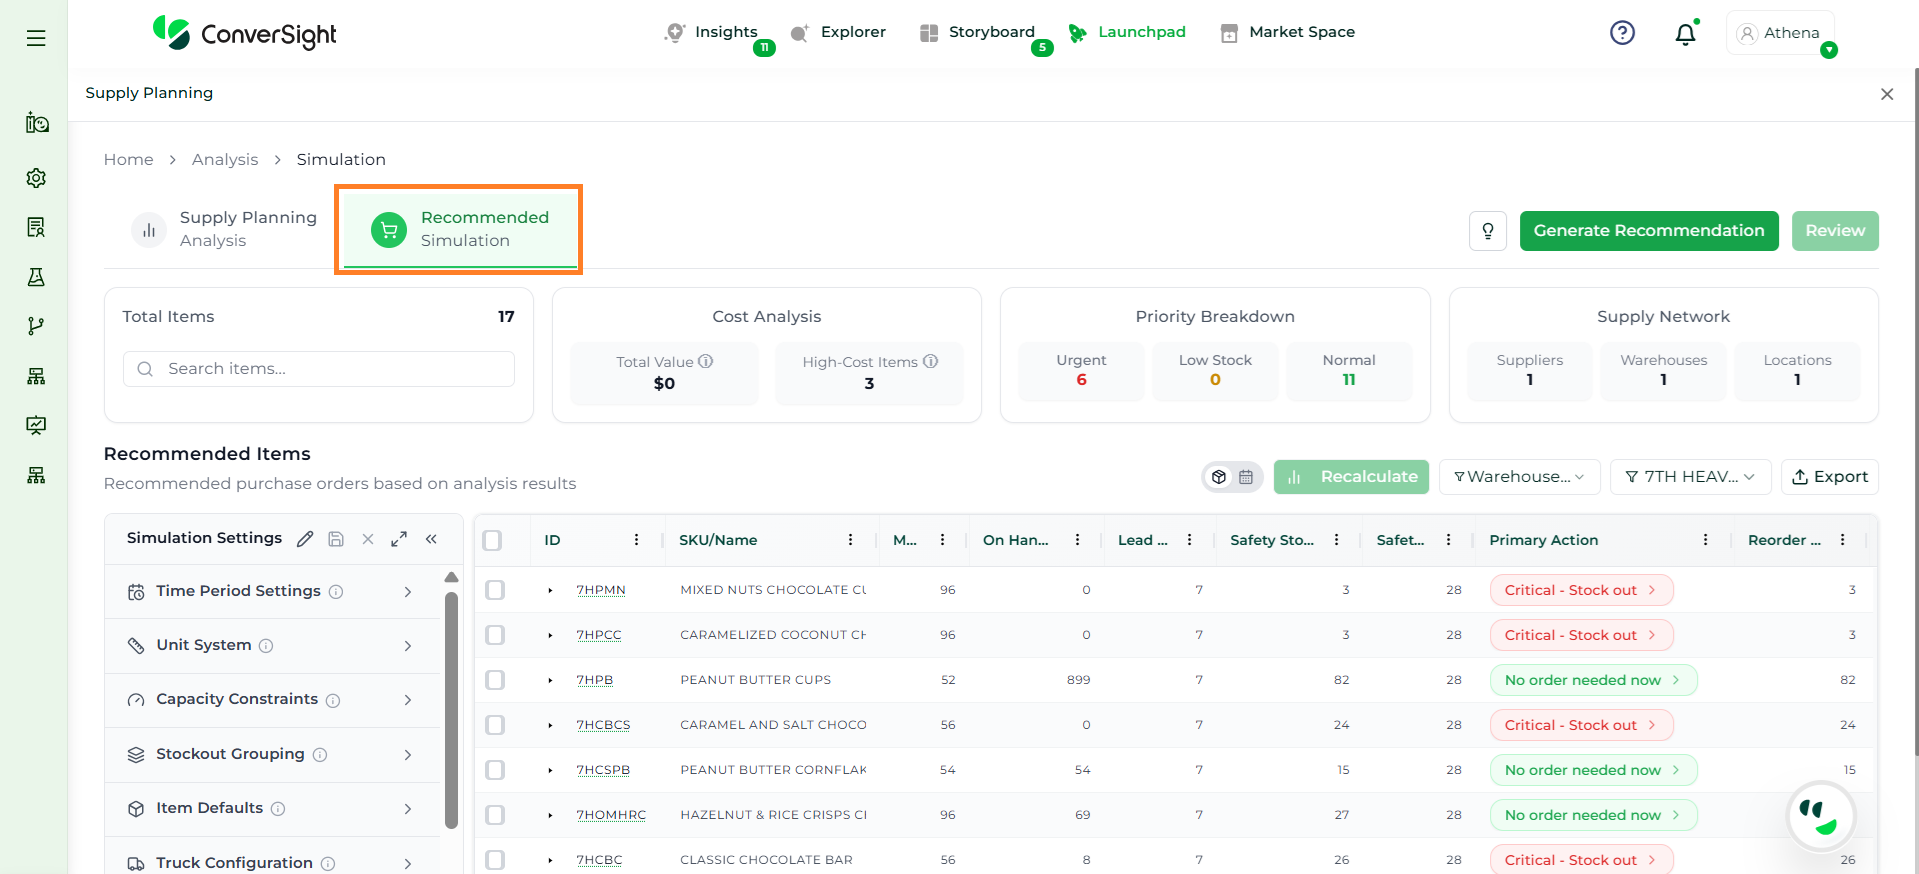
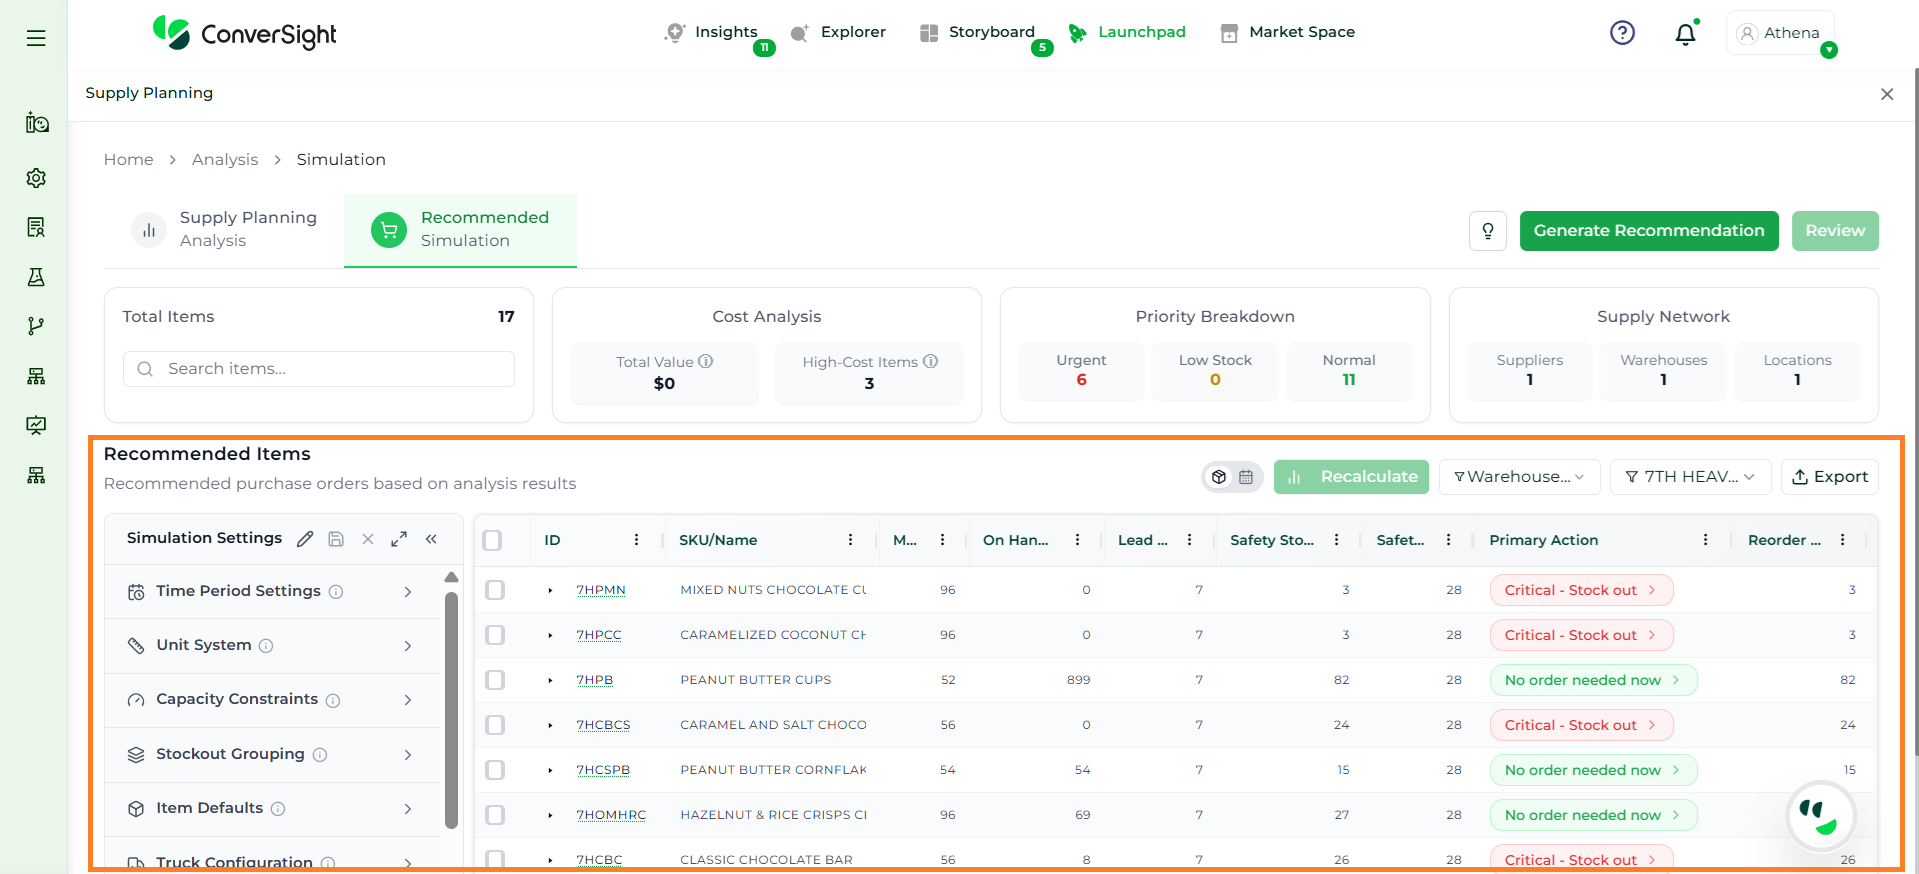
The Recommended Items display all recommendations in a structured, item-level format. Each row represents a unique item (SKU) along with its planning parameters, calculated values, and suggested actions.
This section helps users review, validate, and adjust recommendations before proceeding to purchase order creation. The following are the columns in the Recommnded Items table.
Column
Description
Item ID / SKU
Unique identifier and name of the product being analyzed.
Supplier
Supplier associated with the item from whom the order will be placed.
MOQ
Minimum Order Quantity required for procurement.
Lead Time
Time required to replenish the item from the supplier.
Safety Stock
Buffer stock maintained to prevent stockouts.
Reorder Quantity
System-calculated quantity required to replenish stock based on demand, lead time, and safety stock.
Recommended Quantity
AI-suggested next order quantity optimized based on all constraints and forecasts.
Adjusted Quantity
Editable field where users can modify the recommended quantity based on business needs.
Unit Cost
Cost per unit of the item for the next order.
Total Cost
Total cost of the recommended/adjusted quantity (Unit Cost × Quantity).
Primary Action
Suggested action for the item (e.g., order now, no action required). Users can click on this field to view a detailed breakdown of the recommendation and underlying factors.
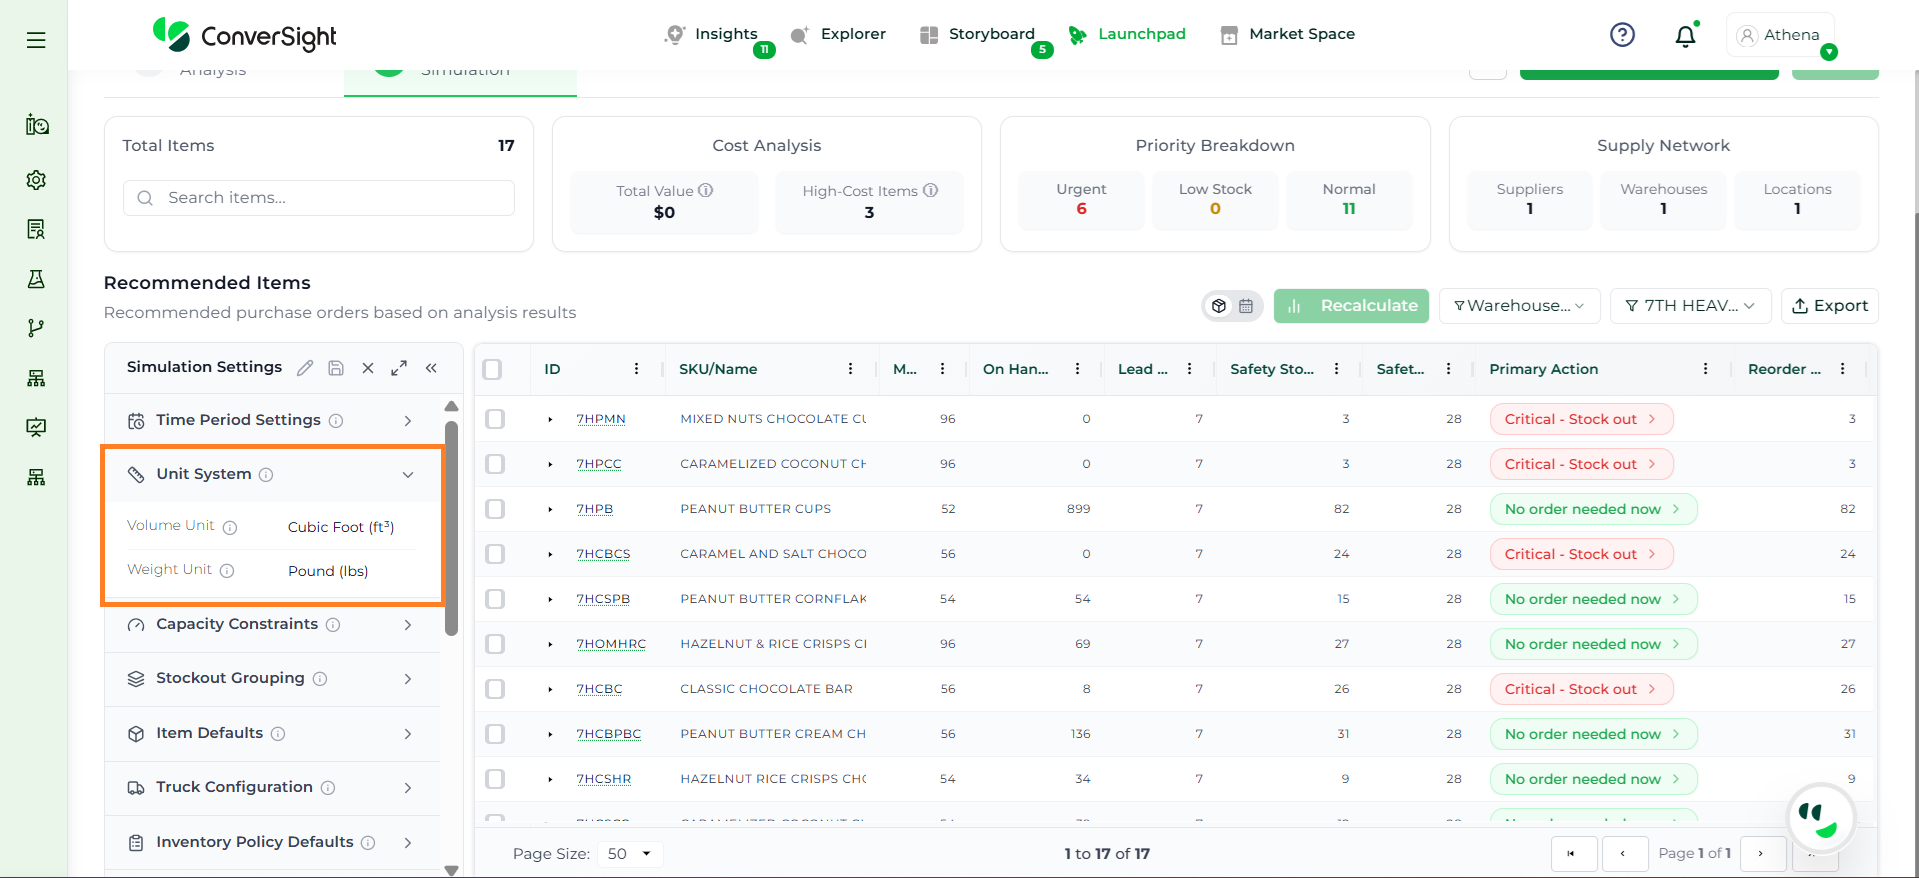
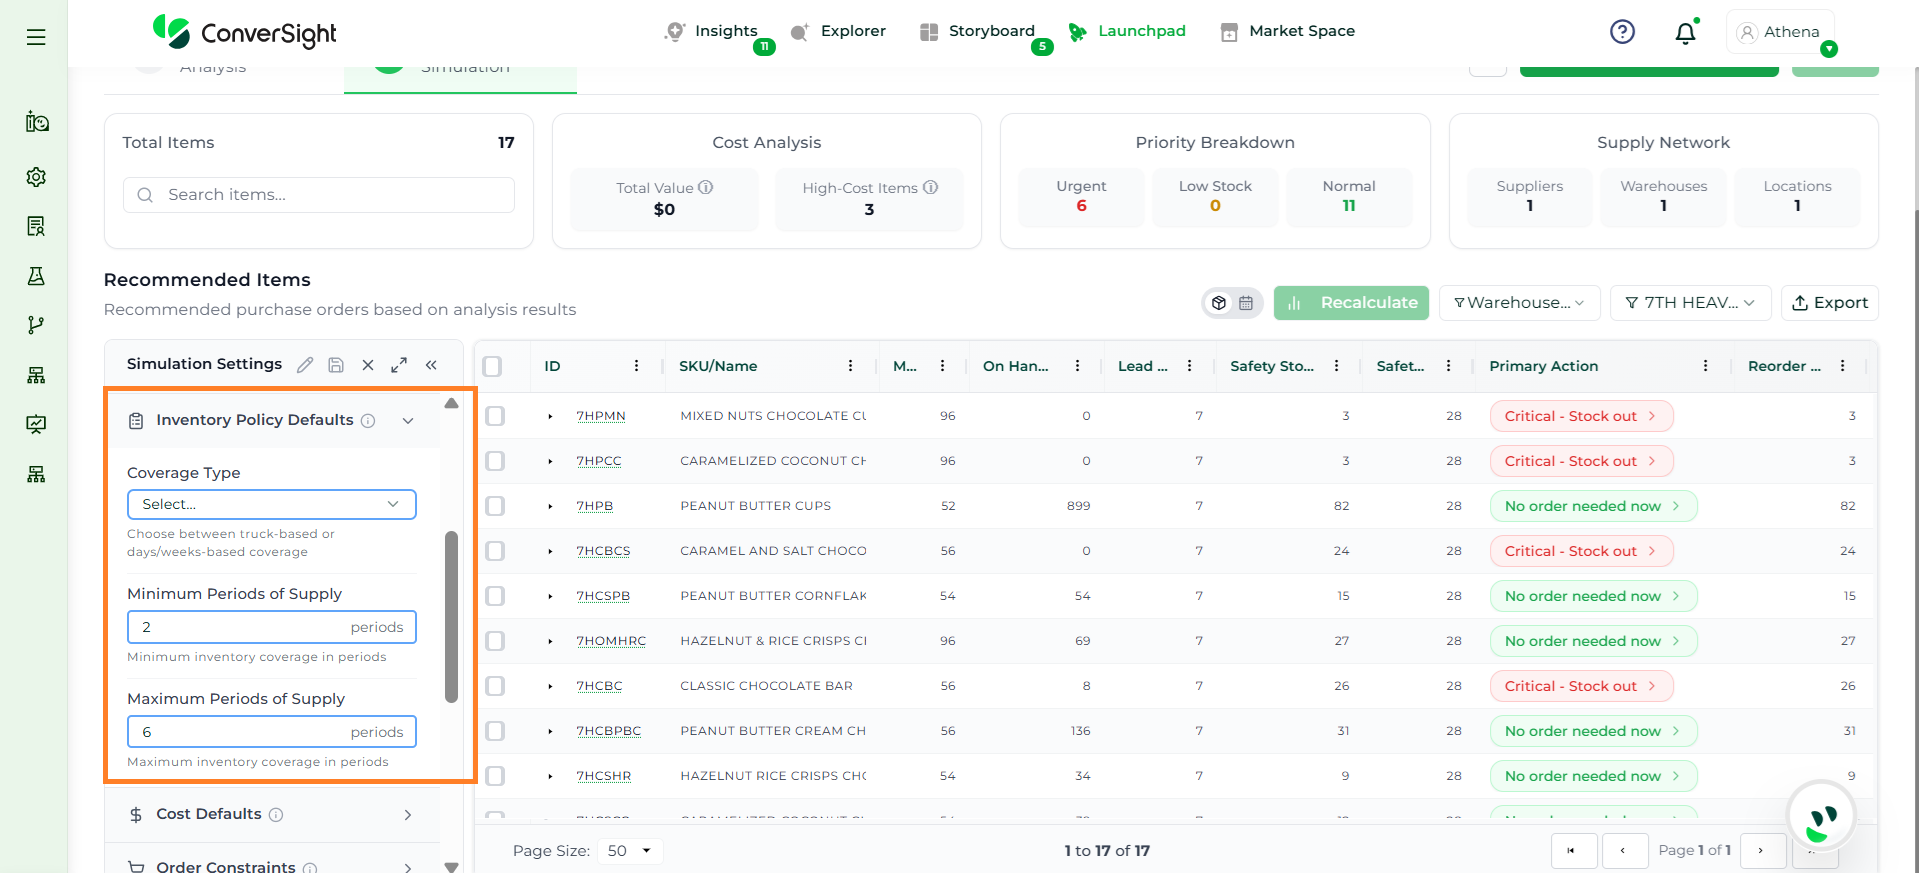
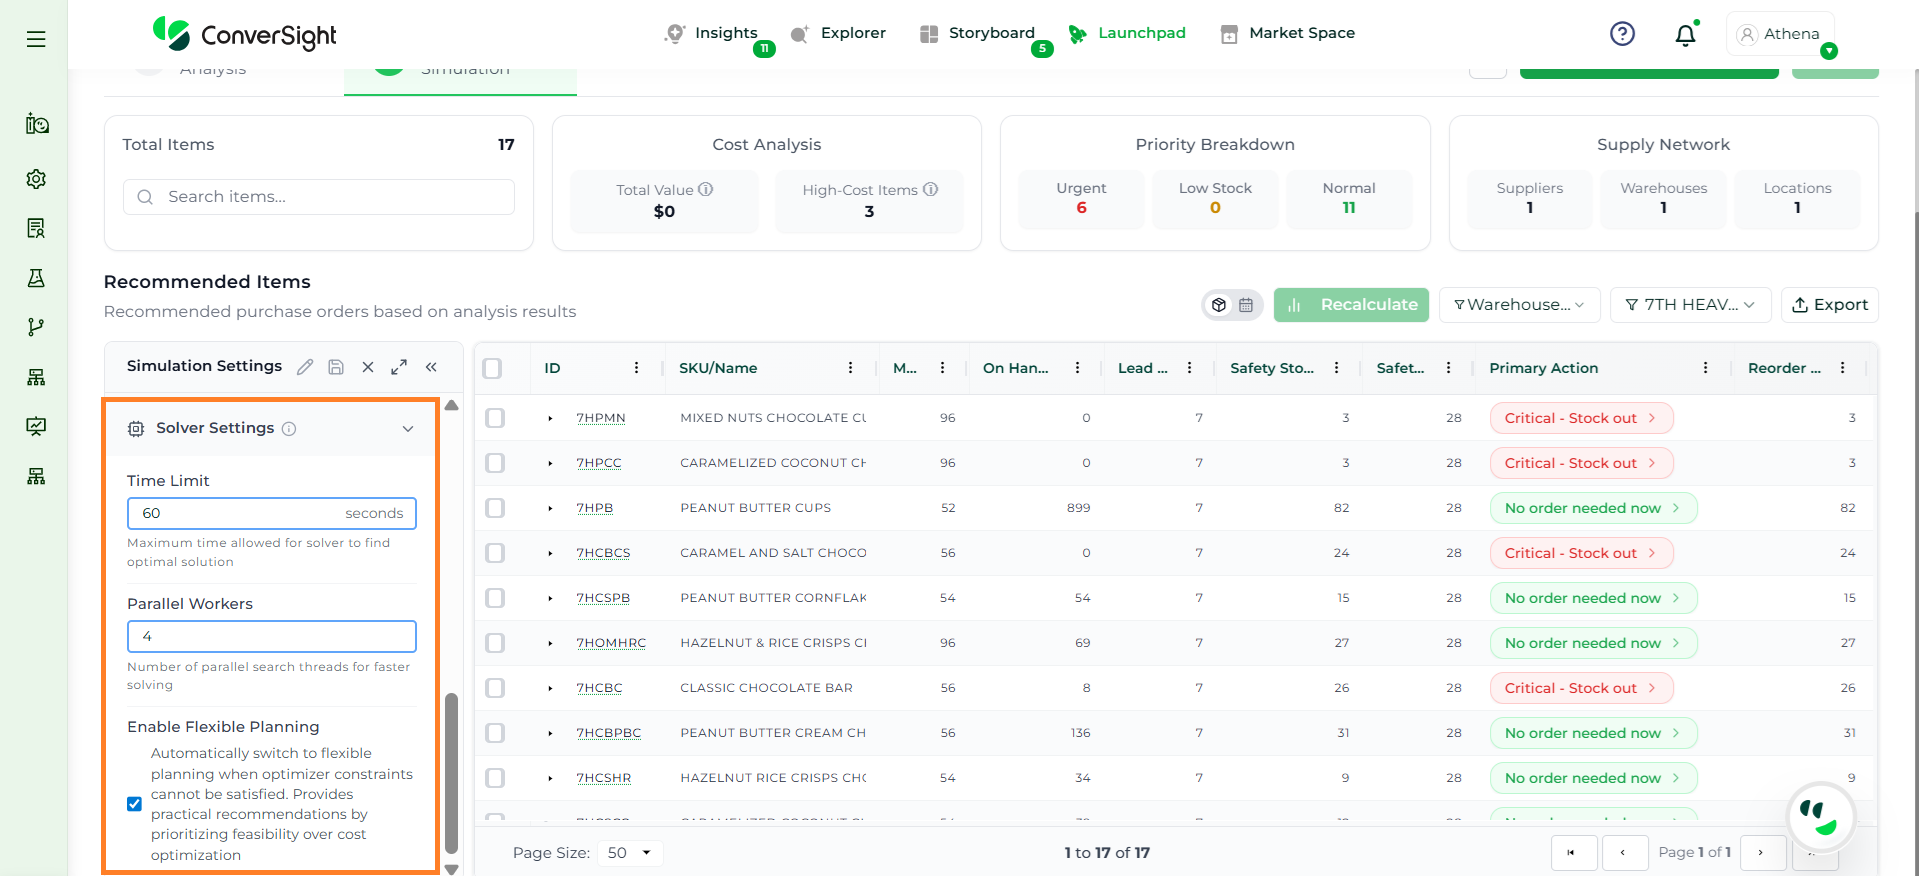
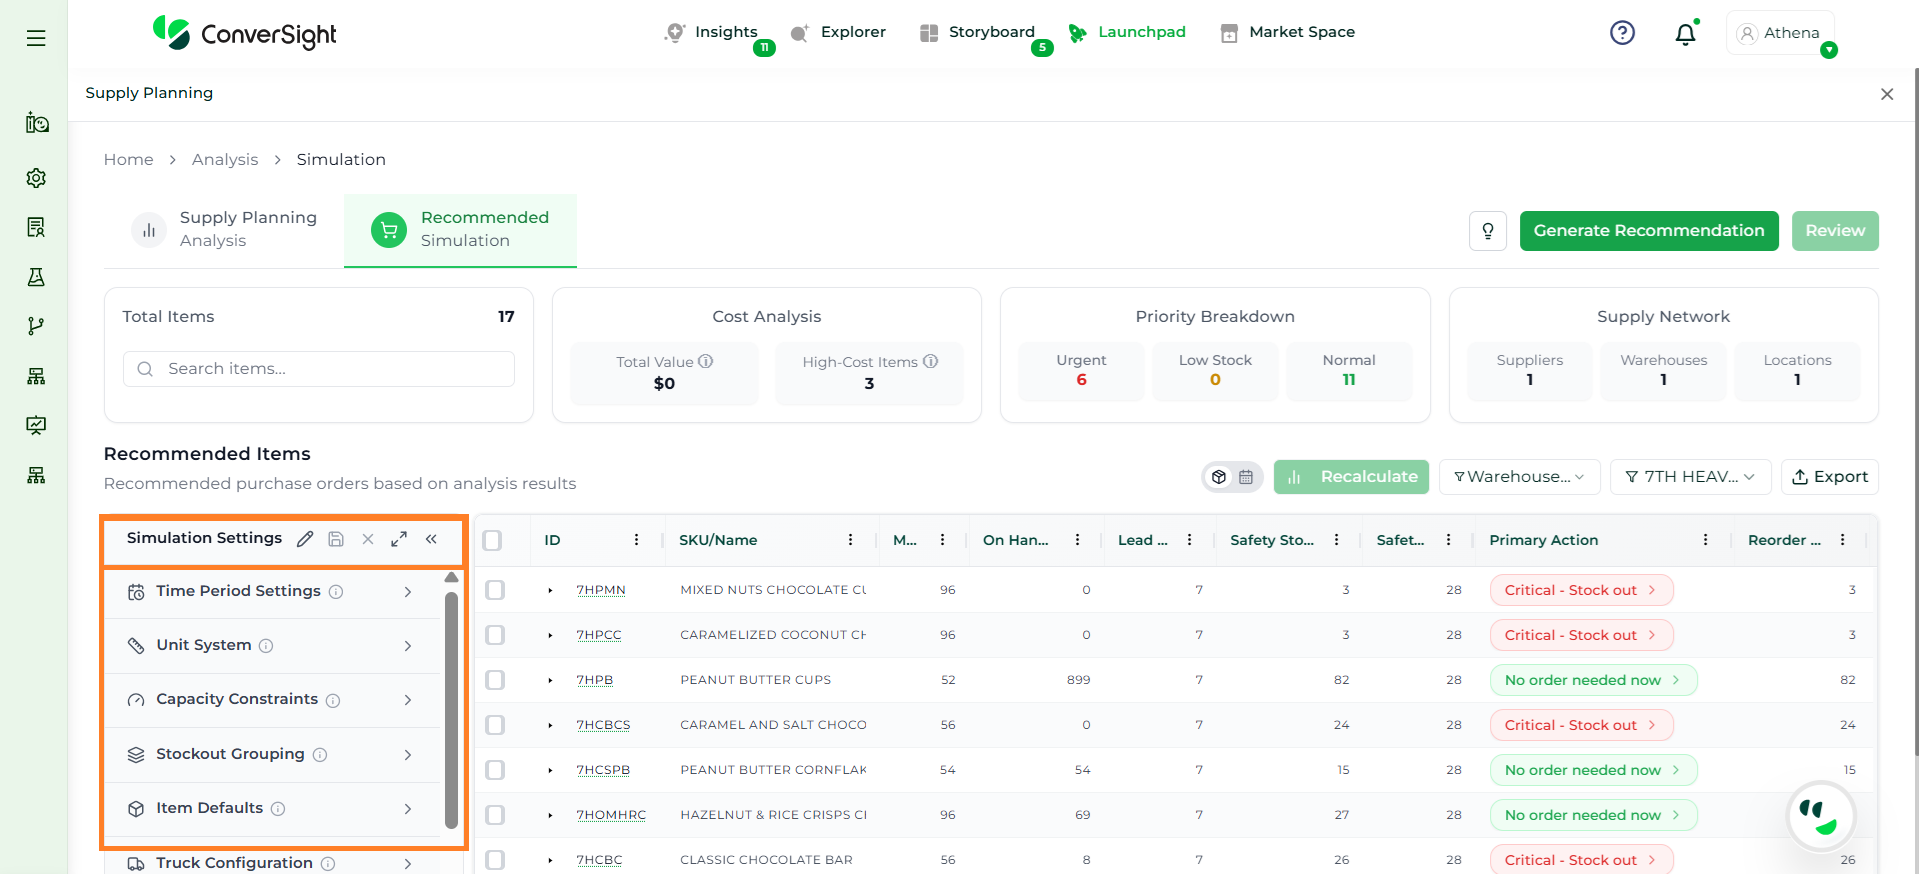
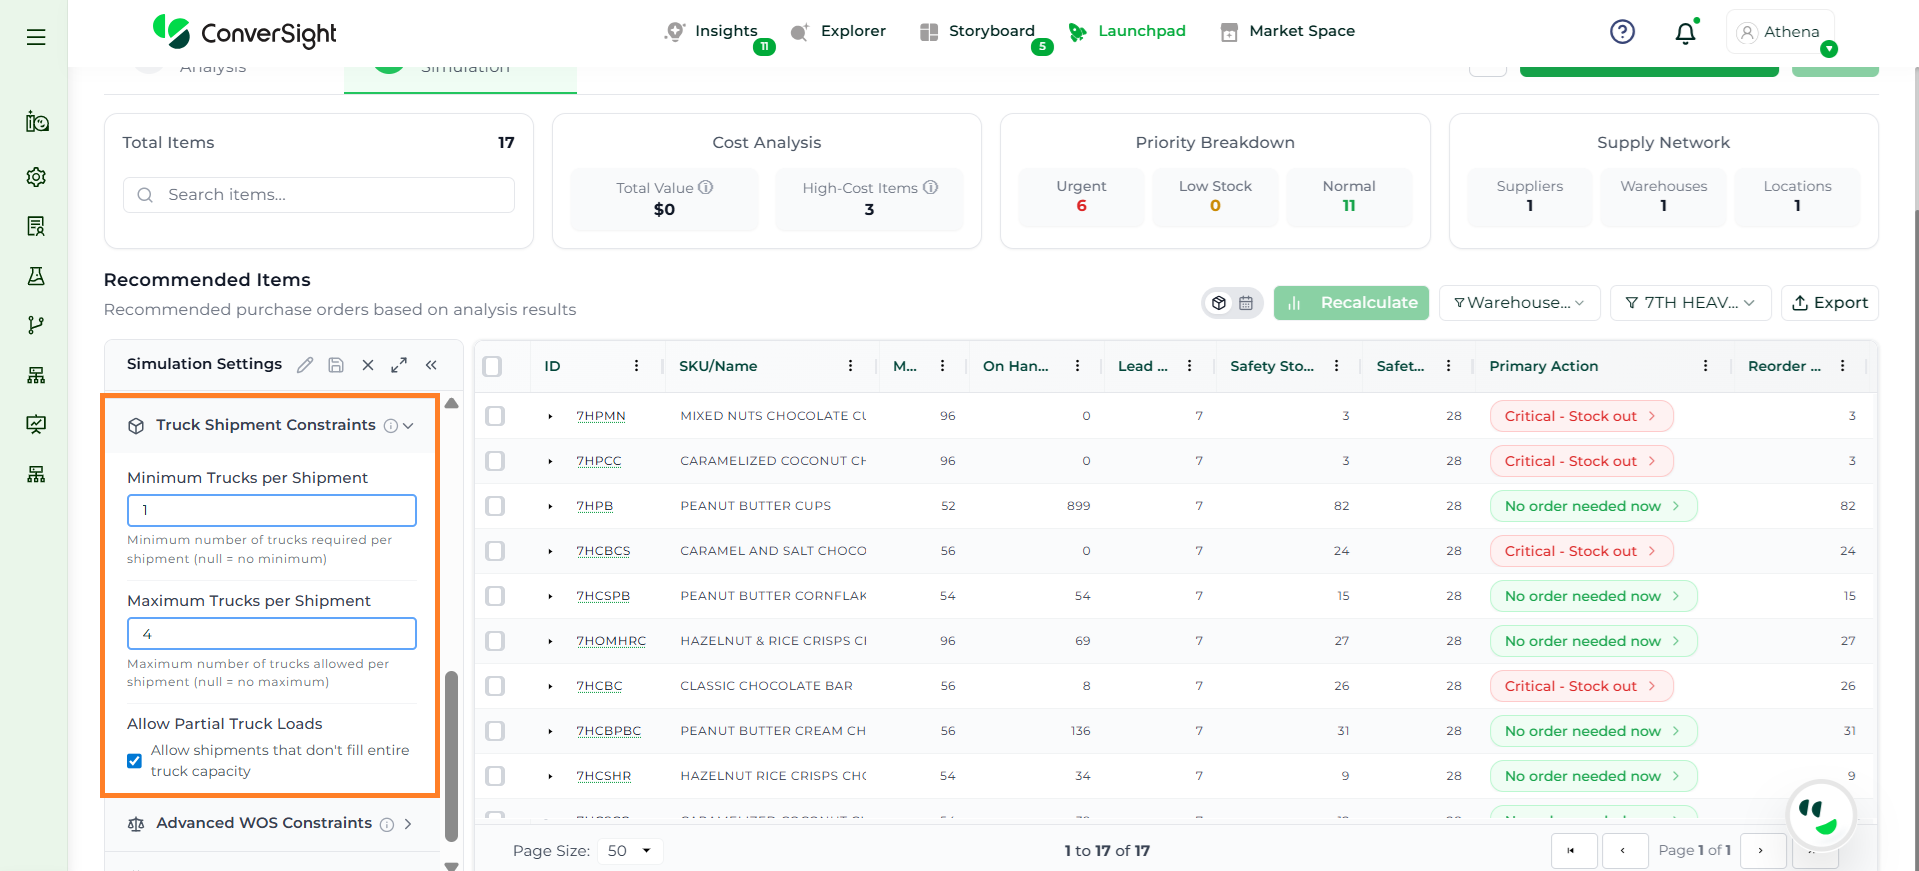
The Simulation Settings section allows users to configure how recommendations are generated within the Recommended Simulation module. These settings are accessible from the corner of the page, where users can interact with the following controls:
Edit: Modify simulation parameters
Save: Apply and store changes
Maximize Panel: Open the panel for a detailed view
Collapse Panel: Minimize the panel for a compact view
This section is essential as it defines the rules, constraints, and assumptions used by the simulation engine to calculate recommendations, ensuring outputs align with business requirements.
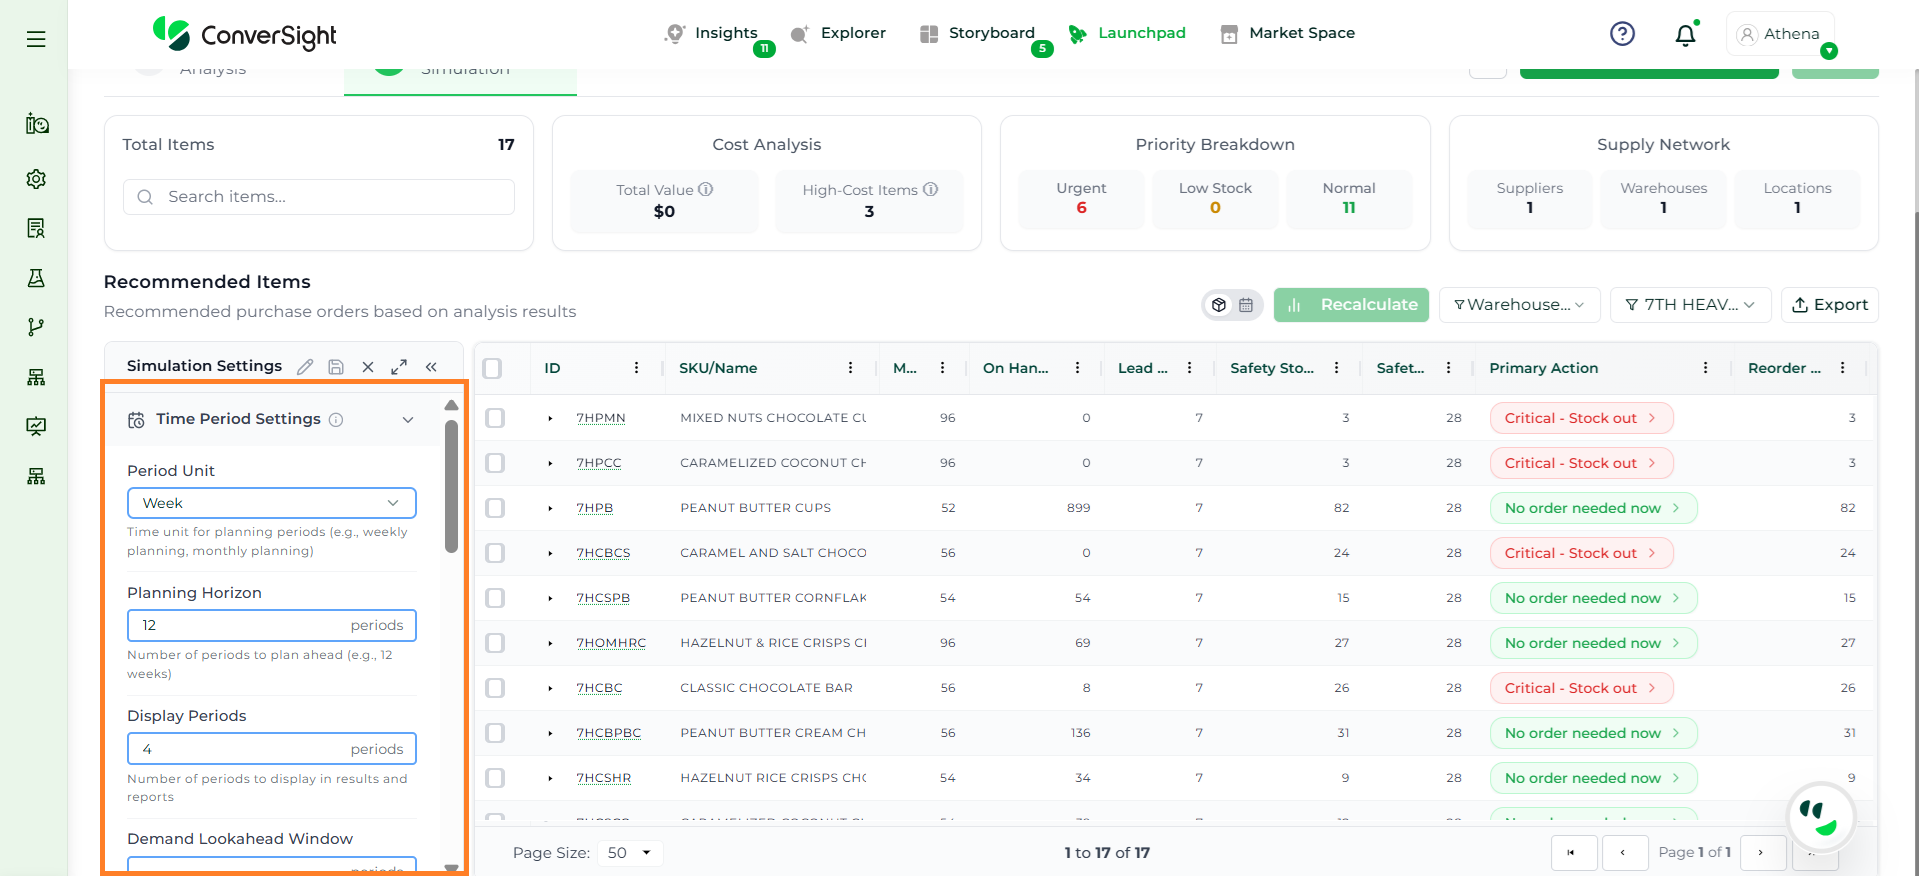
The Time Period Settings section defines how planning is structured over time, including the planning horizon, time granularity, and how demand is distributed across periods.
Field
Description
Period Unit
Defines the time granularity for planning (e.g., weekly or monthly).
Planning Horizon
Specifies how many future periods the system should plan for (e.g., 12 weeks).
Display Periods
Controls how many periods are shown in results and reports.
Demand Lookahead Window
Defines how far ahead the system considers demand.
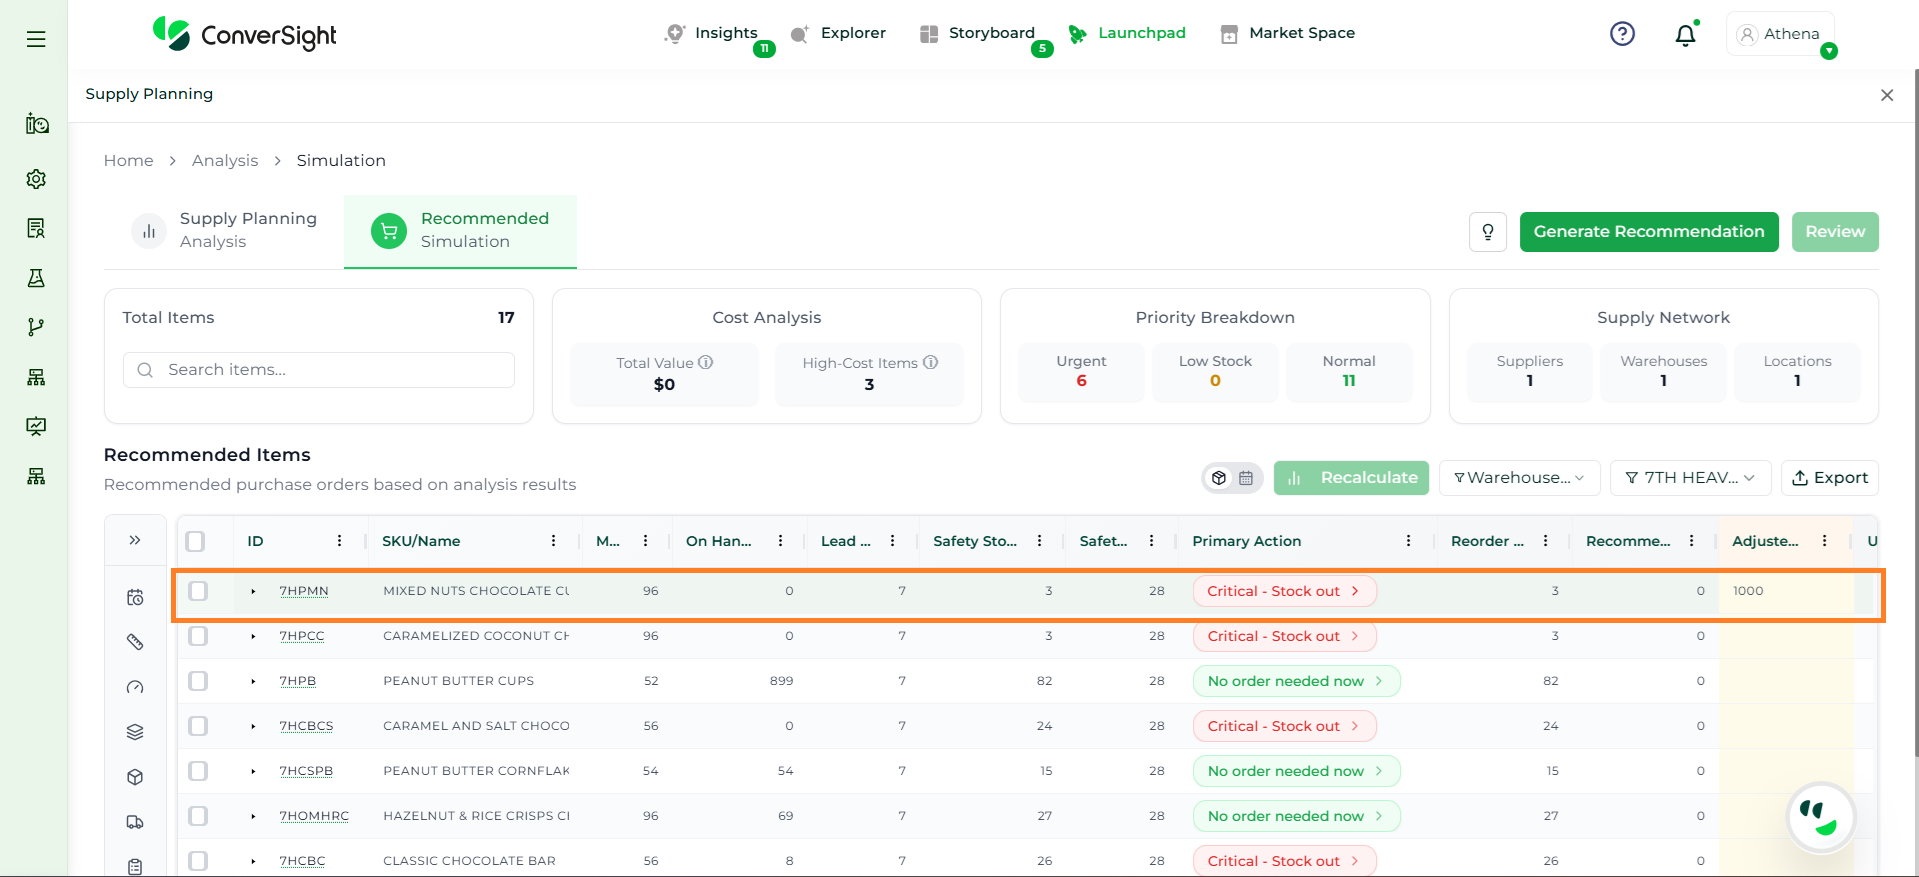
The Primary Action column indicates the system’s recommended decision for each item—such as placing an order, taking no action, or reviewing constraints. It helps users quickly understand what needs to be done based on the simulation results.
When you expand the Primary Action of an item, a detailed recommendation view is displayed. This view provides complete transparency into how the recommendation was generated and what factors influenced it.
The expanded view includes the following sections:
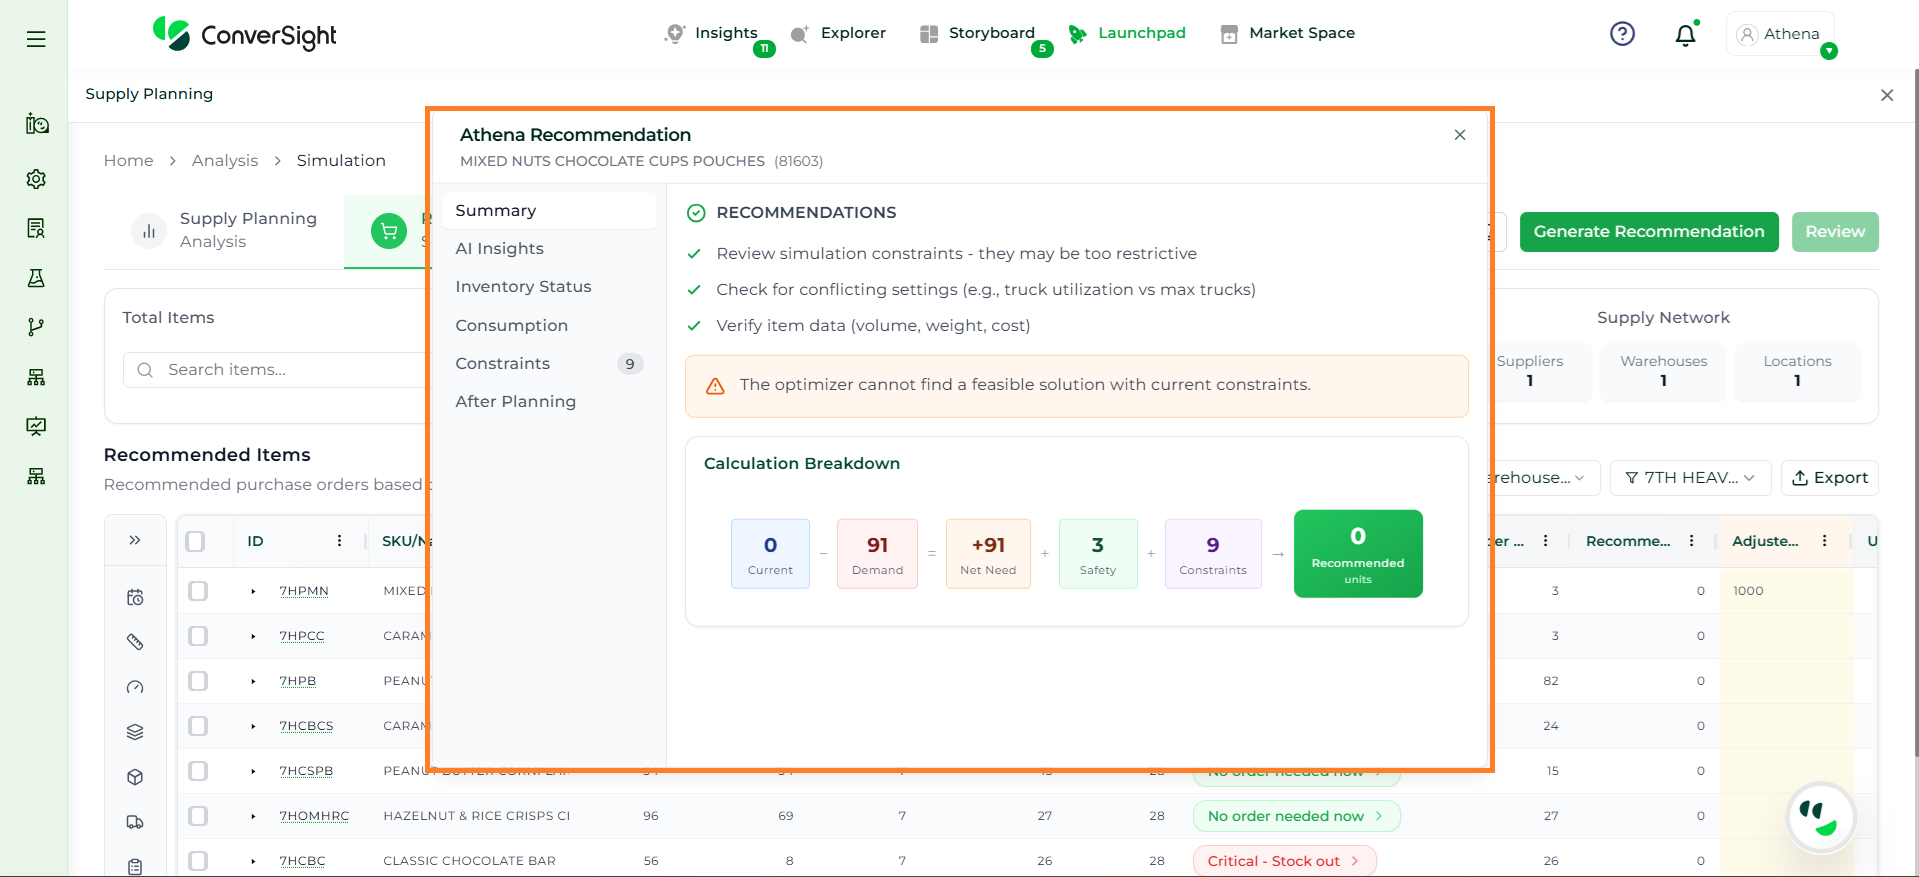
Summary
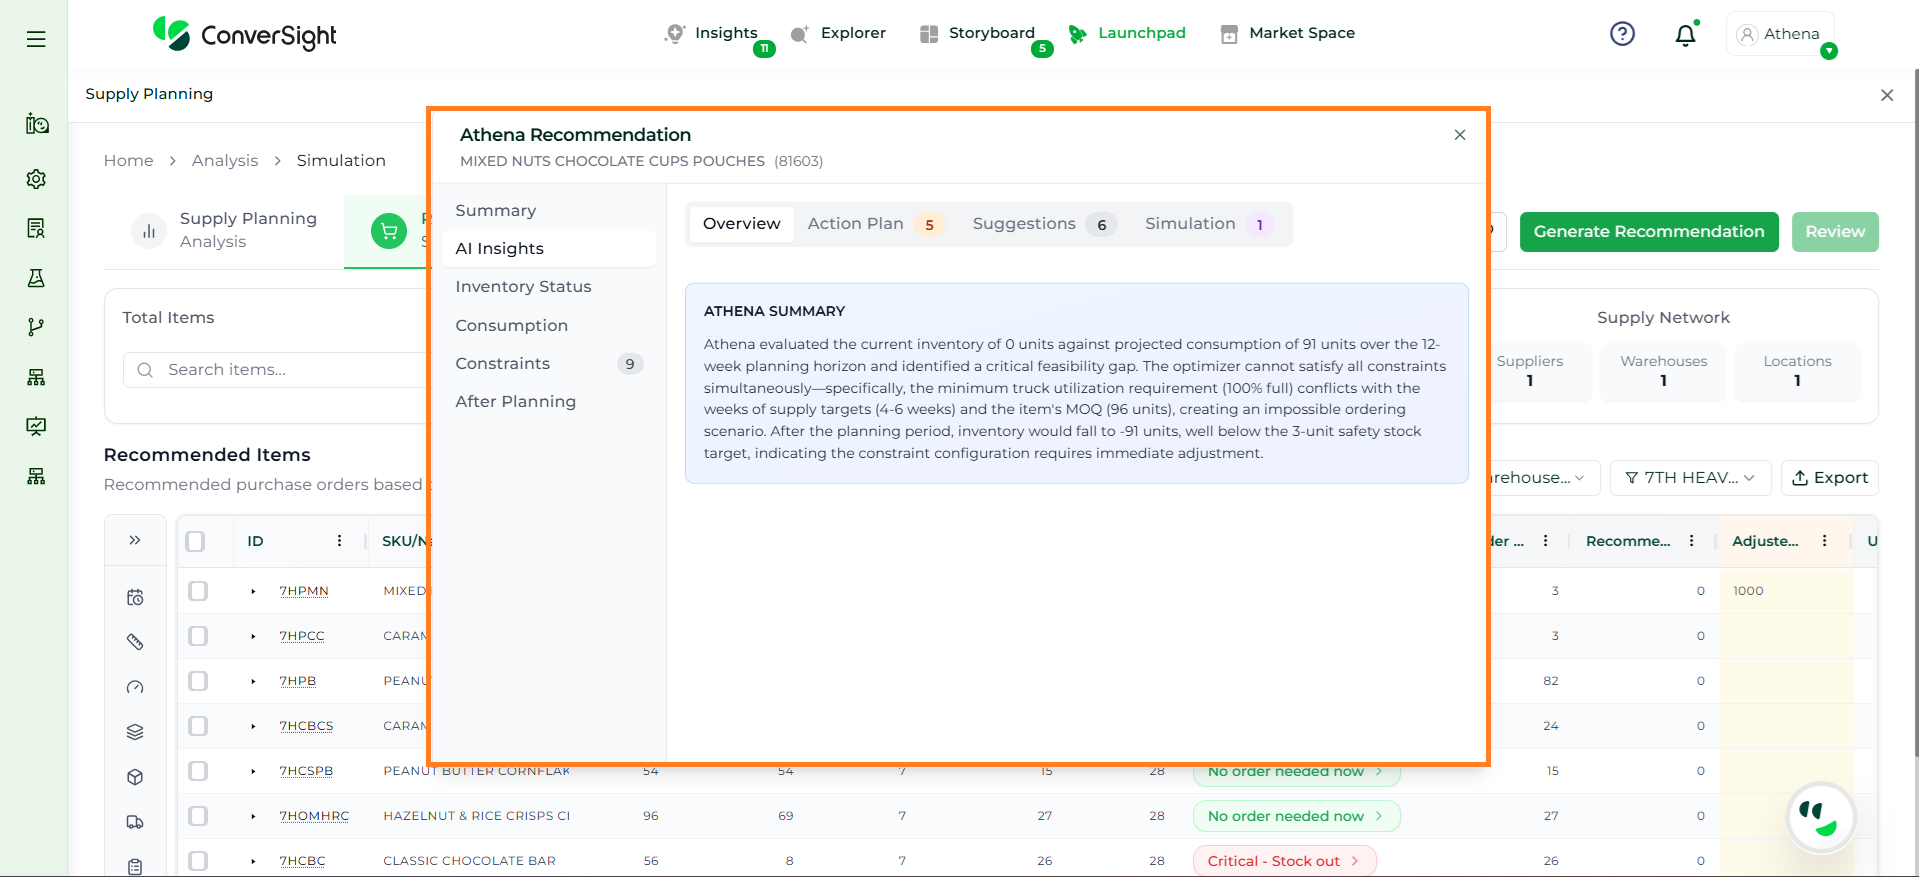
AI Insights
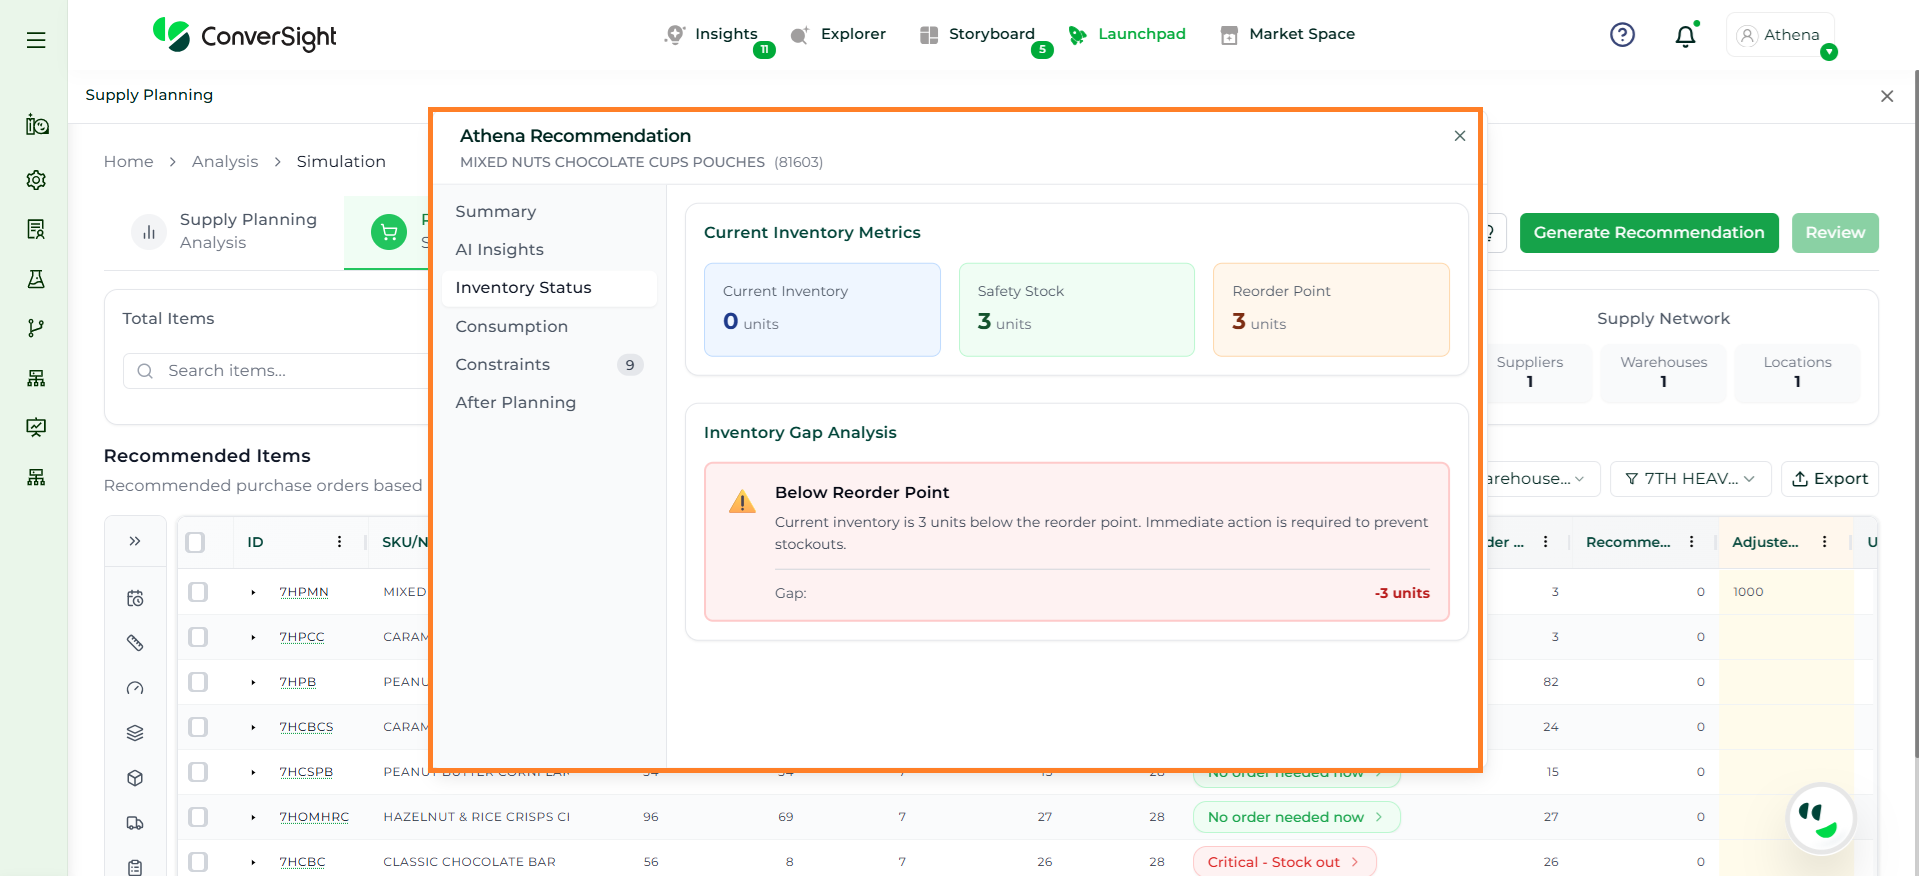
Inventory Status
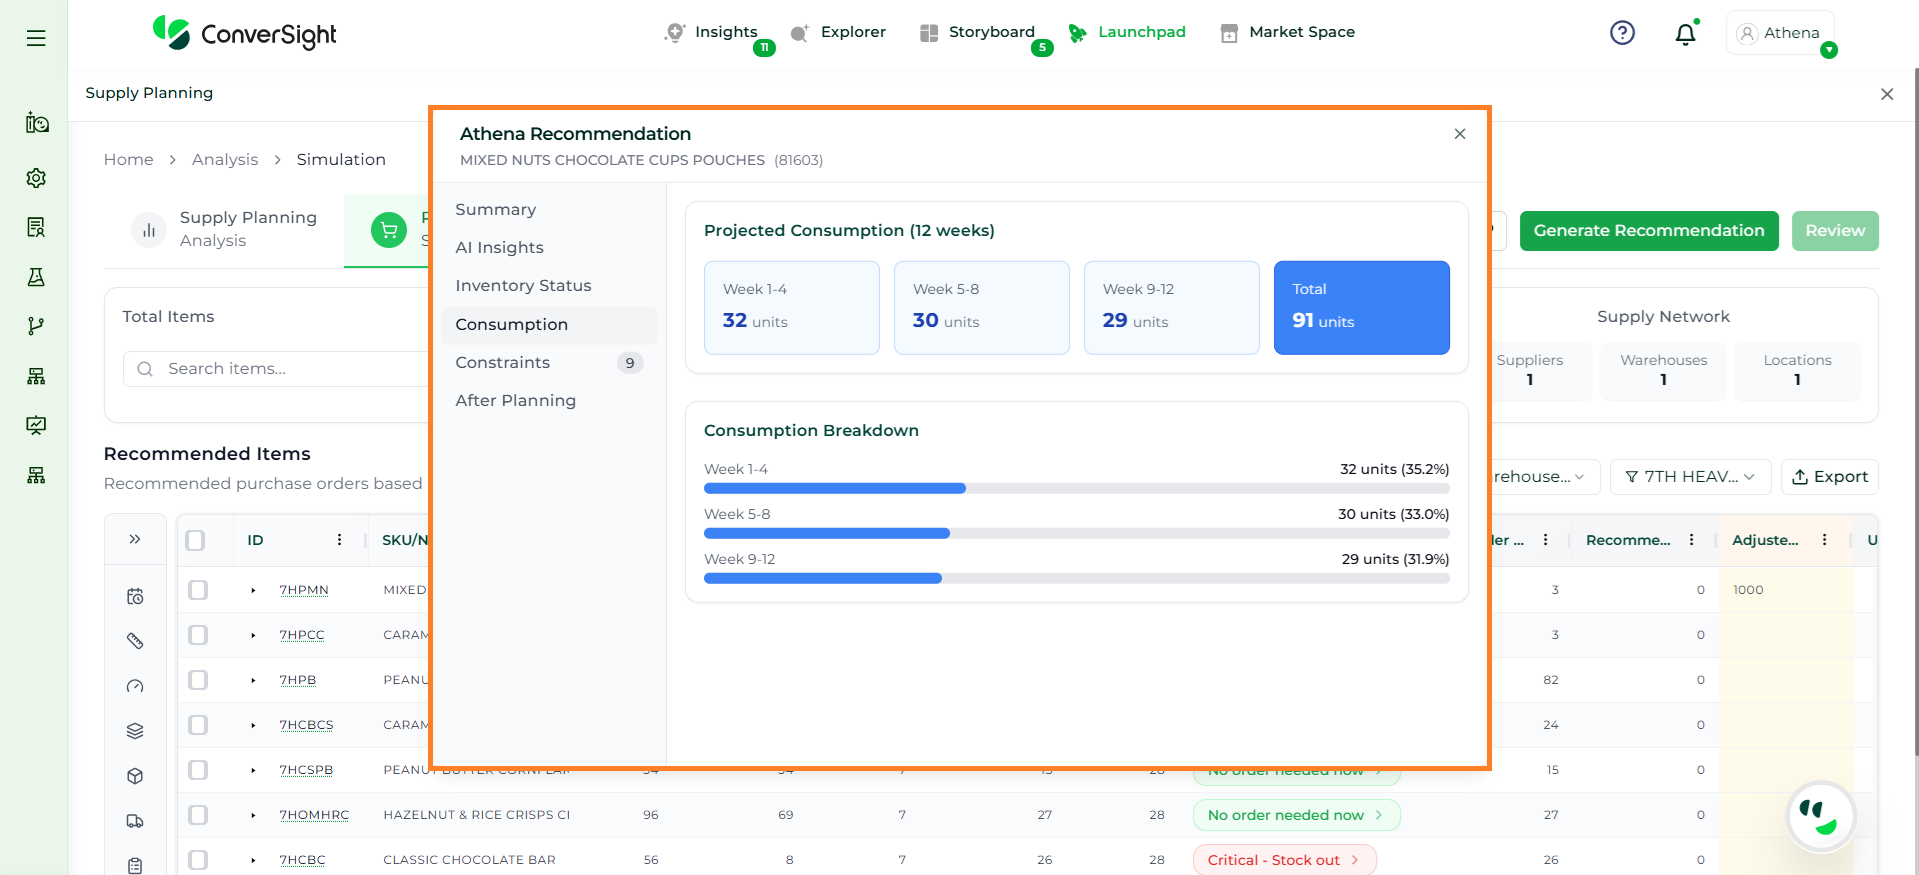
Consumption
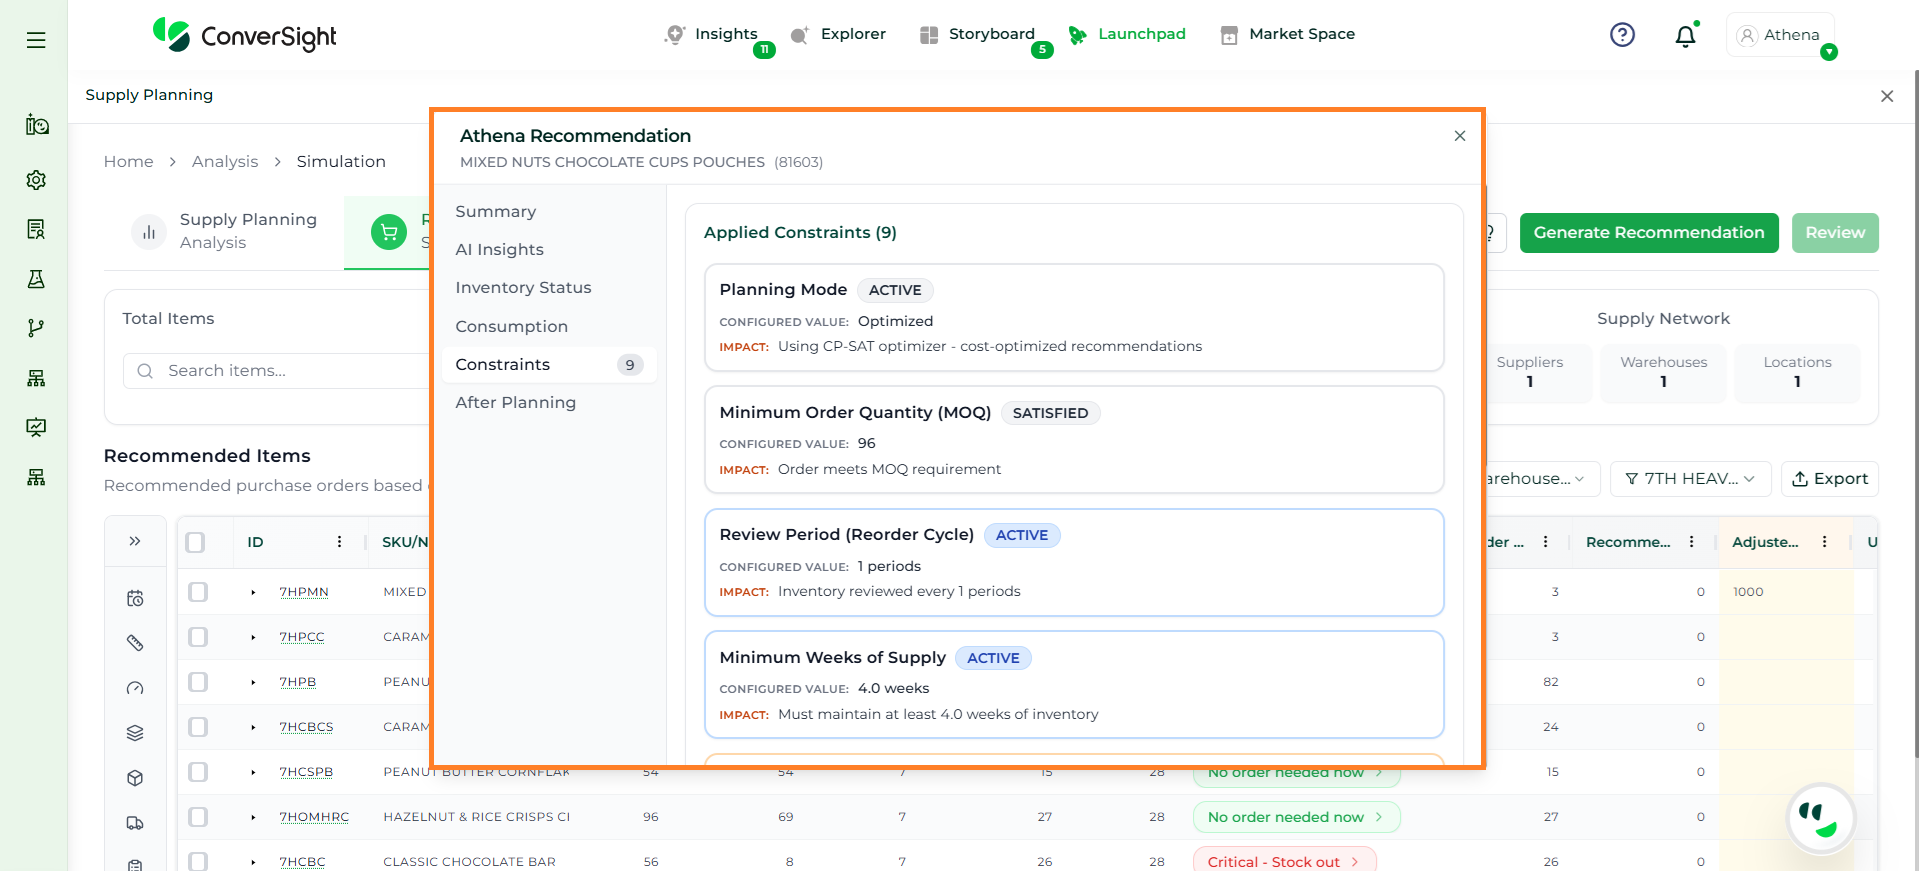
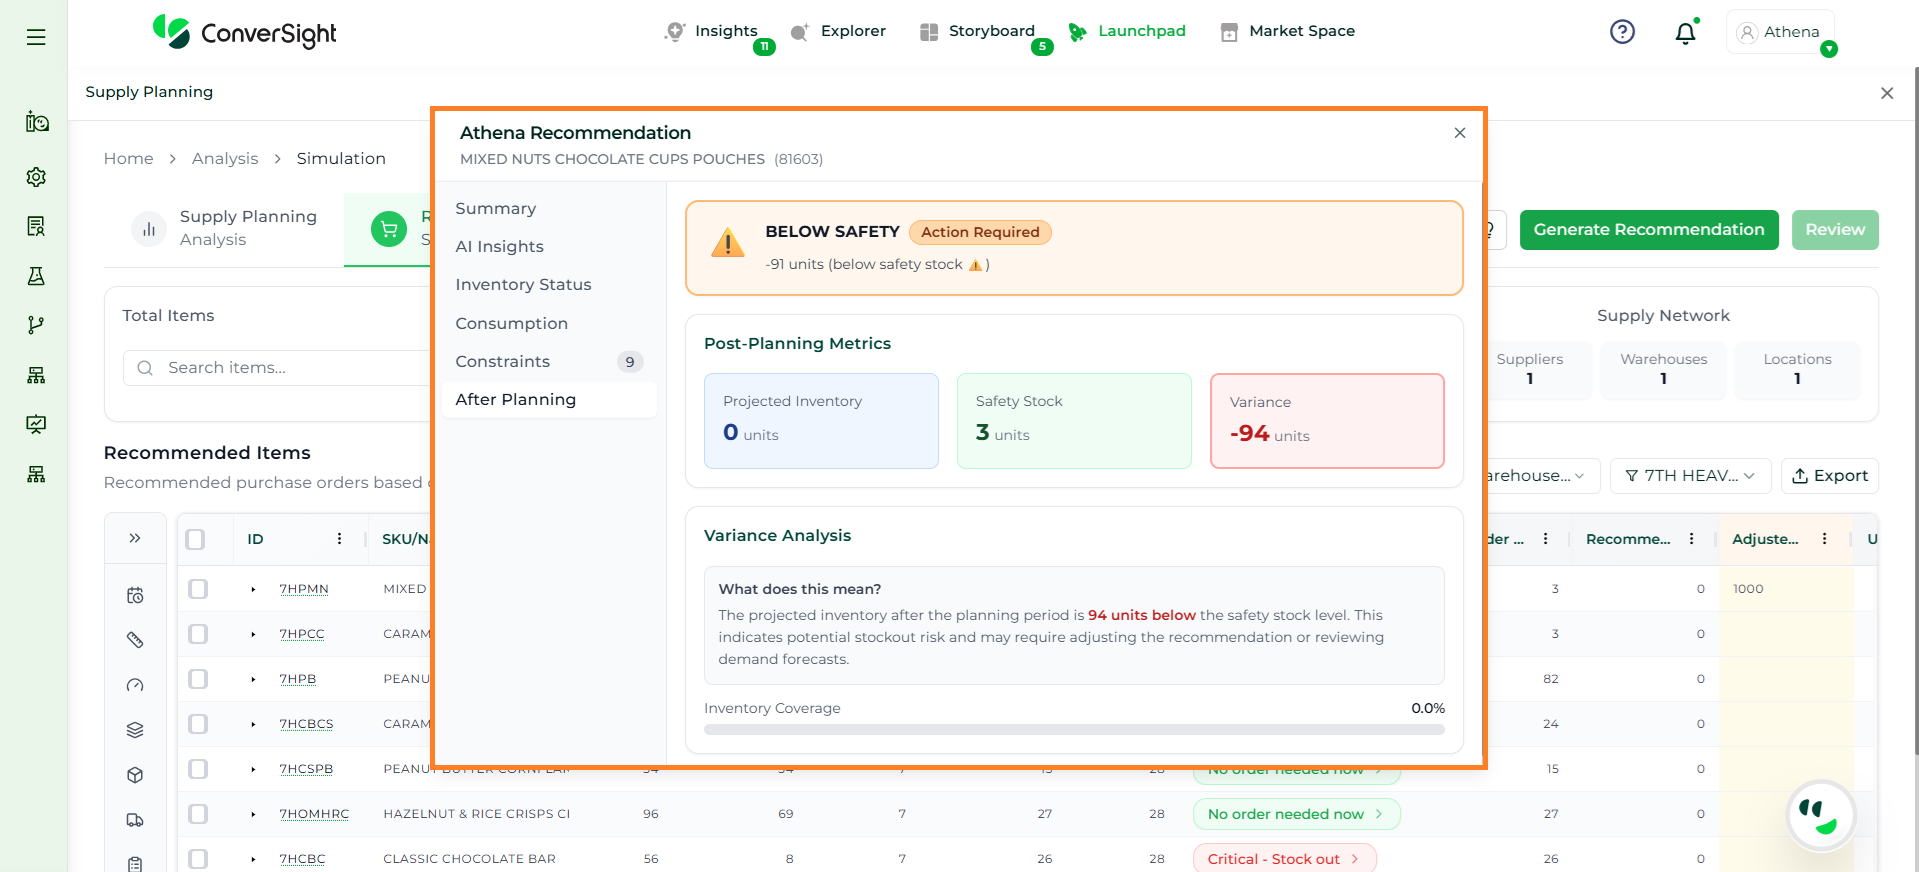
Constraints
After Planning
Each section provides specific insights to help users understand, validate, and act on the recommendation.
The Overview tab provides a high-level summary of the planning outcome. It explains the current inventory position, projected demand, and highlights whether the optimization model is feasible under the current configuration.
Athena evaluates key inputs such as inventory levels, demand over the planning horizon, lead time, and constraints to determine if a valid solution can be achieved. If conflicts exist, the system clearly explains the reasons, such as incompatible constraints or insufficient inventory.
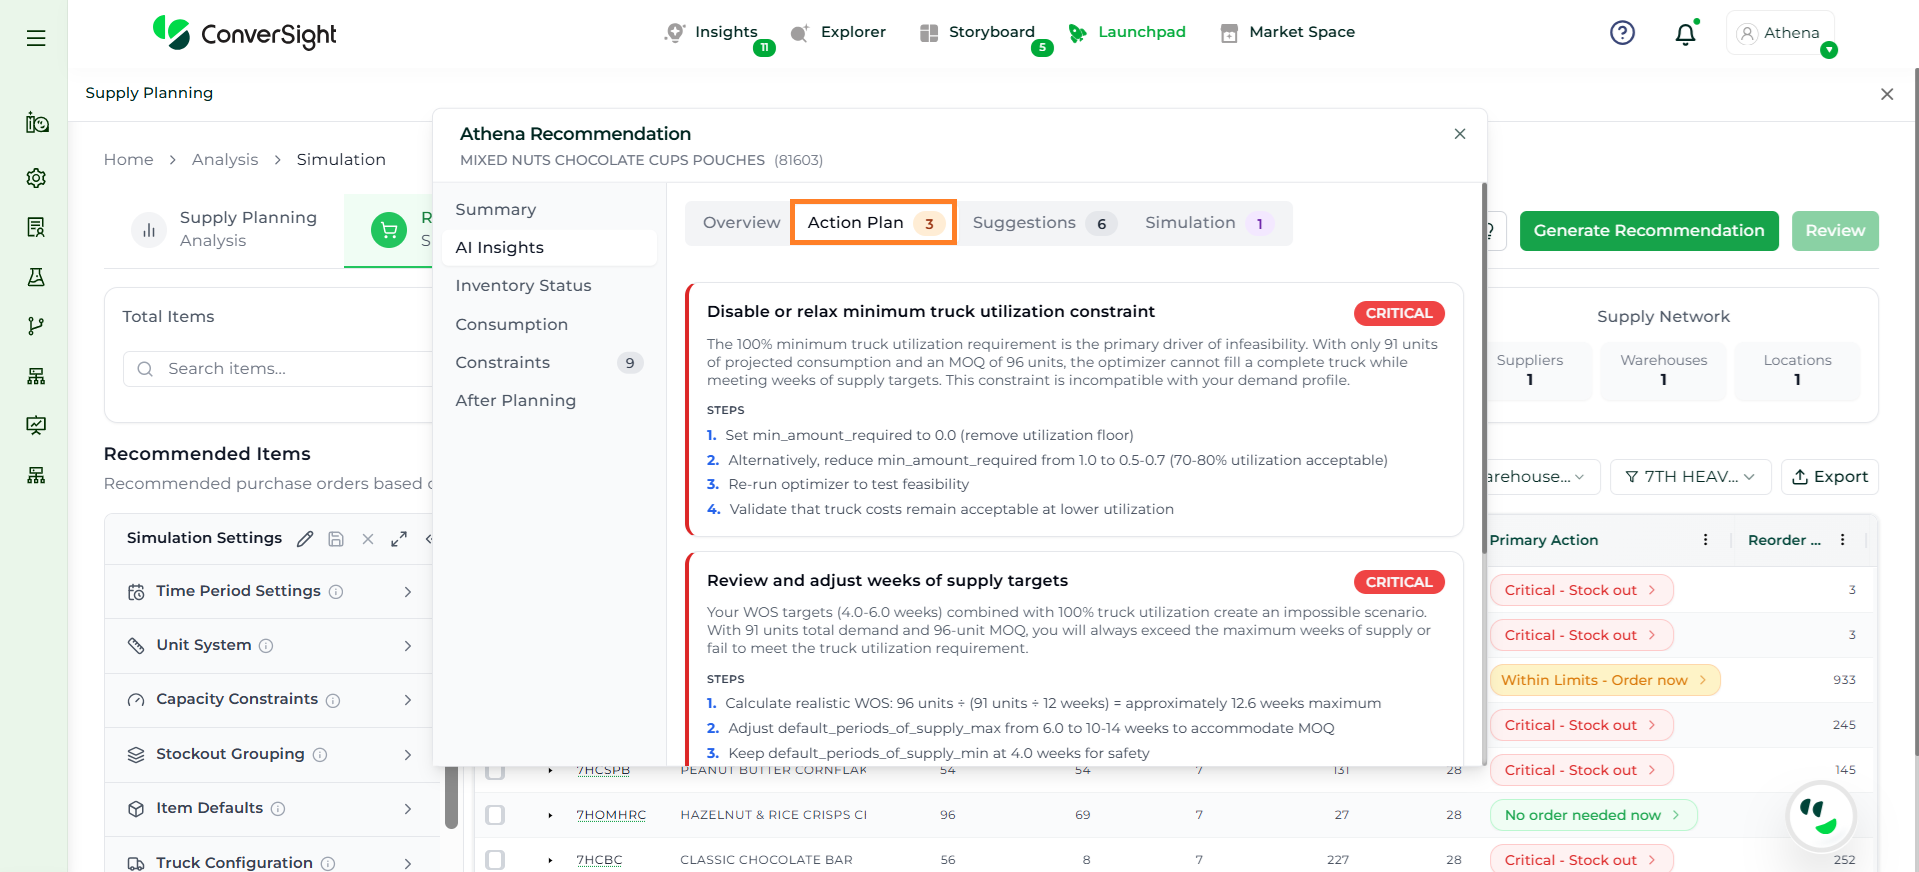
The Action Plan tab provides a structured set of corrective actions to resolve issues identified during planning. Each item represents a specific problem, such as constraint conflicts, stockouts, or infeasible configurations.
For every issue, Athena assigns a priority level (e.g., Critical, High) and provides clear, step-by-step guidance on how to address it. These actions may include adjusting constraints, modifying planning parameters, or reviewing configuration settings.
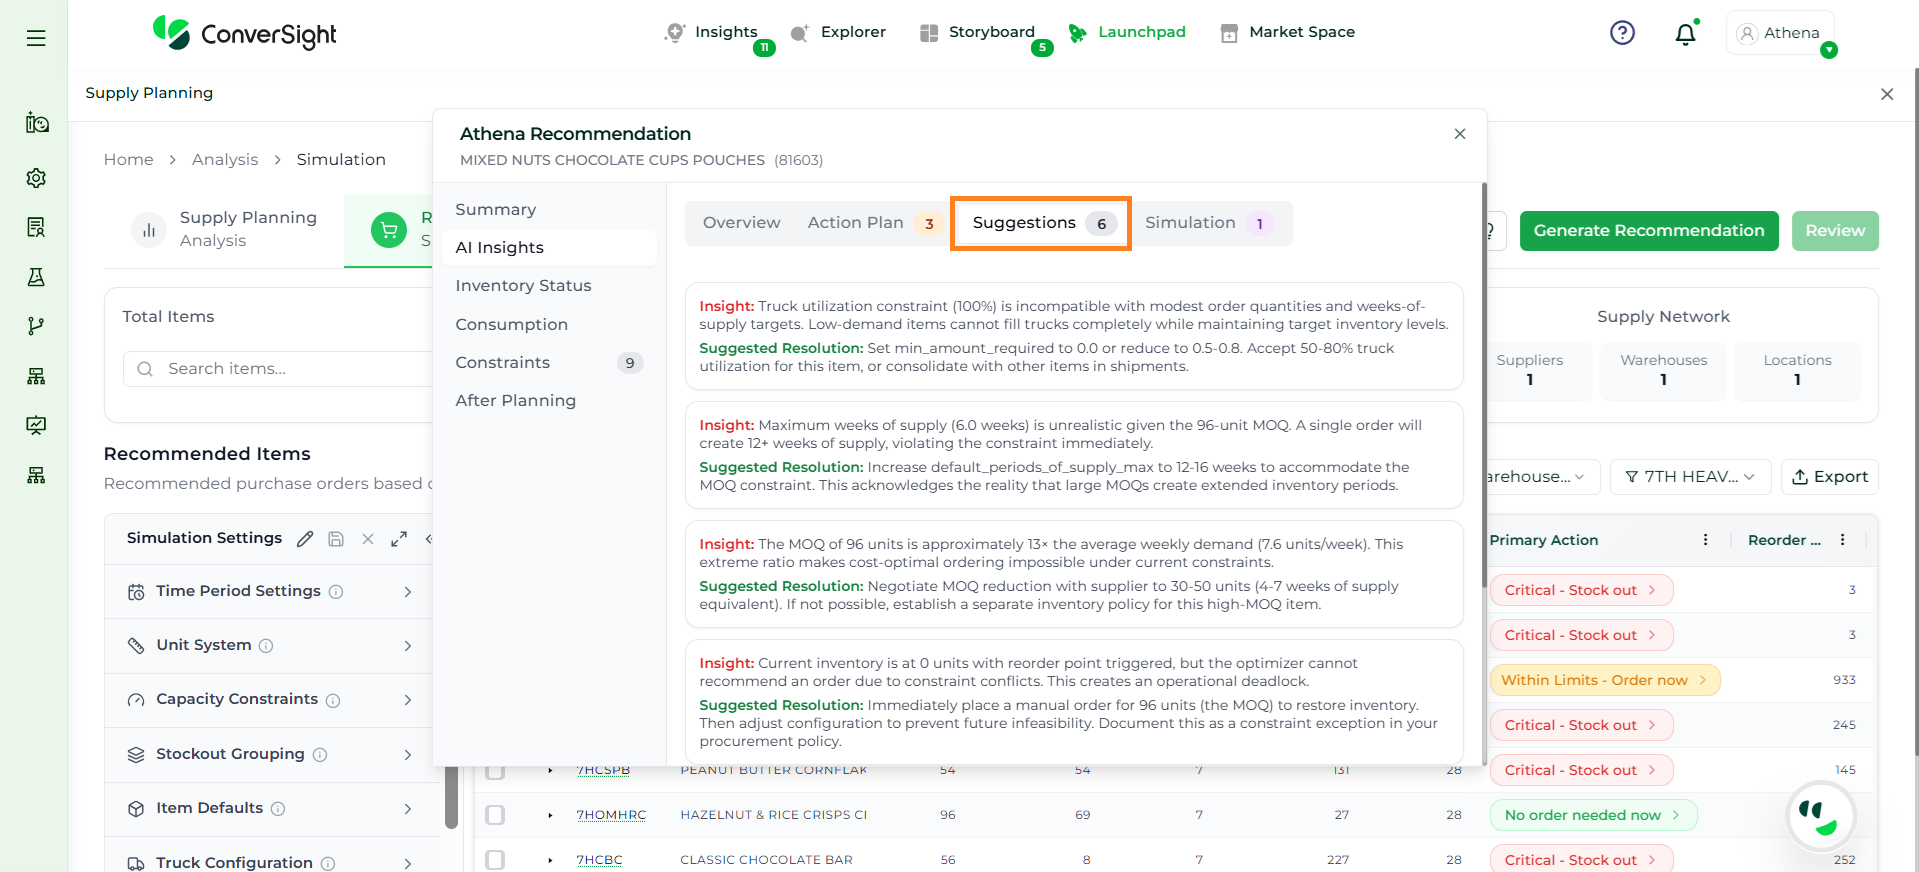
The Suggestions tab provides detailed insights and recommended improvements to enhance planning outcomes. Unlike the Action Plan, which focuses on resolving issues, this section emphasizes optimization and better decision-making.
Athena highlights the underlying reasons behind each issue and suggests alternative configurations or parameter adjustments. These may include changes to MOQ, weeks of supply, review periods, or other planning constraints.
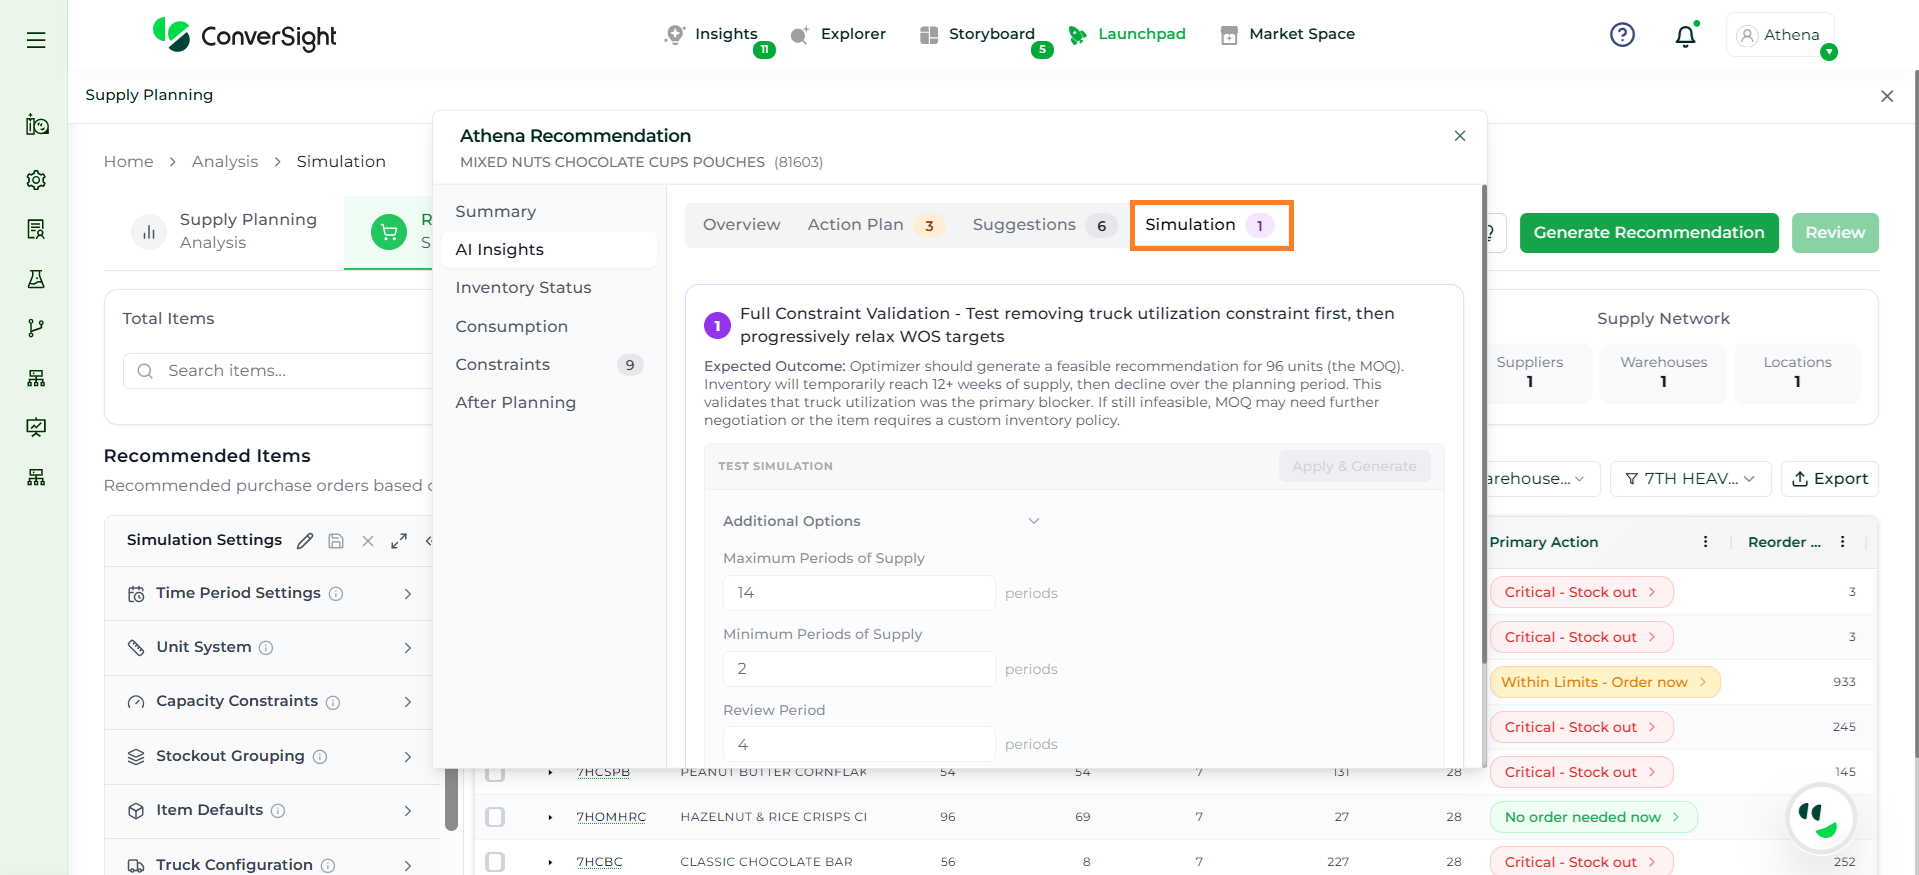
The Simulation tab enables users to test and validate changes before applying them to the actual plan. It supports what-if analysis by allowing users to modify constraints and planning parameters in a controlled environment.
Users can work with different configurations, such as relaxing constraints or adjusting inventory policies, to understand their impact on feasibility and outcomes. This helps identify which constraints are causing issues and ensures that the final decisions are practical and effective.
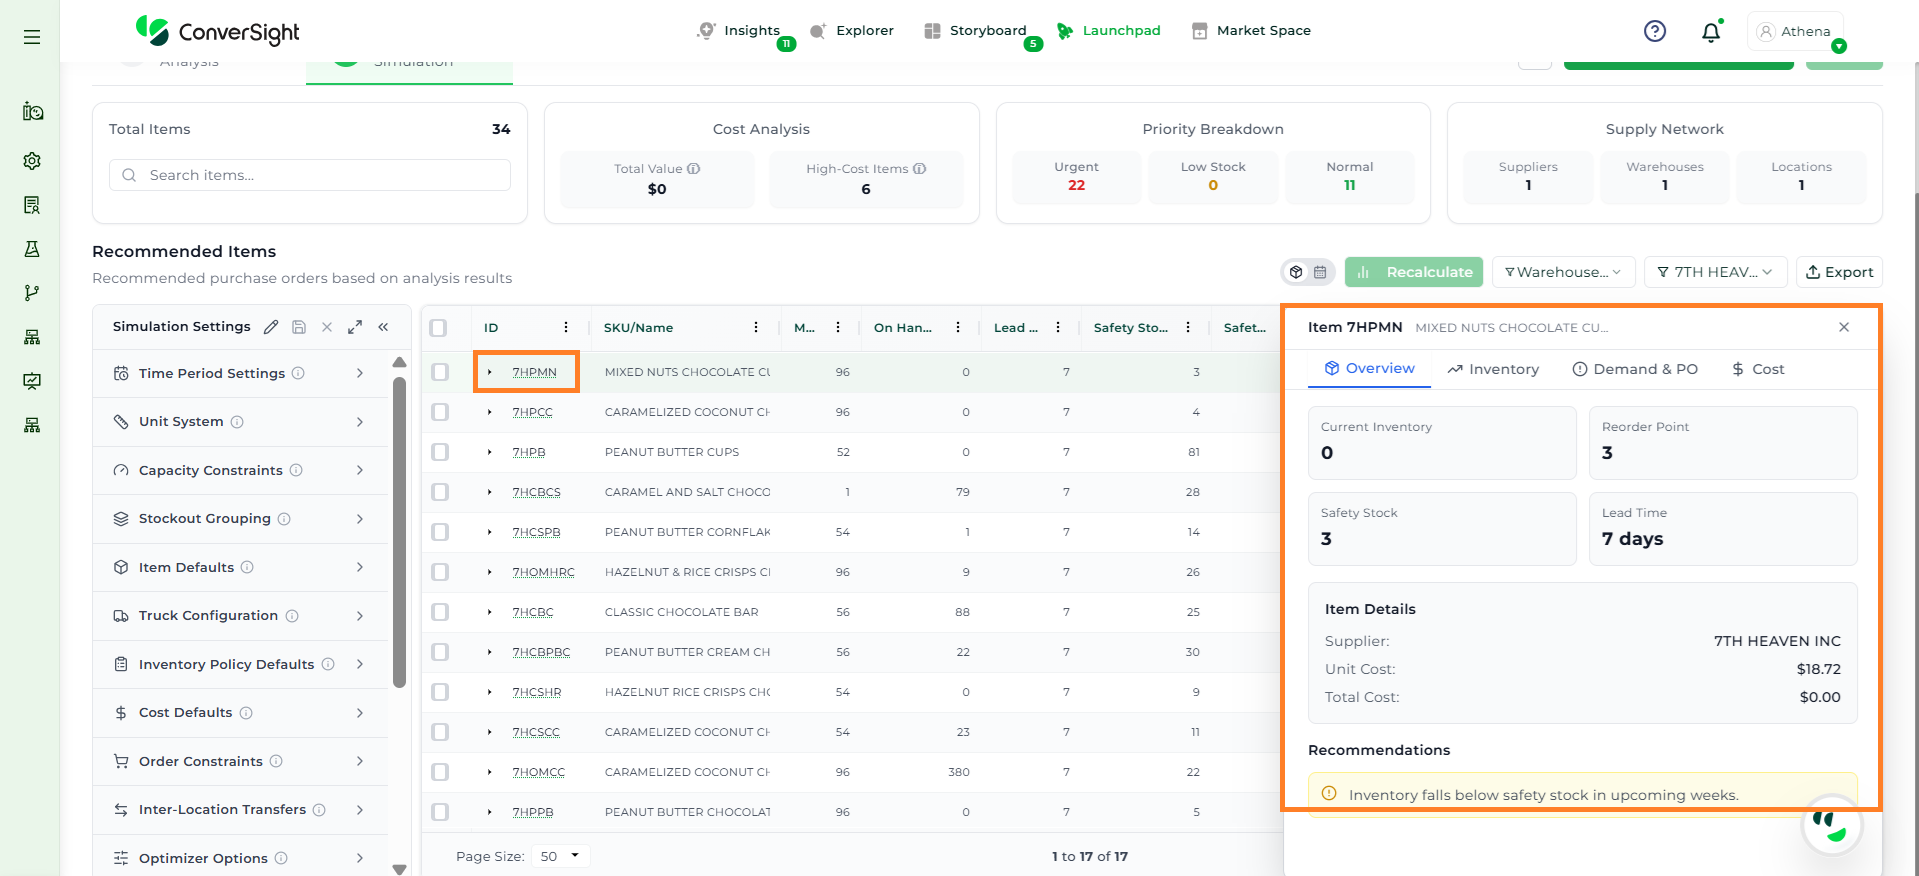
This panel provides a structured view of all relevant data required to evaluate the item’s inventory position, demand behavior, and cost impact. It serves as a decision-support interface to help users determine appropriate replenishment actions.
The Overview tab presents a consolidated summary of the item’s current state. It includes key parameters such as current inventory, reorder point, safety stock, lead time, supplier details, and unit cost.
This section is designed to give users a quick understanding of whether the item is adequately stocked or at risk. By reviewing these values, users can immediately assess if replenishment is required without going into detailed analysis.
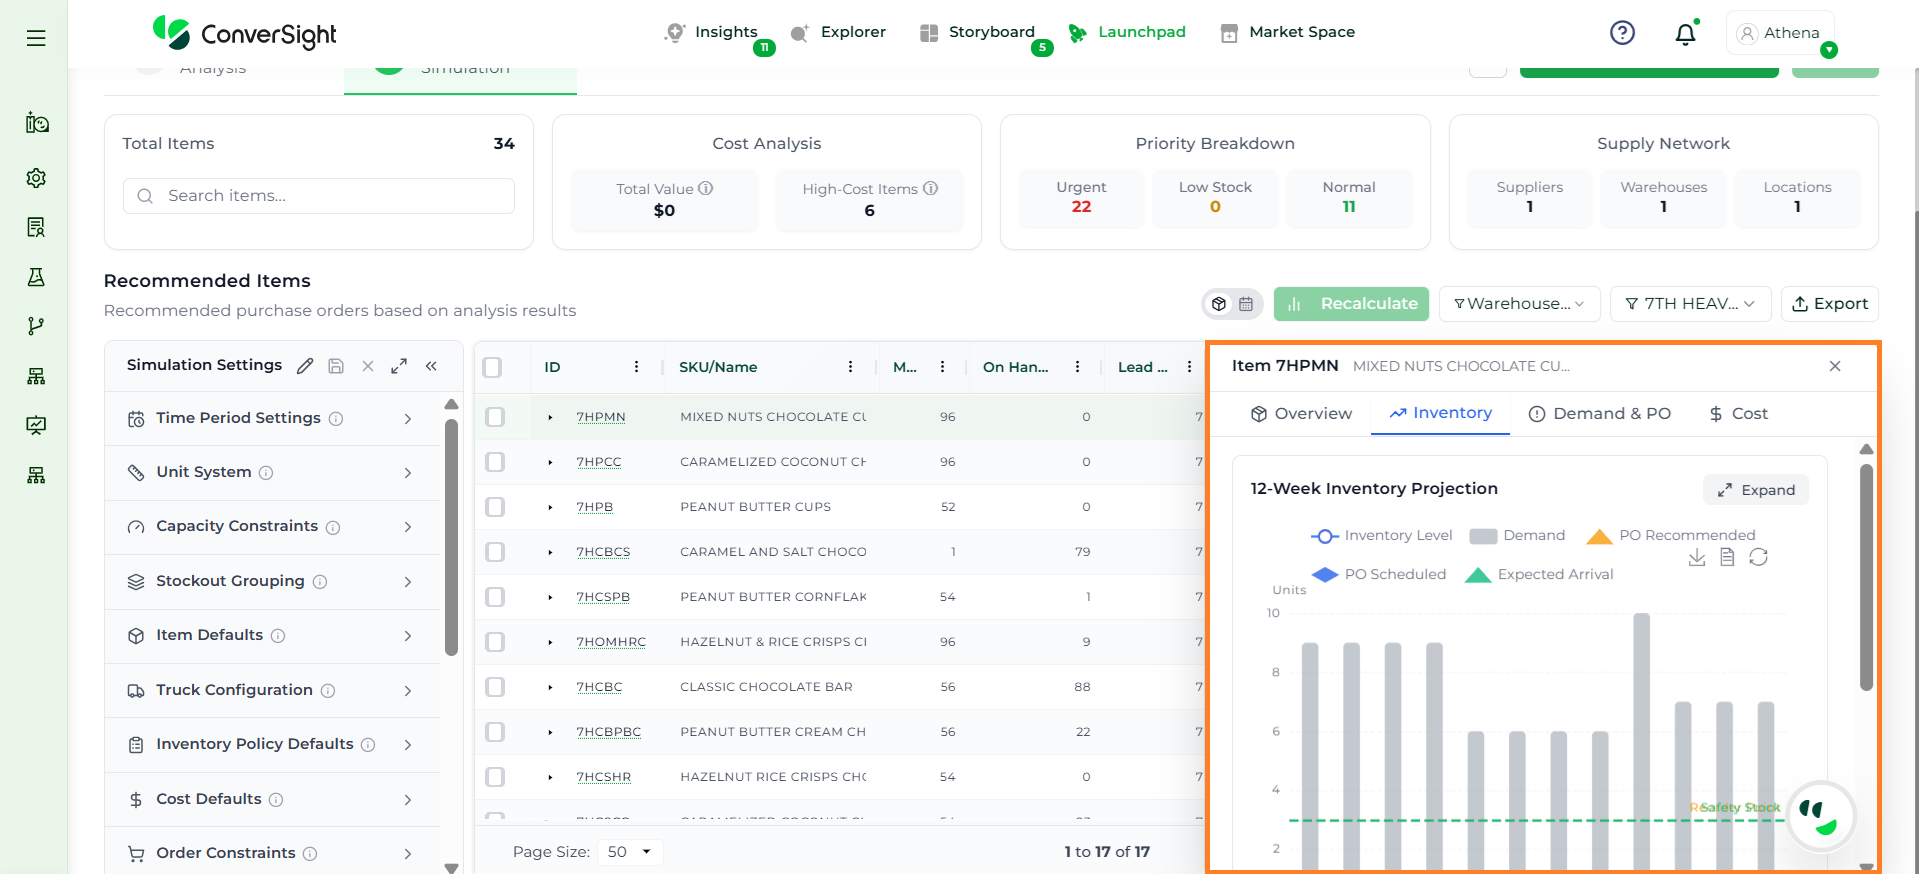
The Inventory tab provides a time-phased projection of inventory levels across the defined planning horizon. It visually represents how inventory changes over time based on demand, incoming supply, and safety stock thresholds.
This view helps users identify critical scenarios such as potential stockouts, excess inventory, or periods where inventory falls below safety levels. It also indicates when recommended or scheduled purchase orders are expected to arrive.
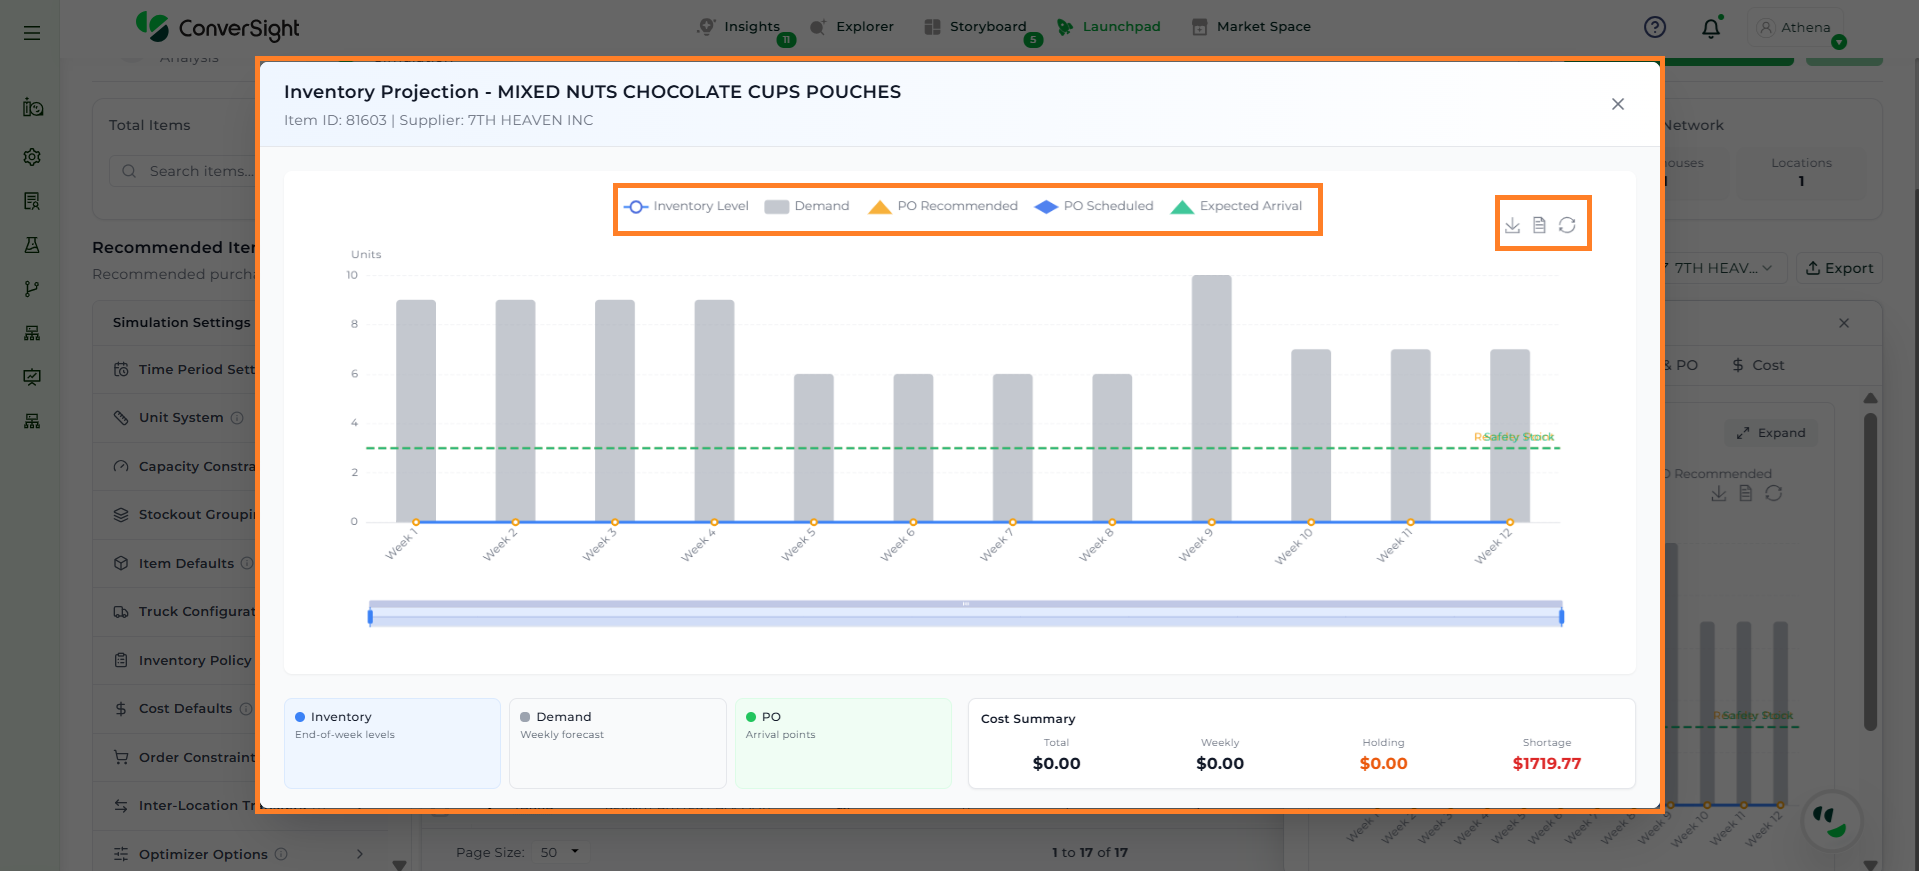
When expanded, the Inventory view opens in a detailed mode, providing an enlarged and more interactive representation of the inventory projection chart.
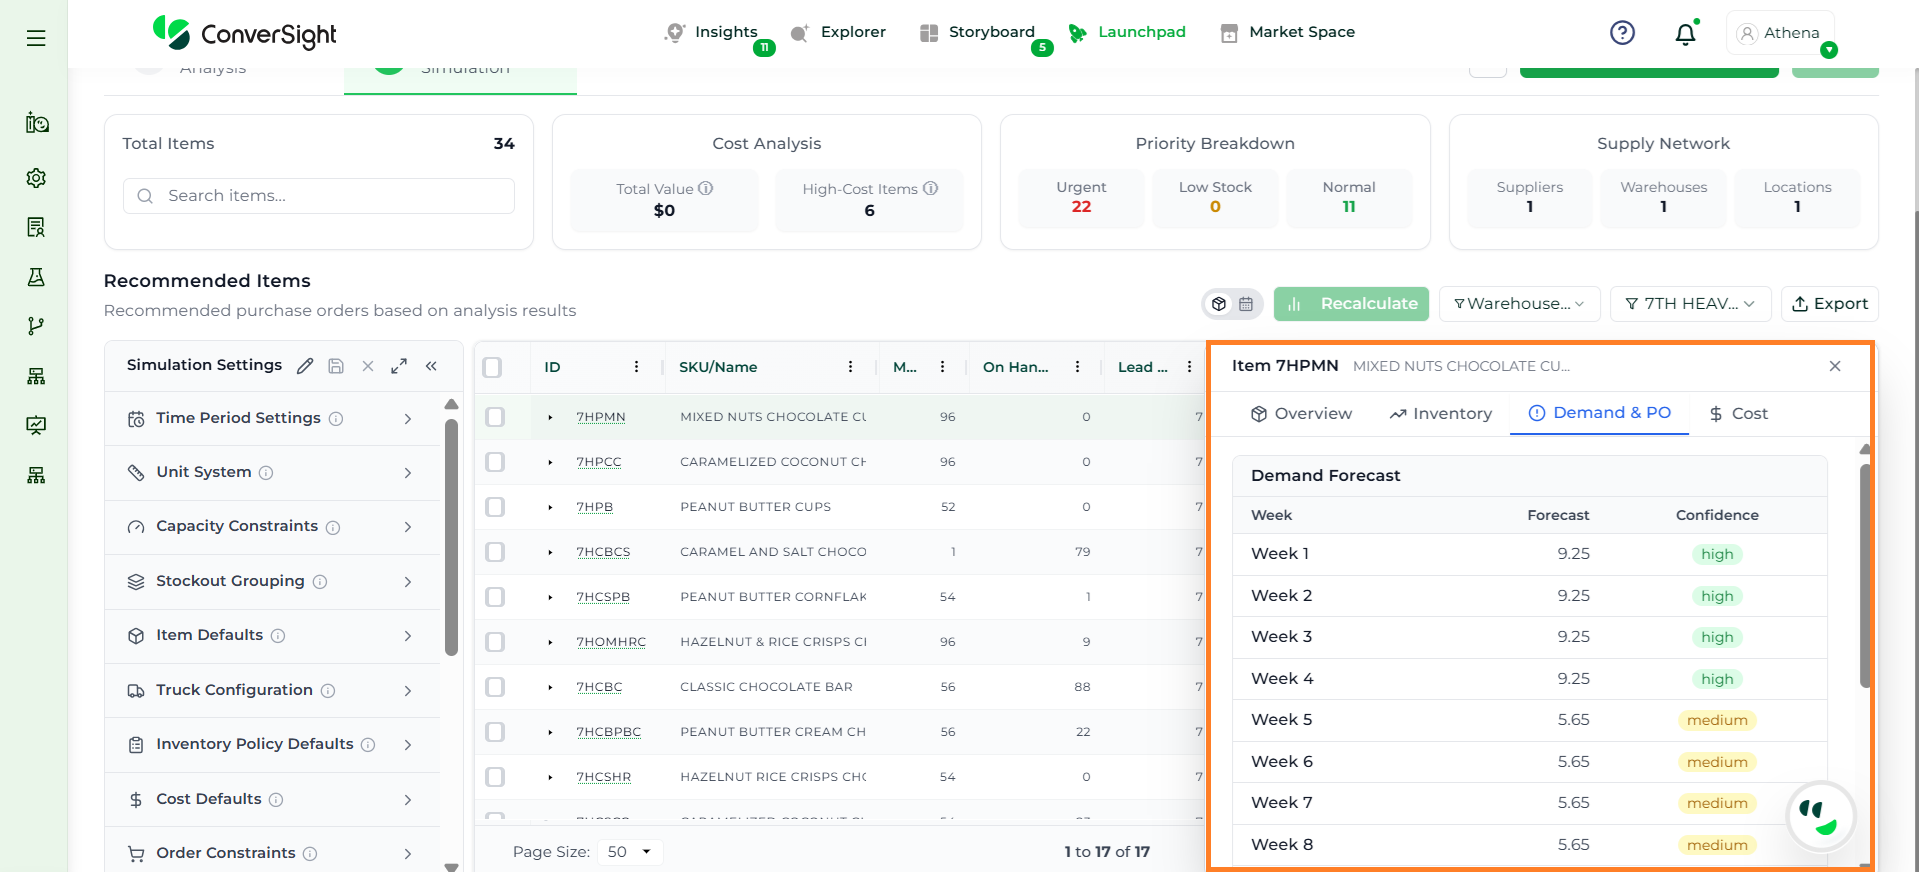
The Demand & PO tab focuses on future demand patterns and the reliability of the forecast. It displays demand projections across time along with associated confidence levels.
This helps users evaluate forecast certainty and decide whether to follow system recommendations or adjust quantities.
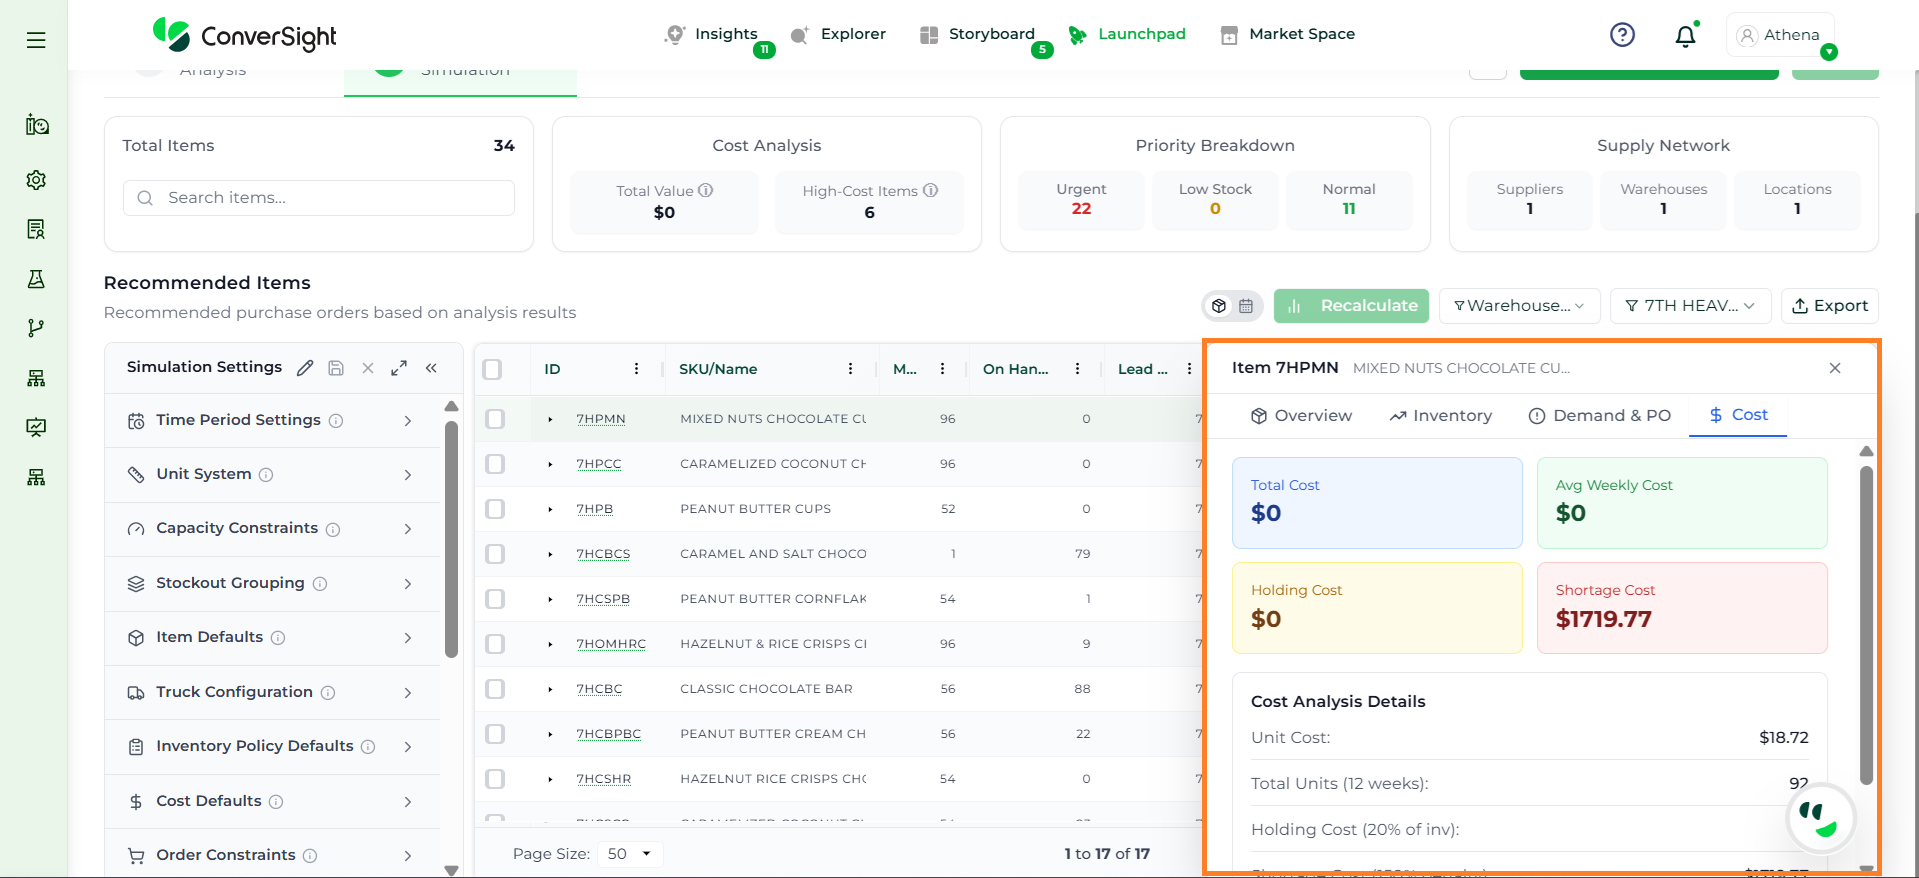
The Cost tab provides a financial perspective on inventory decisions. It includes metrics such as total cost, holding cost, shortage cost, average weekly cost, and unit cost breakdown.
This helps users understand trade-offs between holding inventory and risking stockouts, enabling more balanced and cost-effective decisions.
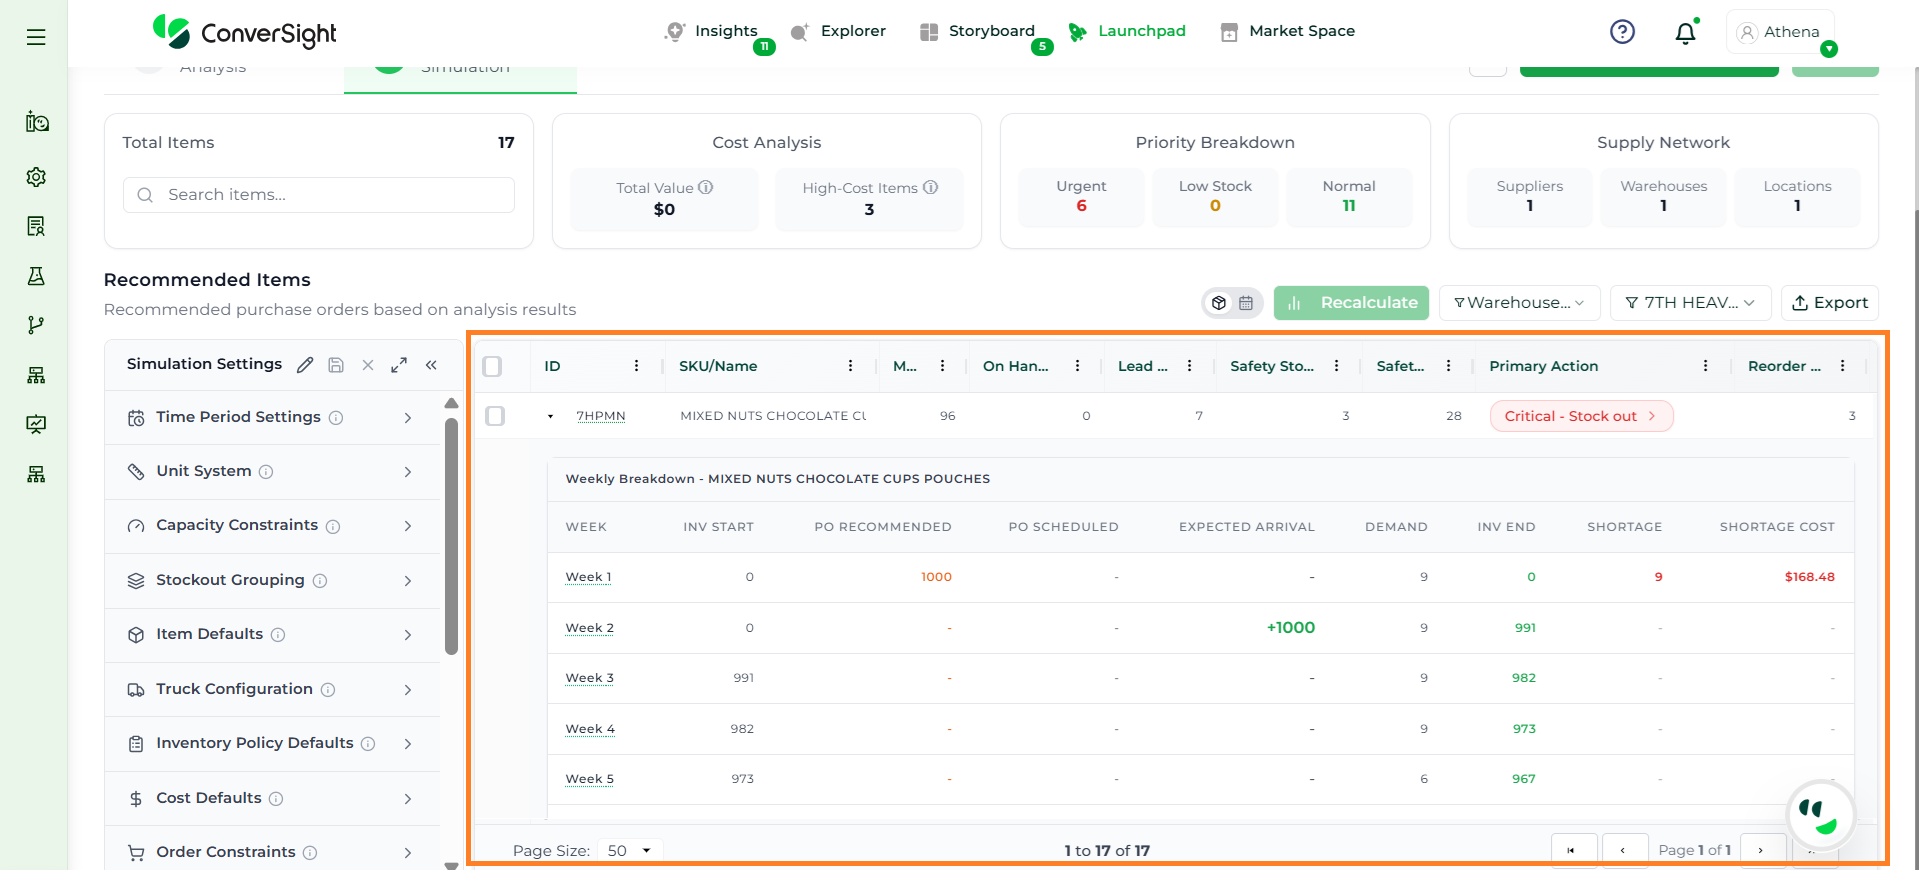
Users can further explore item-level behavior over time directly from the recommendation grid. By selecting a row and clicking on the Arrow icon, the system opens a detailed Weekly Breakdown View.
After selecting an item from the recommendation grid, the system displays a Weekly Breakdown View. This view shows a time-based simulation of how inventory, demand, and supply decisions evolve across each planning period.
Instead of only showing a final recommendation, this view helps users understand how the recommendation is derived and why shortages or excess inventory occur.
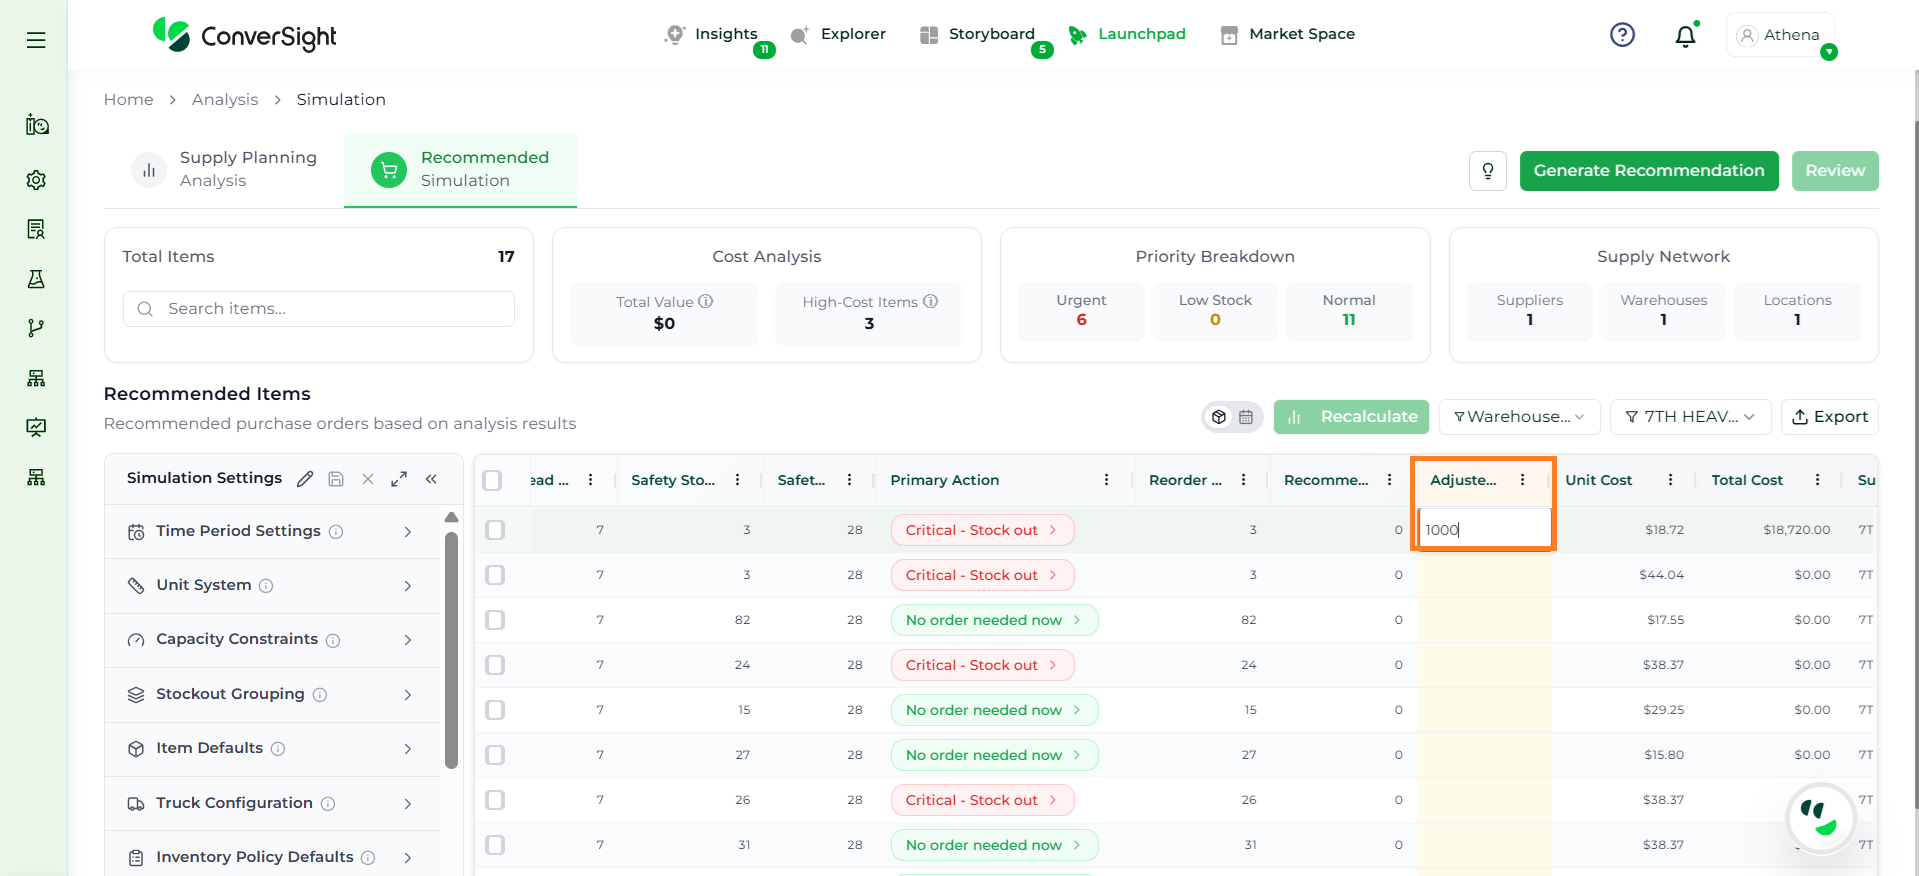
Users can directly modify the Adjusted Quantity field in the recommendation grid to override the suggested values. This flexibility enables planners to incorporate external factors such as supplier constraints, promotional activities, budget limits, or operational priorities that may not be fully captured by the system.
Each modification is tracked within the simulation, ensuring that all user inputs are considered in subsequent calculations. This allows planners to combine AI recommendations with business expertise to create more practical and executable plans.
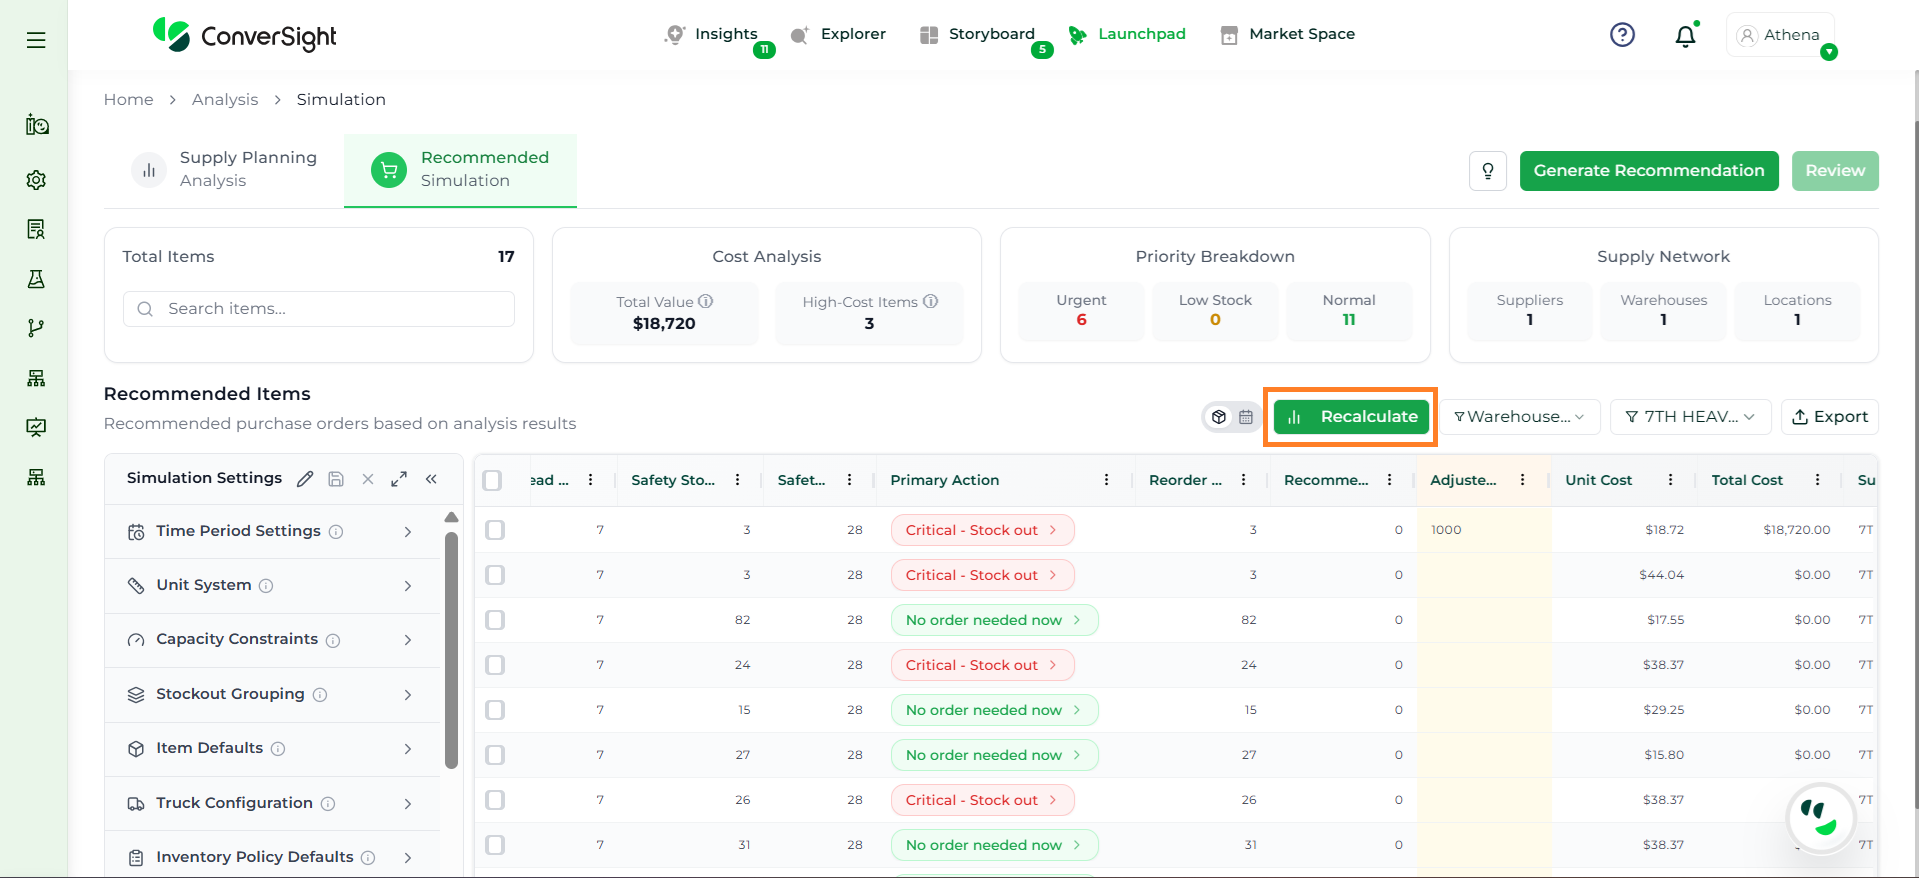
Once recalculation is completed, the Weekly Breakdown view is automatically updated to reflect the latest planning outcomes. This updated view provides a time-phased representation of inventory movement, including revised inventory start and end levels, updated purchase order recommendations, expected arrivals, and any resulting shortages. It ensures that all manual changes are accurately incorporated into the simulation and clearly visible across each planning period.
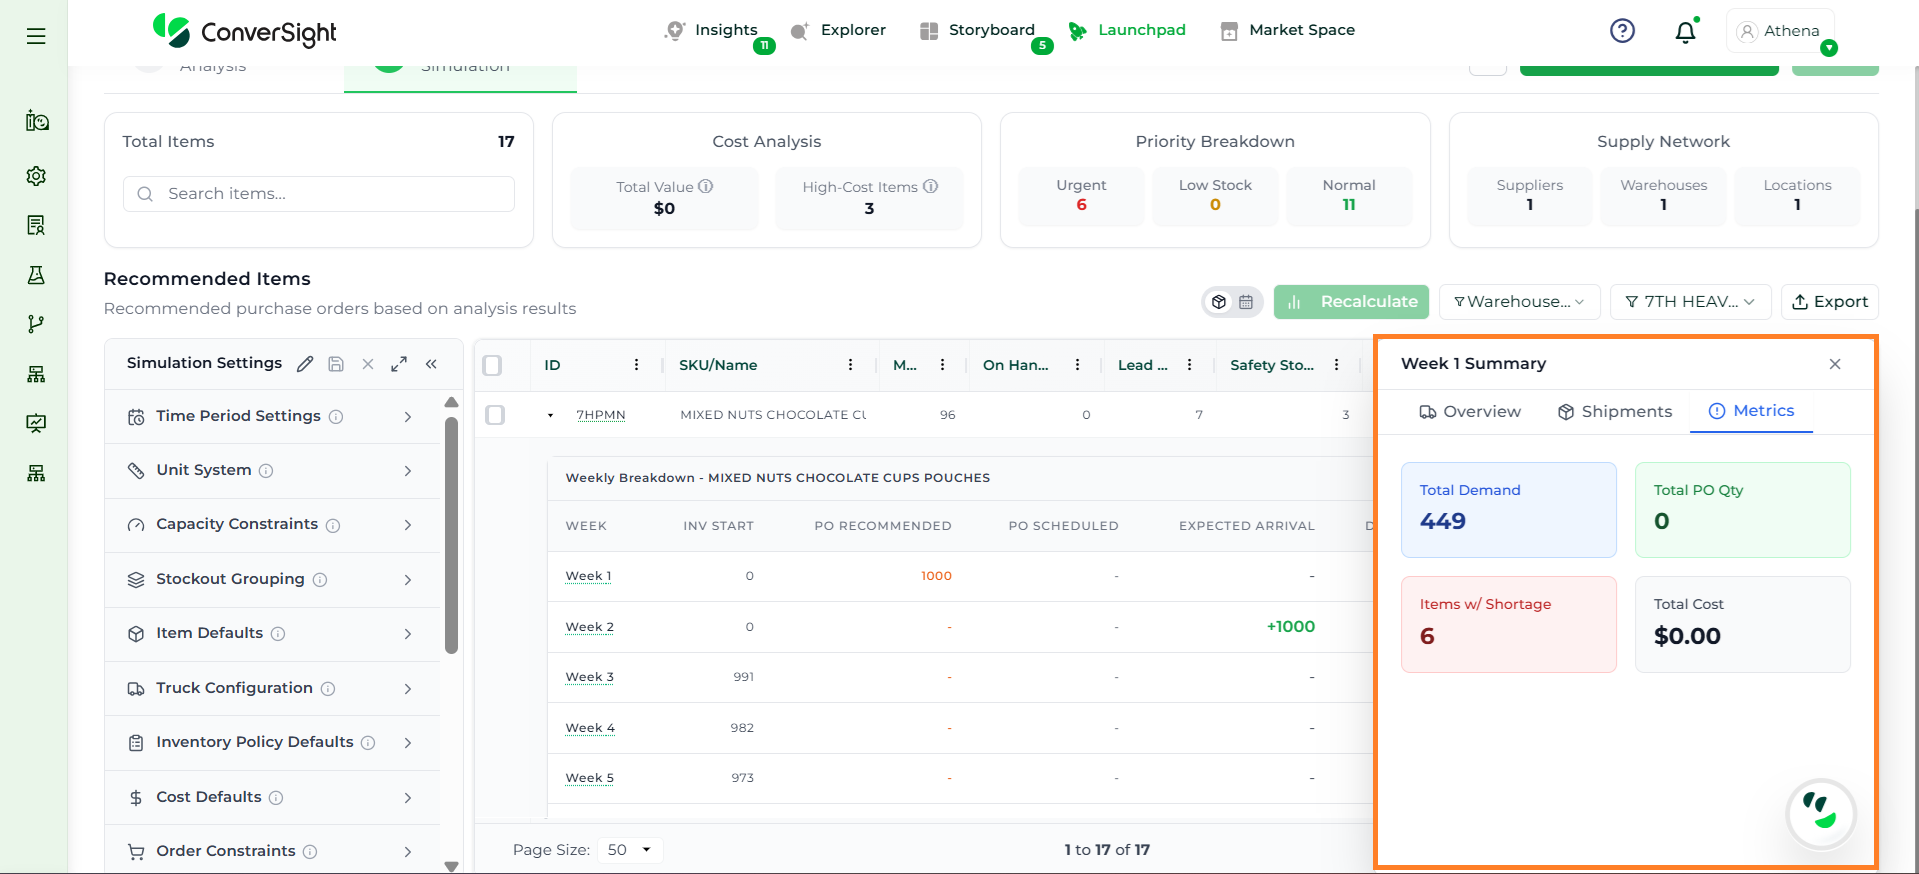
Upon selecting an item, the side panel opens, displaying the updated comprehensive analysis for the selected item. This panel provides deeper visibility into inventory behavior, demand patterns, and cost implications, enabling informed decision-making.
The panel consists of the following sections:
Section
Description
Overview
Provides a quick summary of key item parameters such as current inventory, reorder point, safety stock, lead time, supplier, and unit cost.
Inventory (Projection View)
Displays a time-phased visual representation of inventory levels, demand, safety stock, and order flows across the planning horizon. Users can also save the image, change the data view, and refresh the data.
Demand & PO
Shows demand forecasts along with confidence levels, helping users assess demand reliability and plan orders accordingly.
Cost
Highlights financial metrics such as total cost, holding cost, shortage cost, and average weekly cost to support cost-optimized decisions.
The Recommended Simulation page is designed to provide both a high-level and detailed view of supply planning decisions. It is structured into multiple sections that help users analyze recommendations, understand time-based behavior, and take action efficiently.
Item-Level View: The Item-Level View presents all recommendations in a structured grid format, where each row represents a unique item (SKU).
Week-Level View (Weekly Breakdown): The Week-Level View provides a time-phased simulation of how inventory, demand, and supply evolve across each planning period.
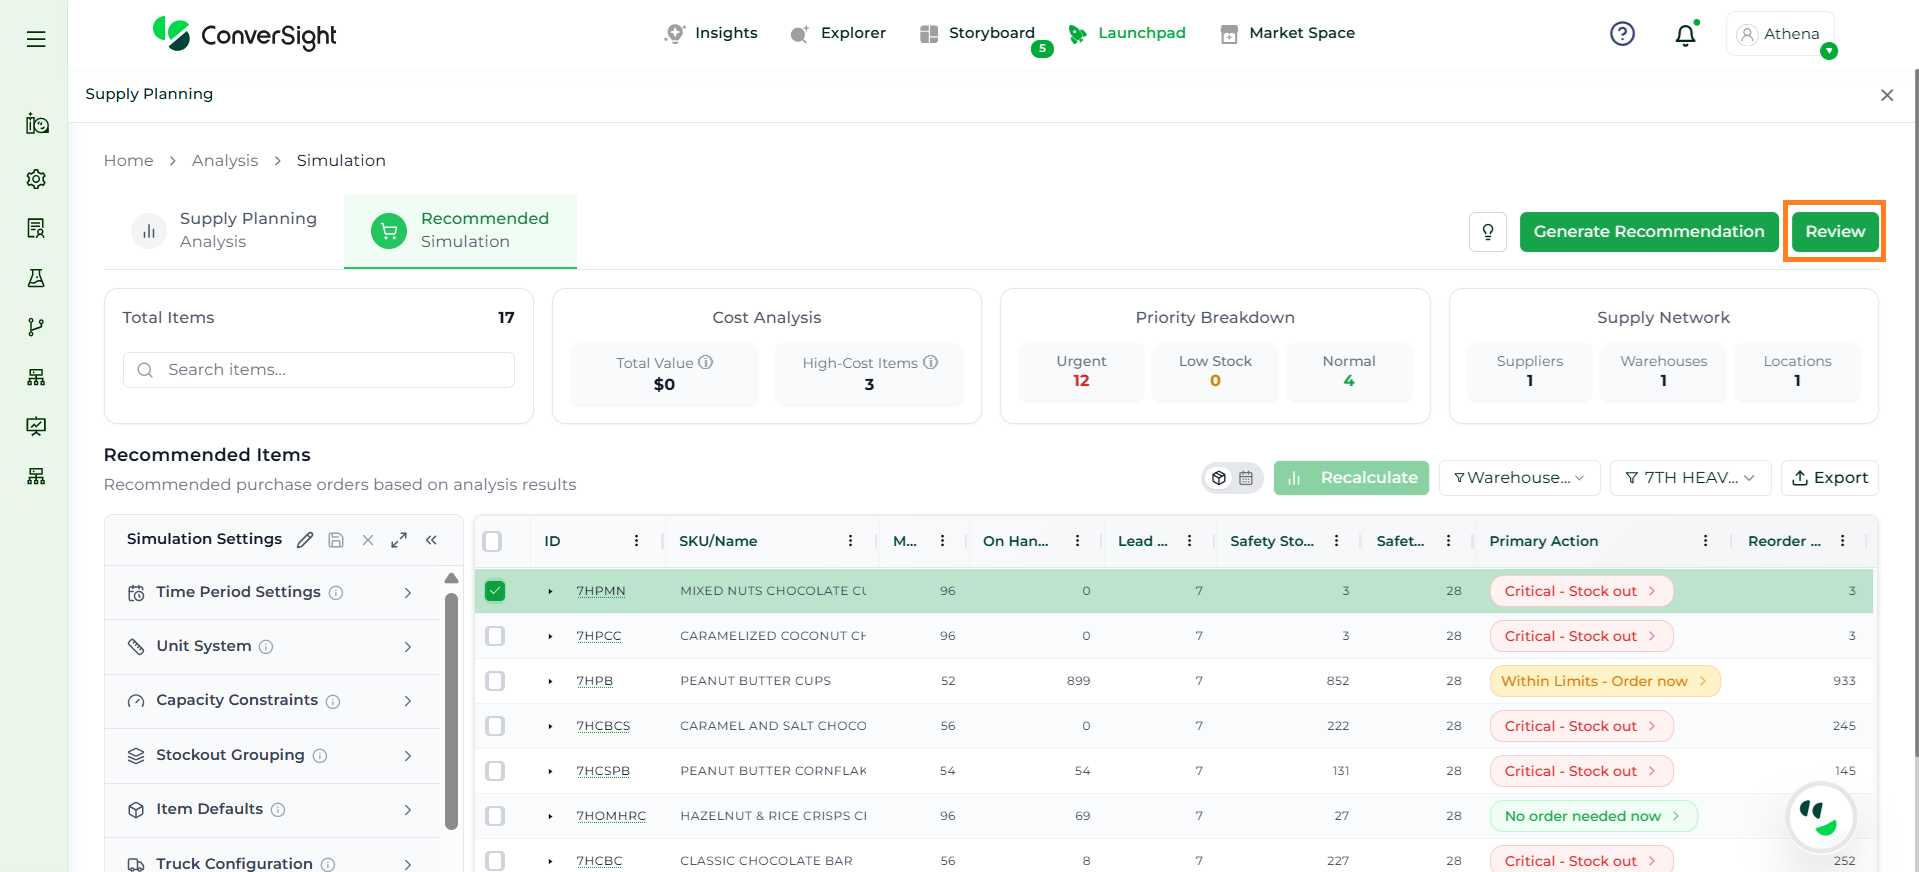
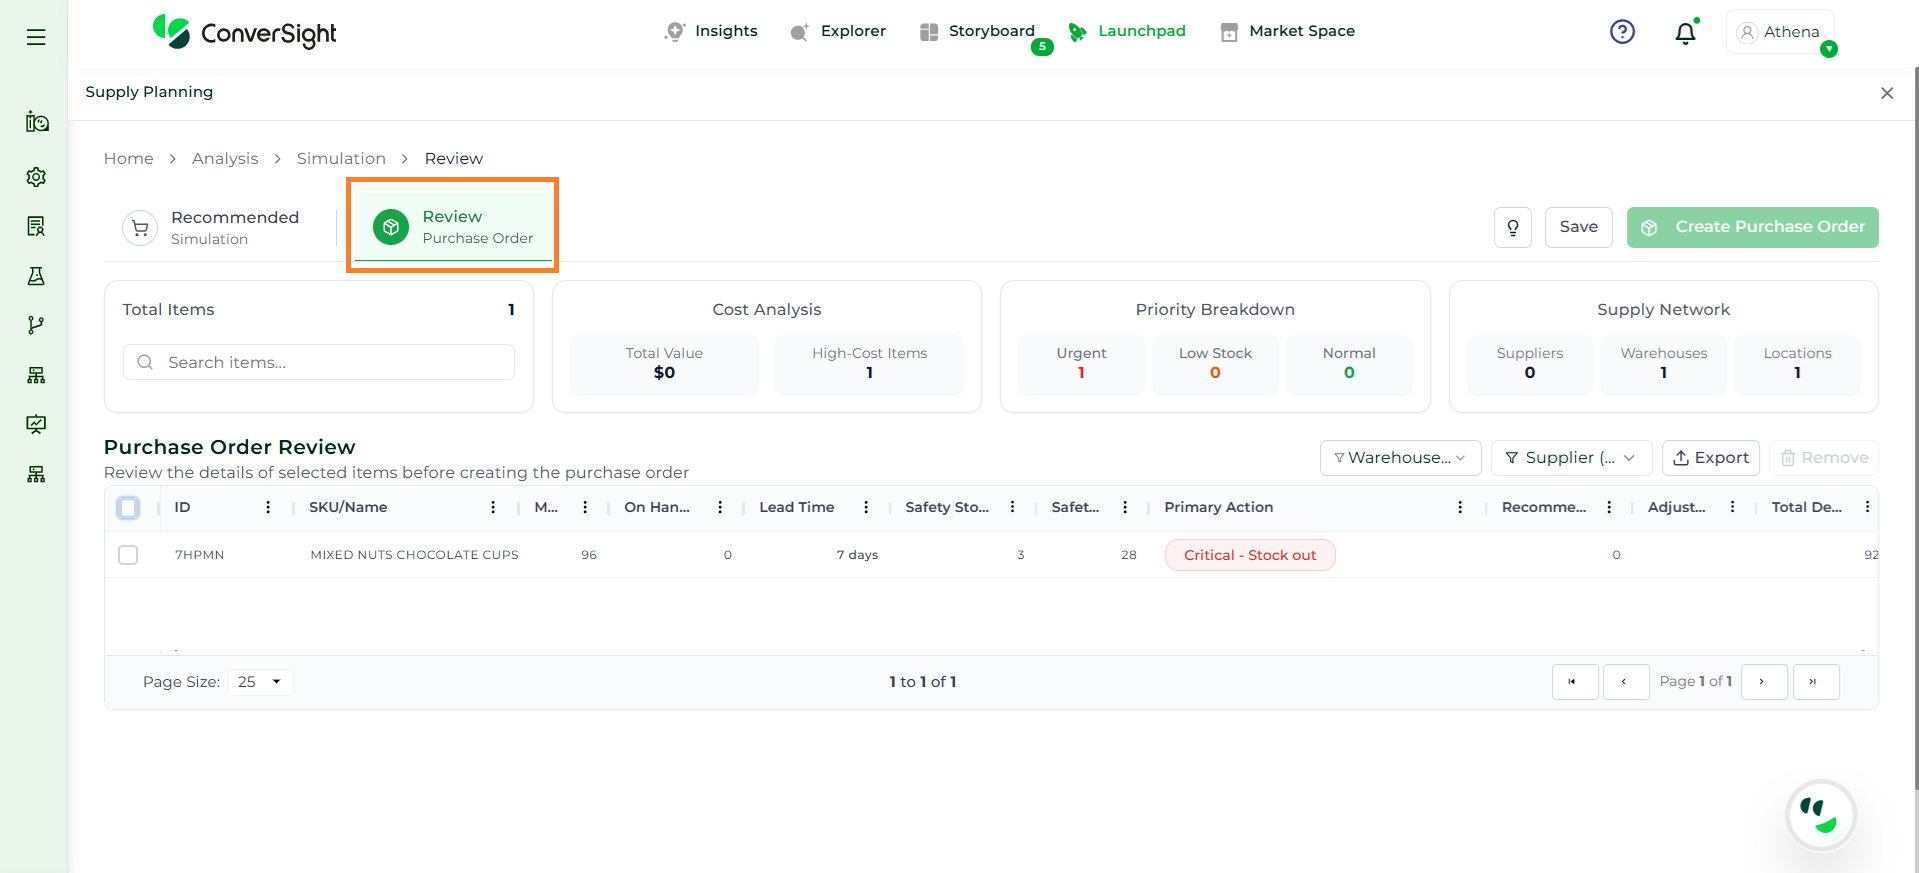
After adjusting the recommended quantities and clicking Recalculate, users can select the required items and proceed by clicking on the Review button. This opens the Review Purchase Order page, where all finalized recommendations are consolidated for validation and execution.
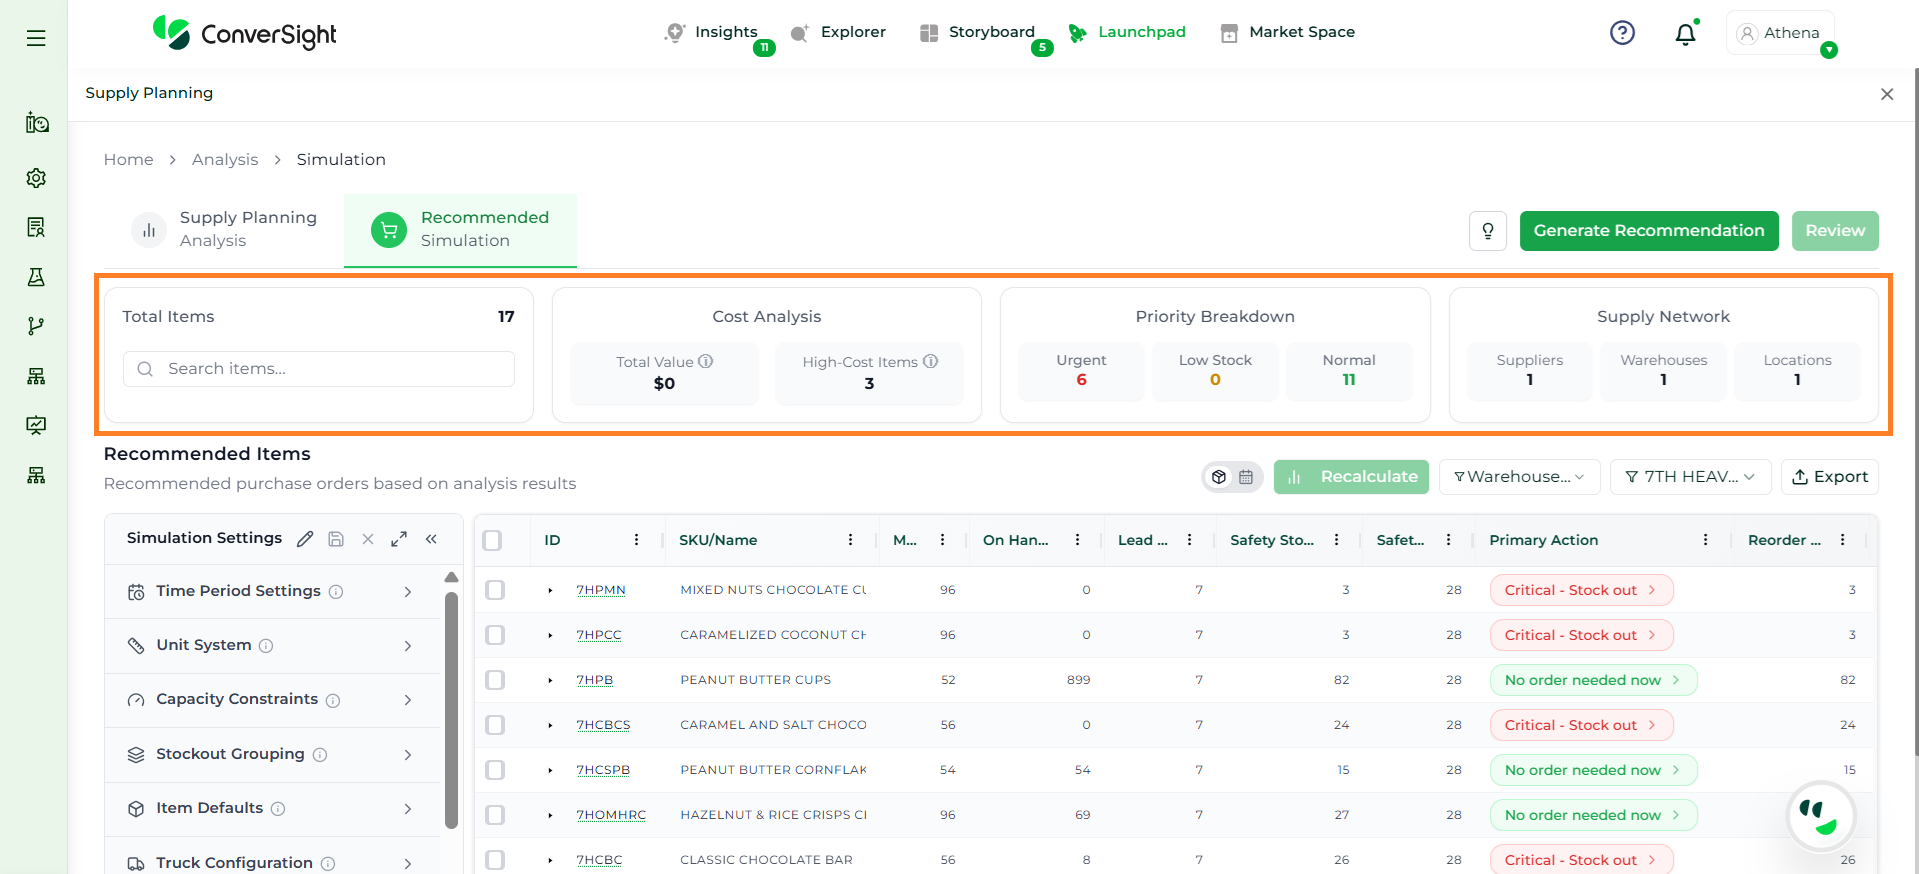
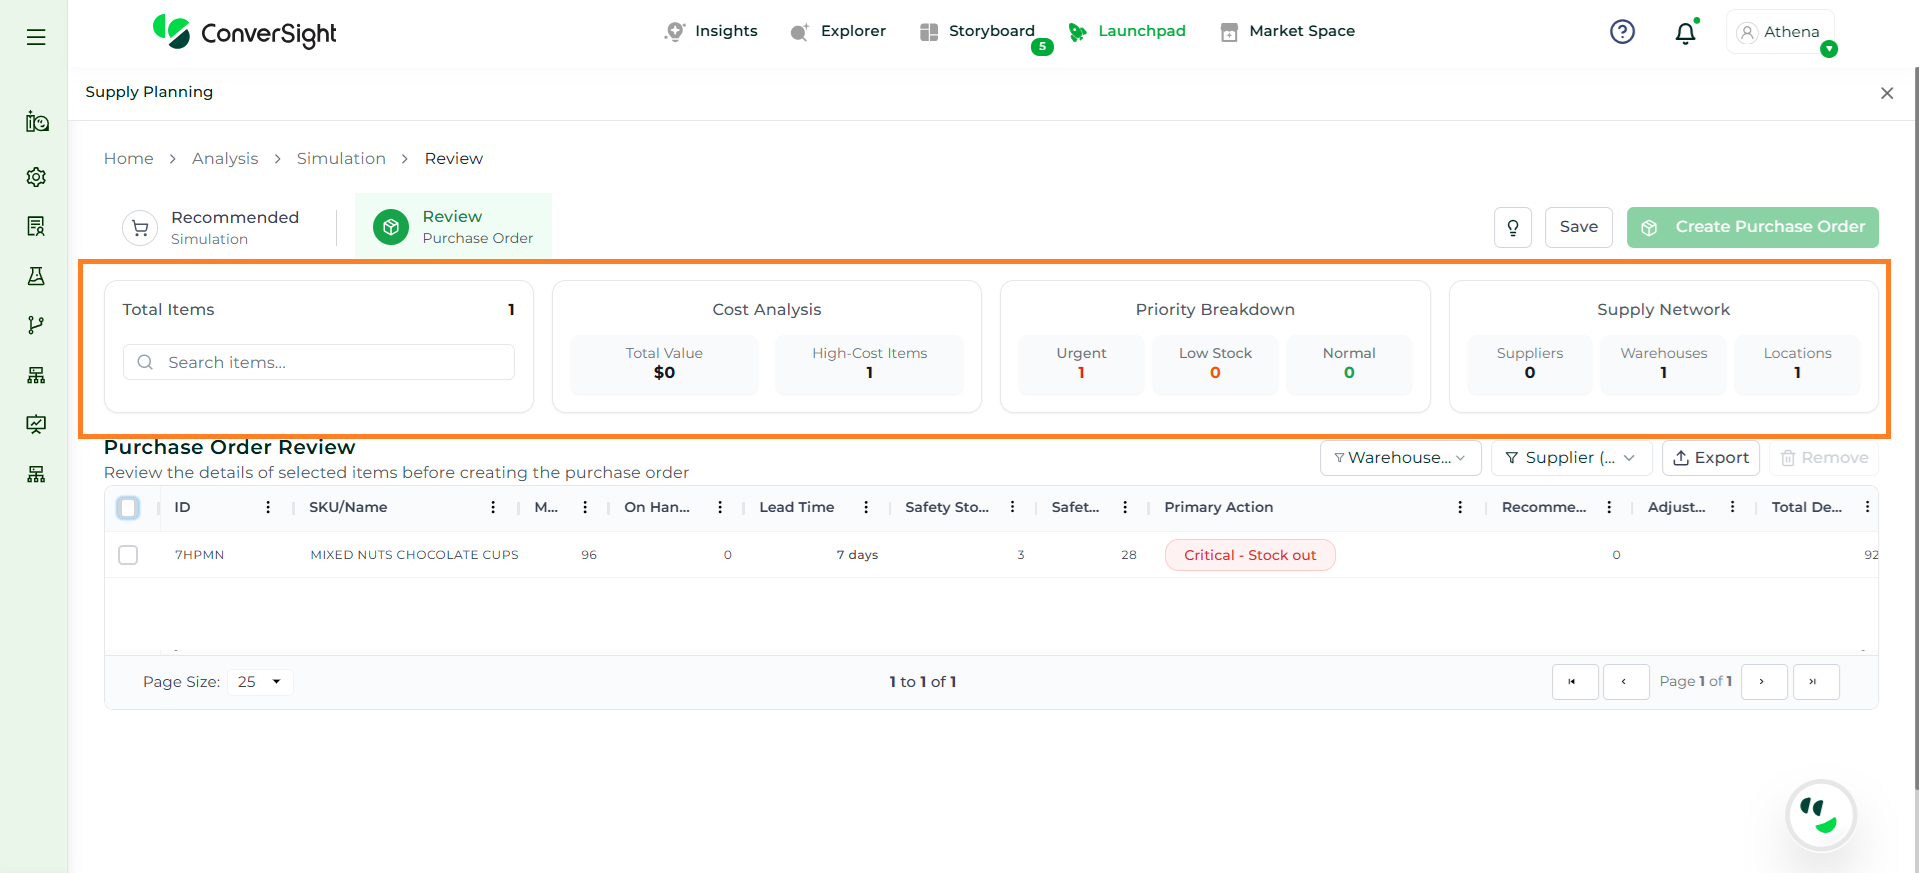
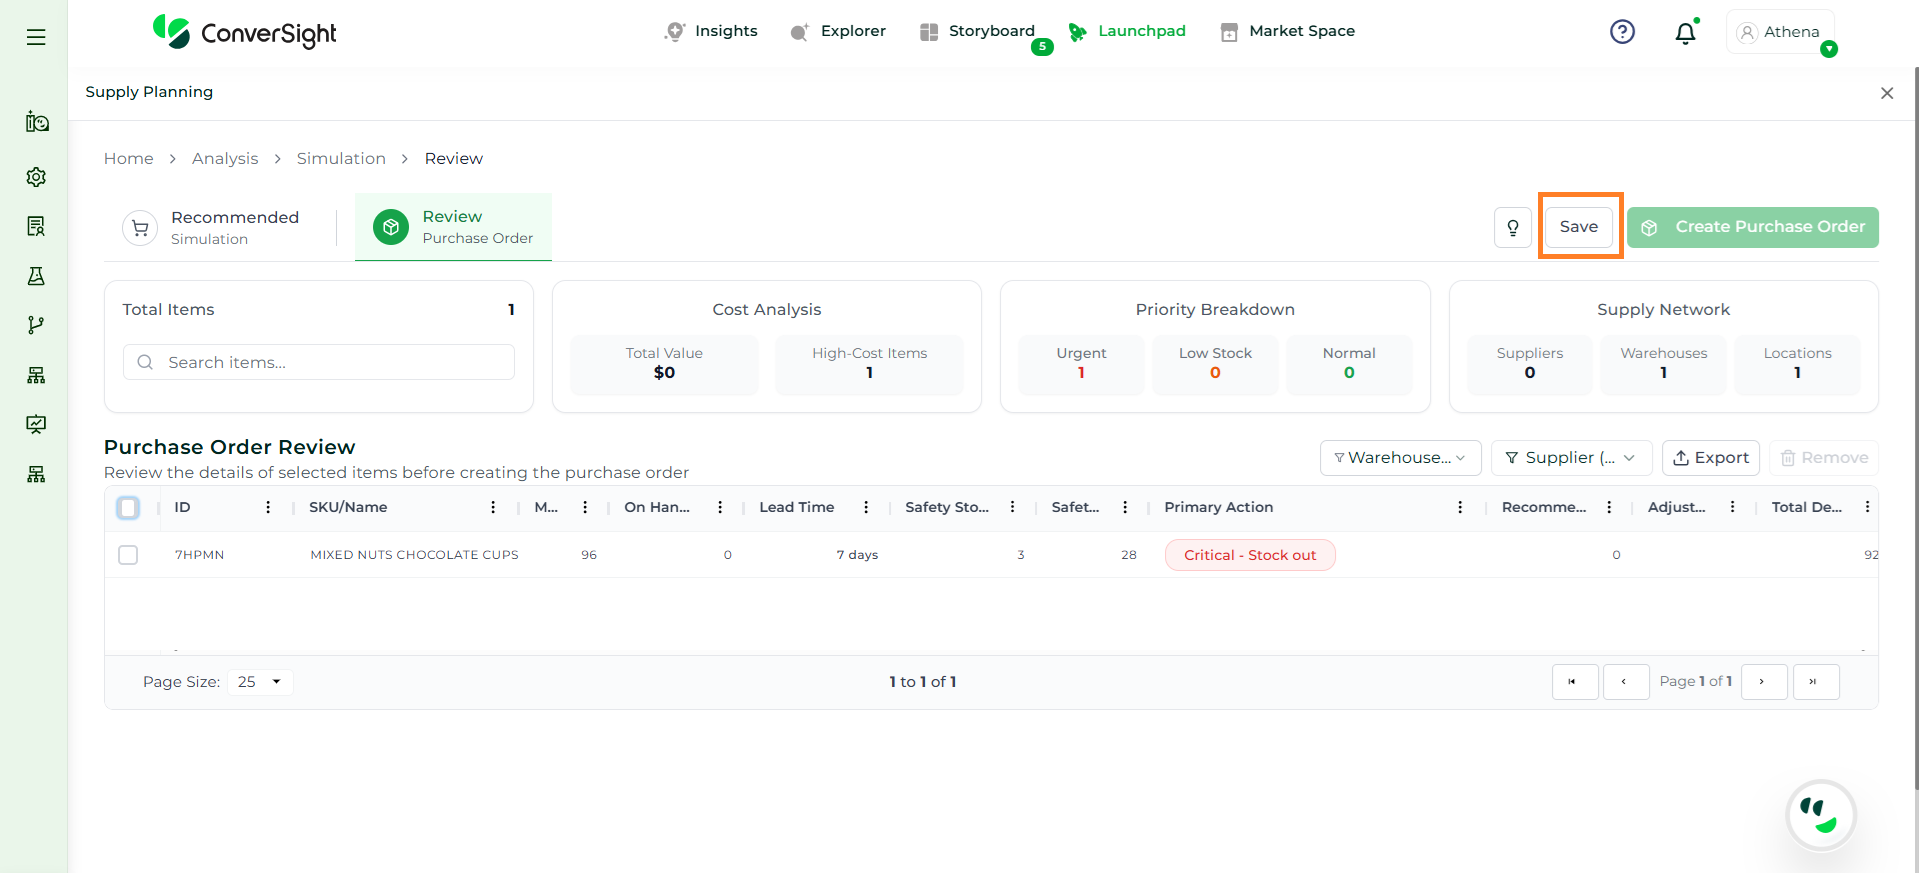
The top section of the Review Purchase Order page provides a high-level summary of the plan. It helps users quickly understand the scope, cost impact, priority distribution, and supply network coverage before finalizing purchase orders.
Section
Description
Total Items
Displays the total number of items selected for purchase order creation. It reflects the final set of SKUs carried forward from the simulation after adjustments and review.
Cost Analysis
Provides a financial overview of the plan, including total inventory value and identification of high-cost items.
Priority Breakdown
Categorizes items based on urgency, such as Urgent, Low Stock, and Normal.
Supply Network
Shows the number of suppliers, warehouses, and locations involved in the selected plan.
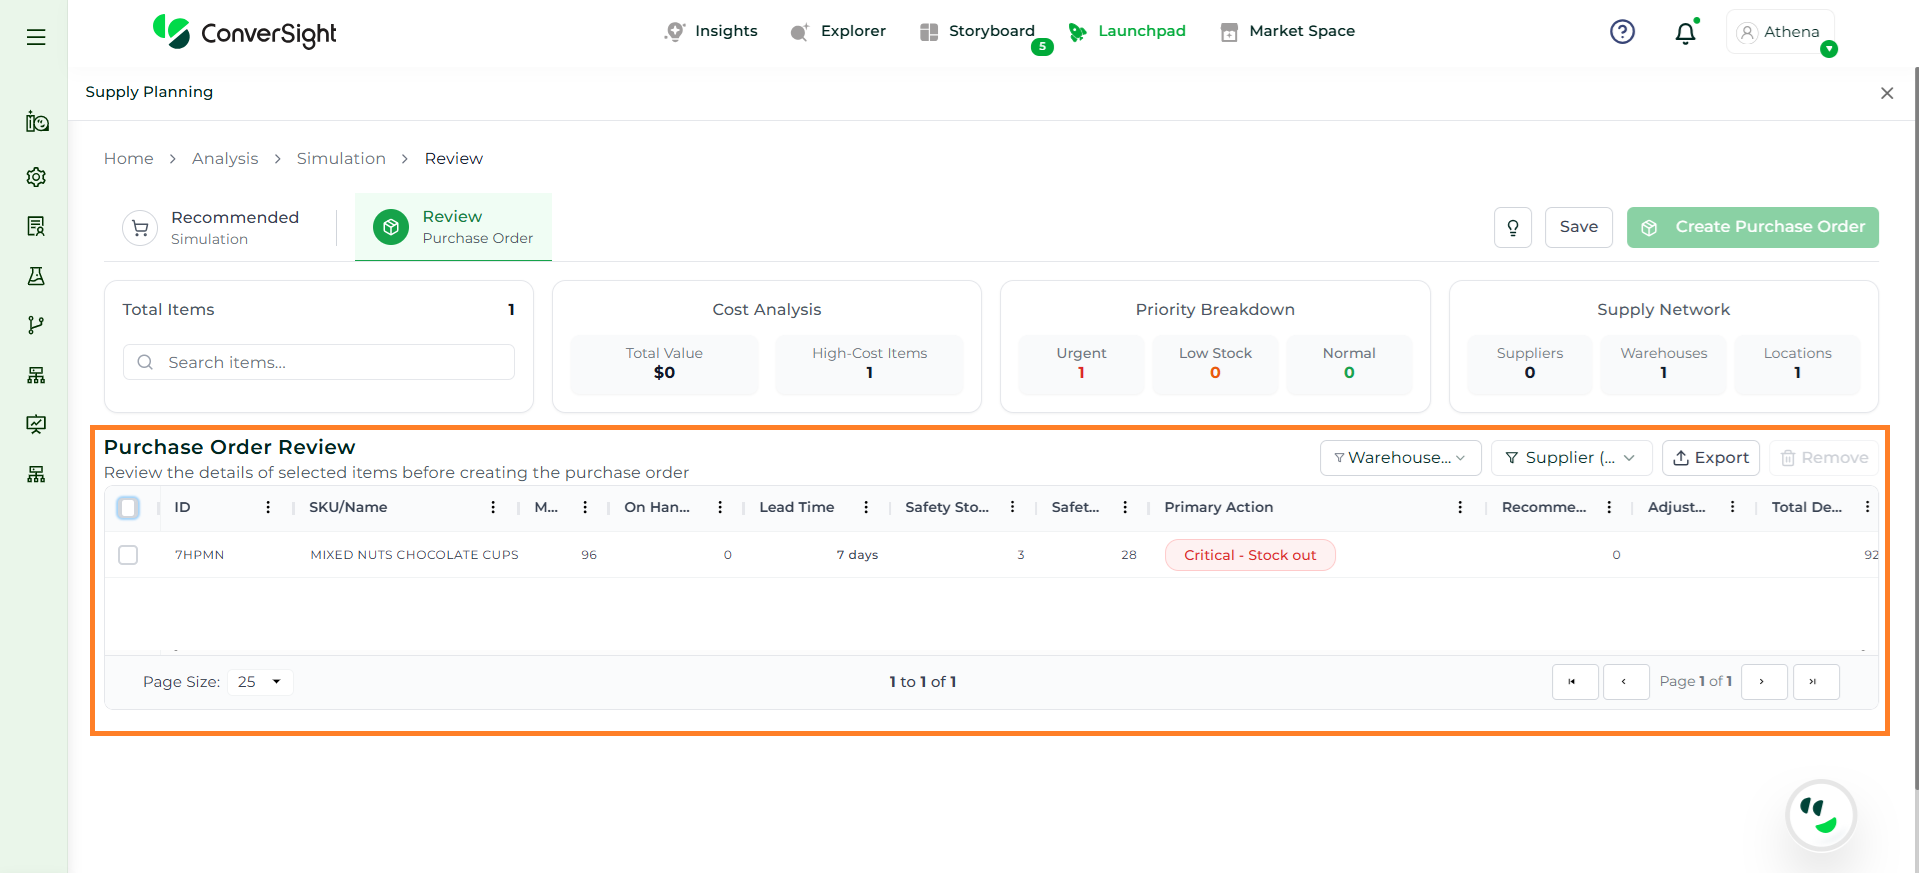
The Purchase Order Review section displays all selected items that are ready for order creation. It provides a detailed, item-level view of final recommendations, allowing users to validate quantities, review planning parameters, and ensure accuracy before generating purchase orders.
Each row represents a unique item and includes key details required for decision-making and execution.
Column
Description
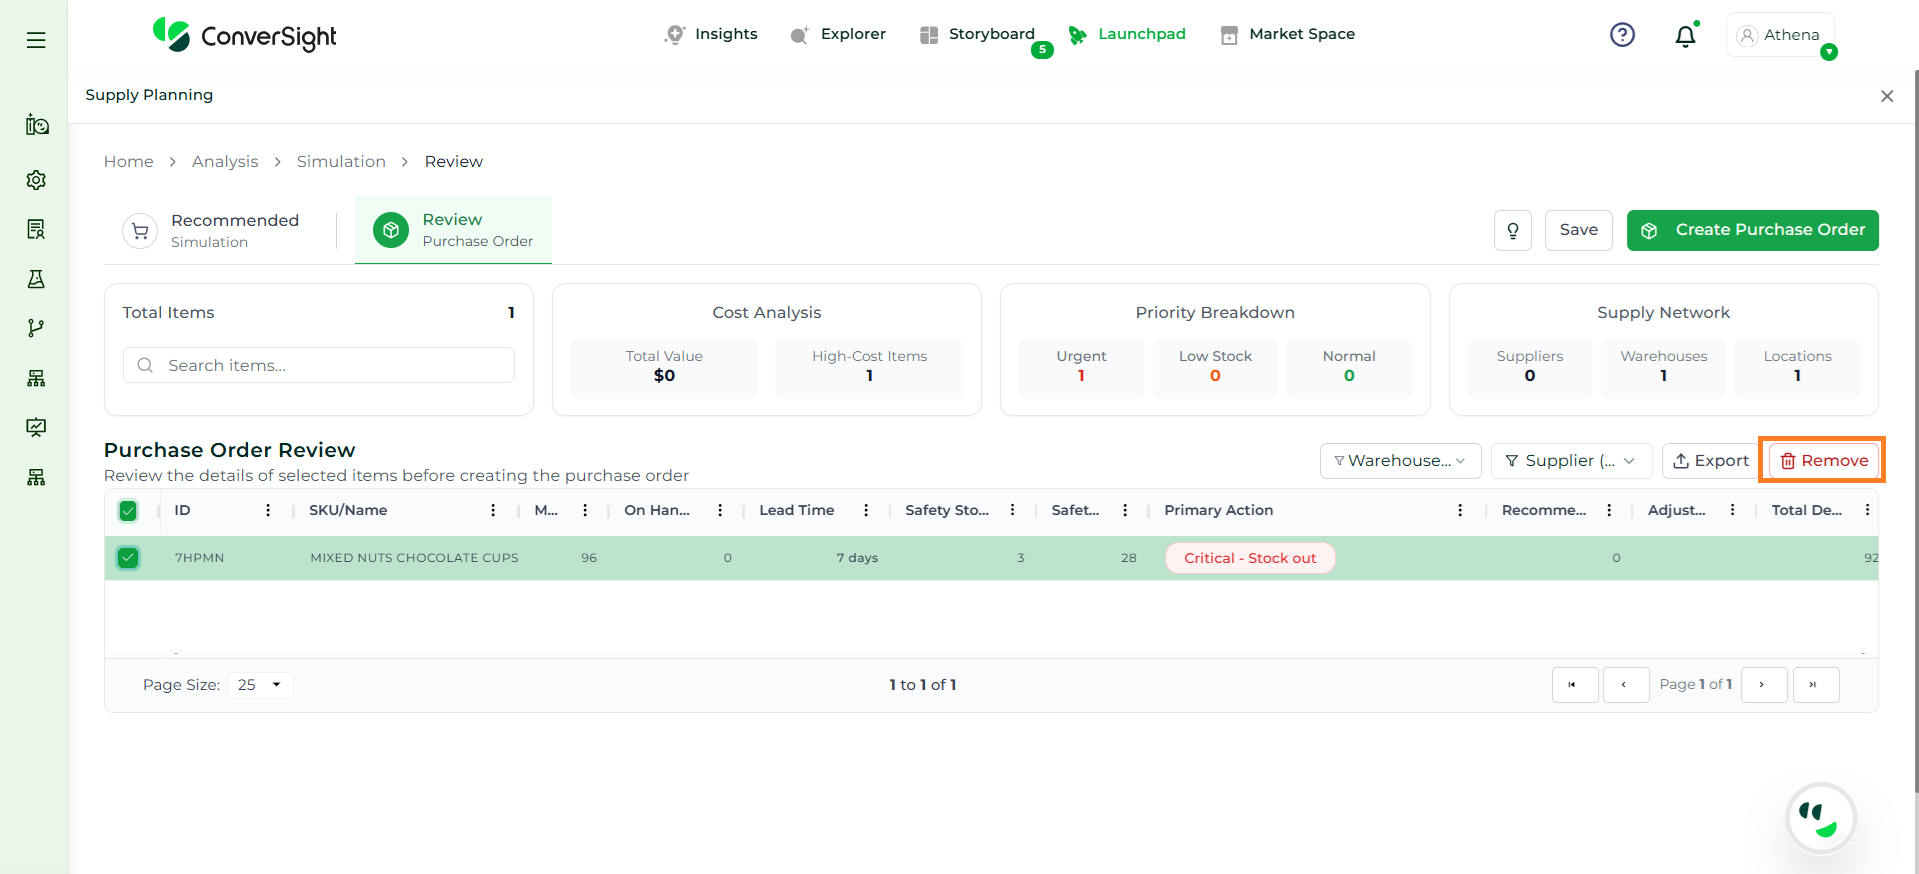
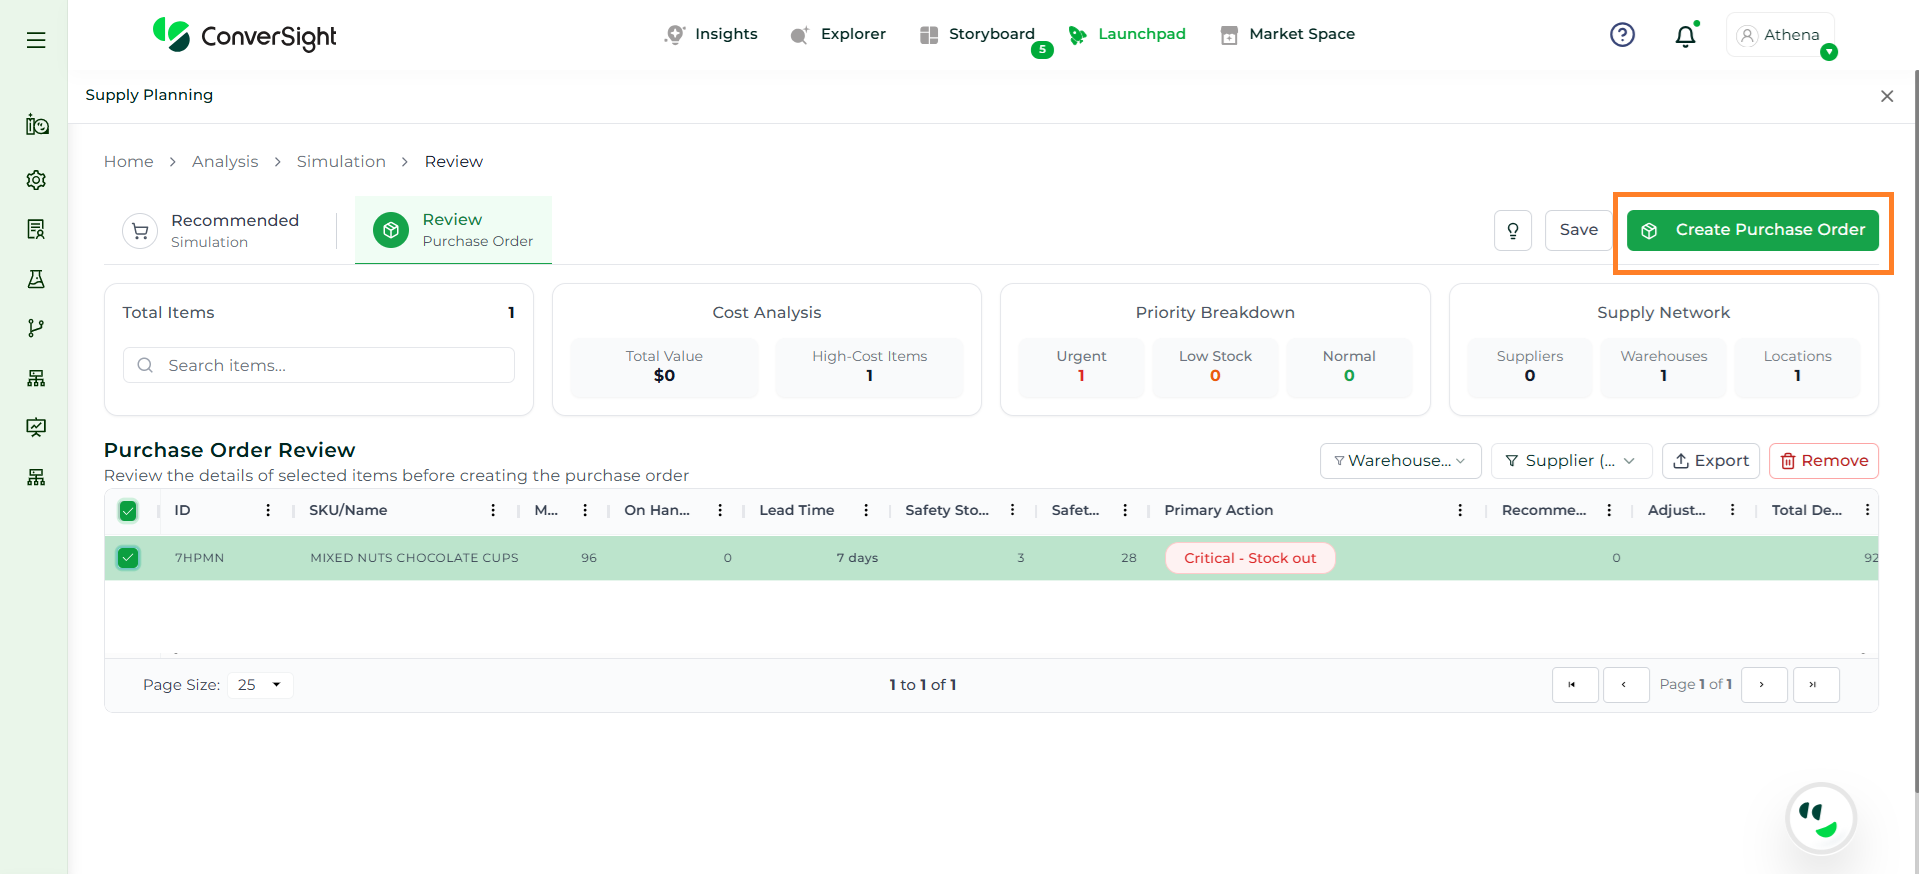
Select
Allows users to select or deselect items for purchase order creation.
After reviewing and selecting the required items, click on the Create Purchase Order button to generate purchase orders. This action converts finalized recommendations into actual purchase orders using the selected items and their adjusted quantities.
The Supply Planning application provides a structured and unified approach to managing supply chain decisions by connecting analysis, simulation, and execution within a single workflow. By combining demand signals, inventory data, and operational constraints, it enables users to move from understanding current conditions to generating and finalizing accurate replenishment plans with confidence. Through its configurable settings, intelligent recommendations, and end to end visibility, the application ensures that planning is not only data driven but also aligned with business requirements. This enables organizations to maintain optimal inventory levels, reduce risks, and drive more efficient and consistent supply planning outcomes.