Demand Forecast#
ConverSight has transformed demand planning by simplifying the process for users, eliminating the need for extensive knowledge of forecasting algorithms. Users can easily participate in demand planning by simply selecting the desired time period and duration of historical data relevant to their forecasting needs.
This intuitive approach allows individuals at all expertise levels to focus on strategic decision-making rather than complex statistical methods. By streamlining input requirements, ConverSight fosters collaboration among teams, enabling easy sharing of selections and findings. This user-friendly interface not only saves time but also promotes data-driven decision-making, leading to more accurate forecasts and better alignment of inventory levels with market demand. Ultimately, ConverSight helps organizations remain competitive in an ever-evolving marketplace.
Accessing Demand Forecast#
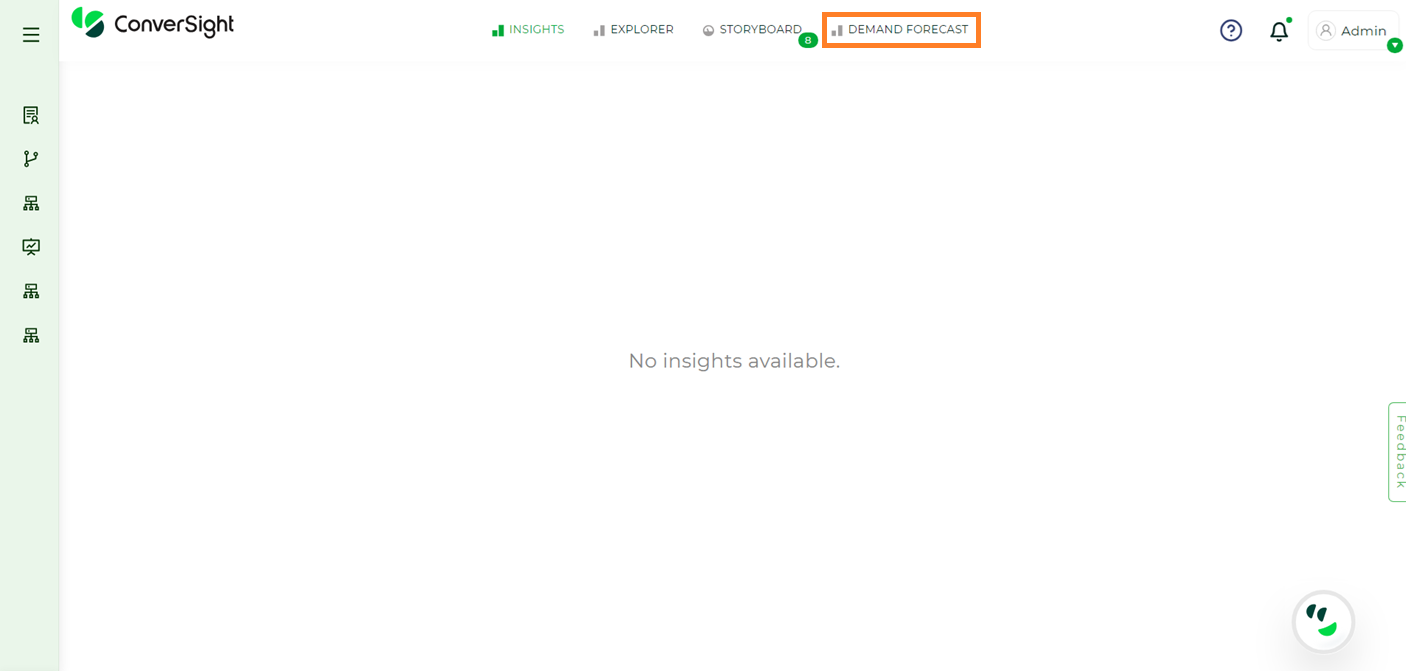
To access demand forecasting, click on the Demand Forecast tab in the landing page.
Demand Forecast#
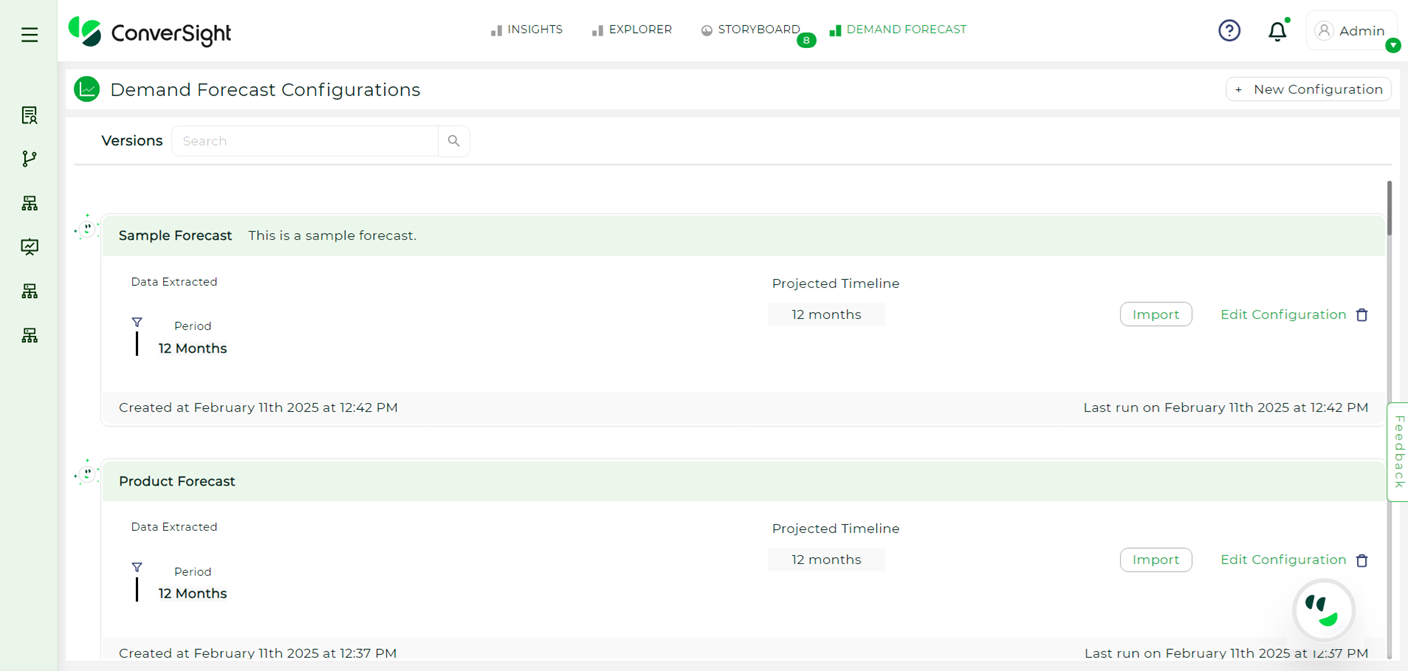
The created forecasts will be displayed in a list format. Each forecast configuration will include a unique Name and Description, providing clarity and context for users. This information will detail the columns included in the forecasting process and the projected timeline for each configuration.
Demand Forecast#
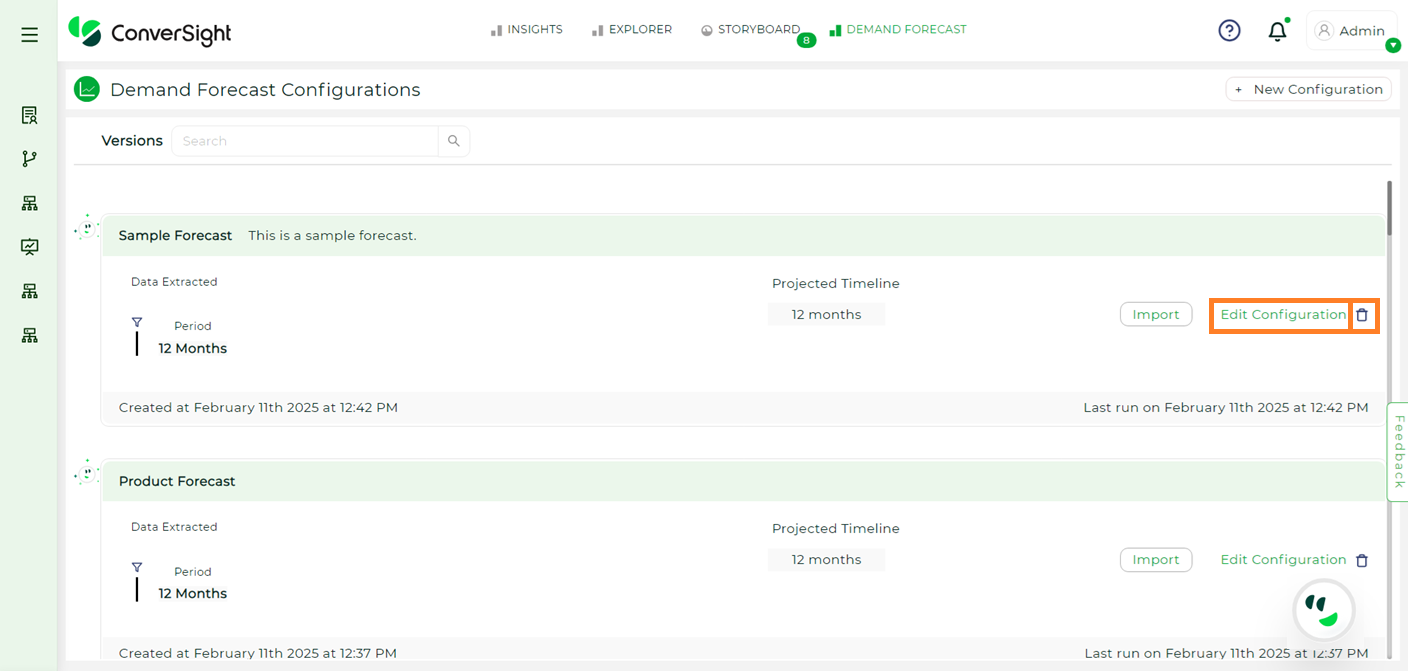
For quick access, users can regenerate forecasts by clicking Edit Configuration, selecting Adjust to make changes and then clicking Publish to generate the forecast.
Users can also edit configurations by selecting the Edit Configuration option or delete configurations by clicking on the Trash icon.
Demand Forecast#
NOTE
When a user runs a forecast, other forecast configurations will be temporarily blocked.
New Configuration#
The following steps will guide users through the demand forecasting configuration process, helping them understand how to set up and utilize the forecasting tools effectively.
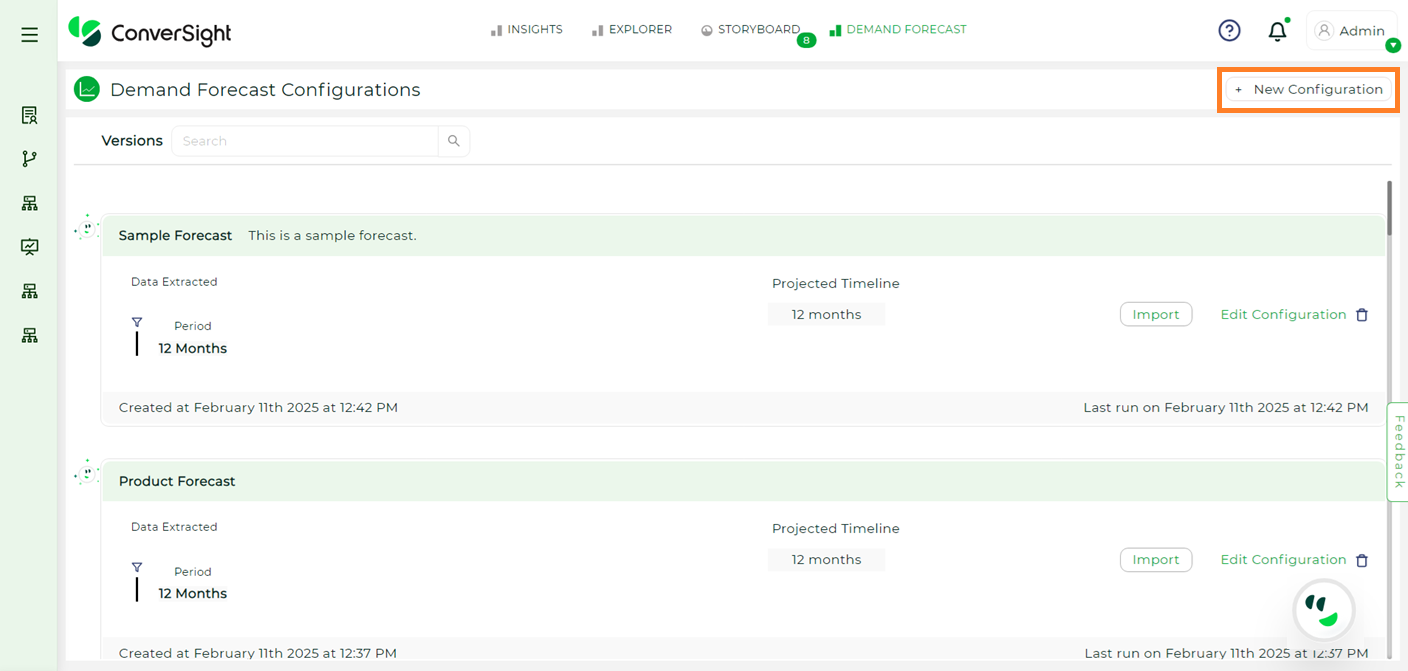
Click on + New Configuration on the right-side corner of the Demand Forecasting Configurations page.
New Configuration#
In the configuration process, users must complete the following steps.
Configuration: In this step, users need to select the columns for which they intend to forecast and run the query by clicking on the Run Button on the right-side.
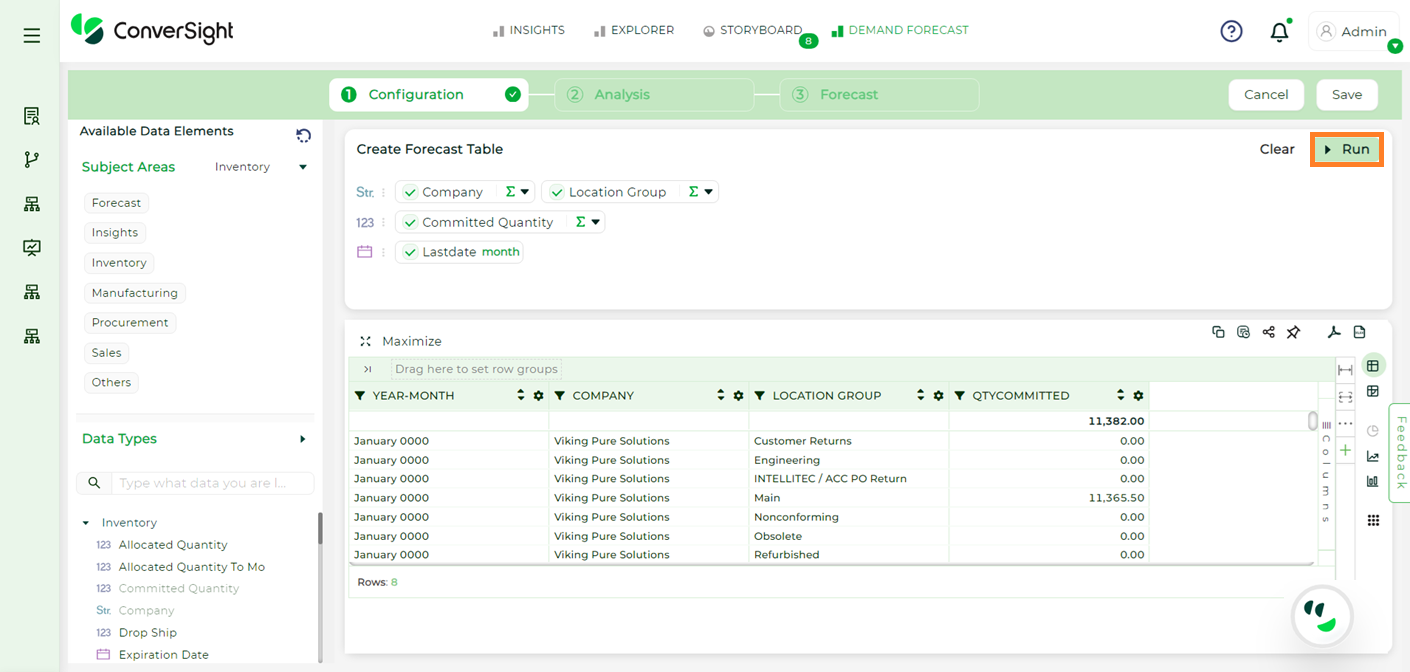
Query Generation#
Once the query has been executed, this step will be completed then click Save.
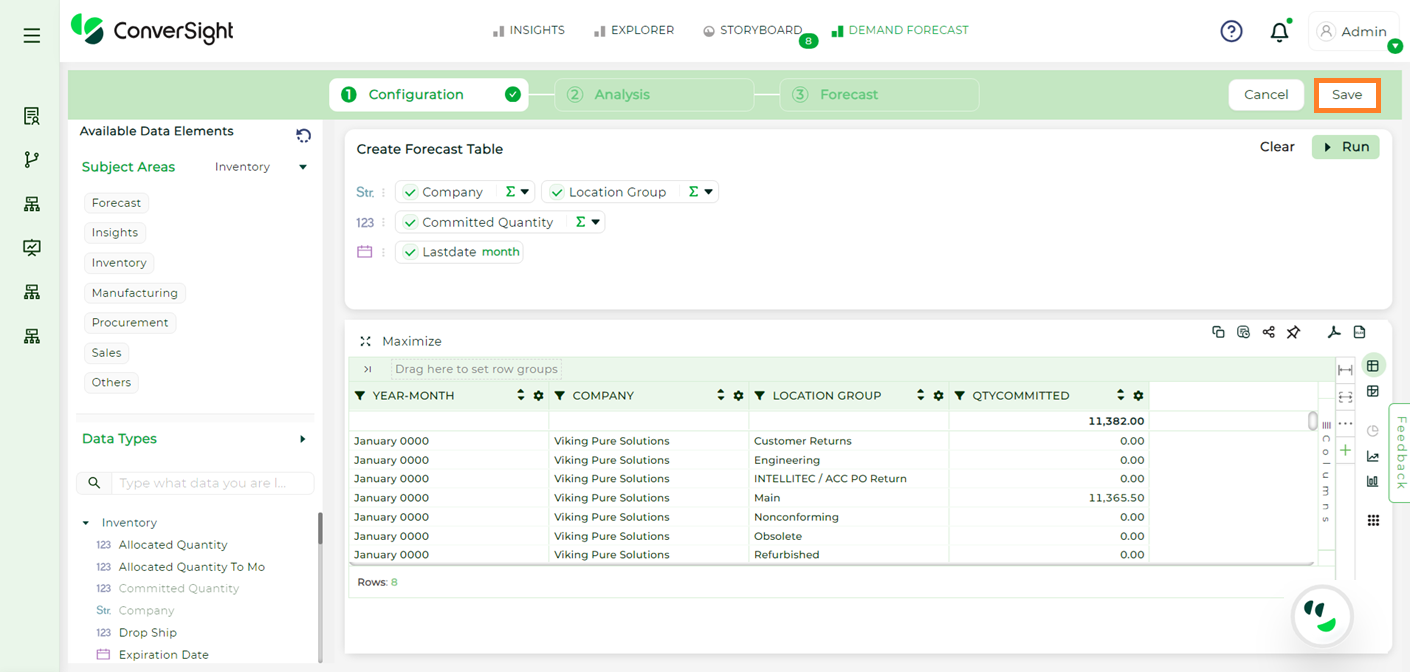
Saving the Query#
Enter a name and description for the newly created forecast, then click Save and Continue.
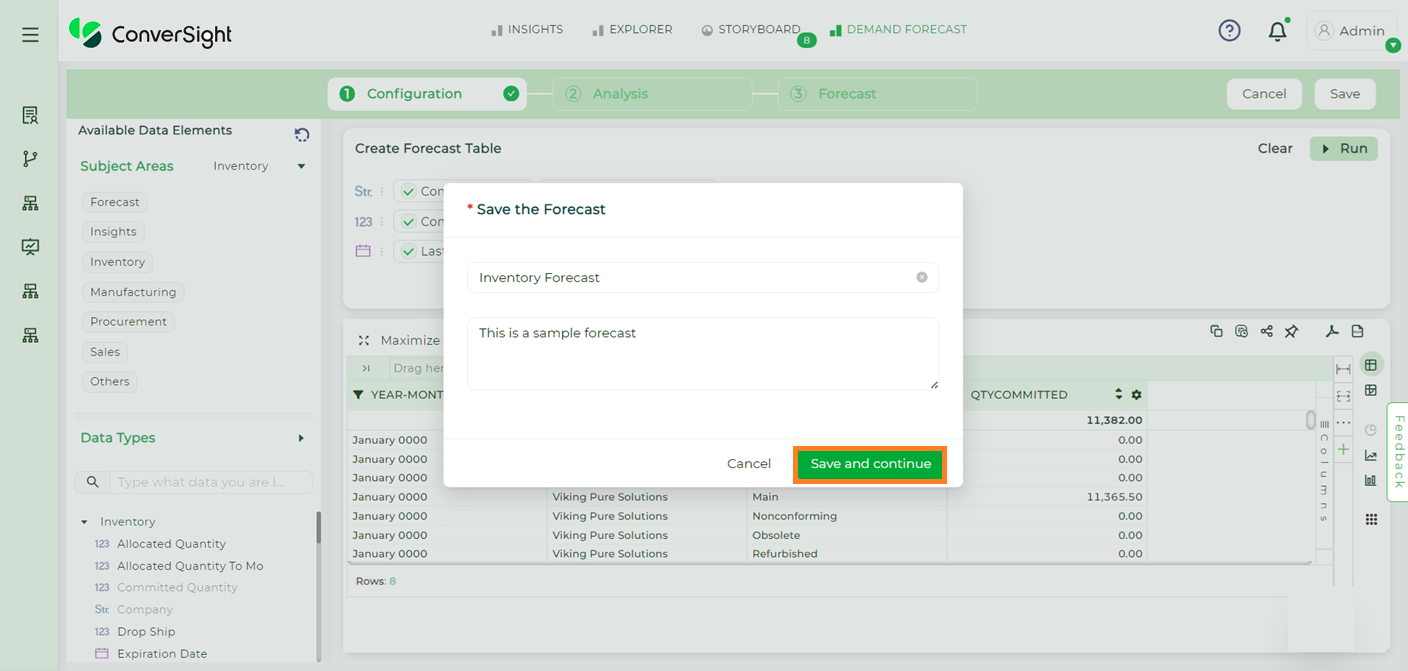
Saving Configuration#
To proceed to the next phase, click on the Next button on the right top corner.
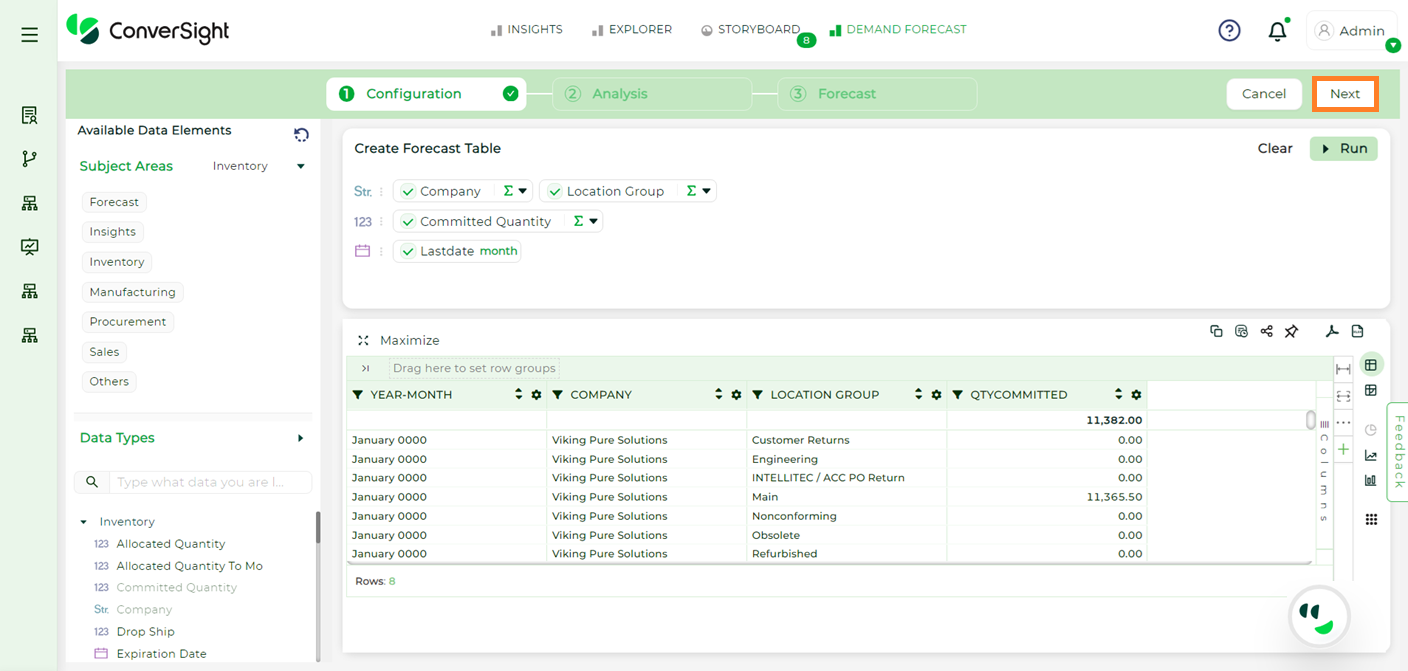
New Configuration#
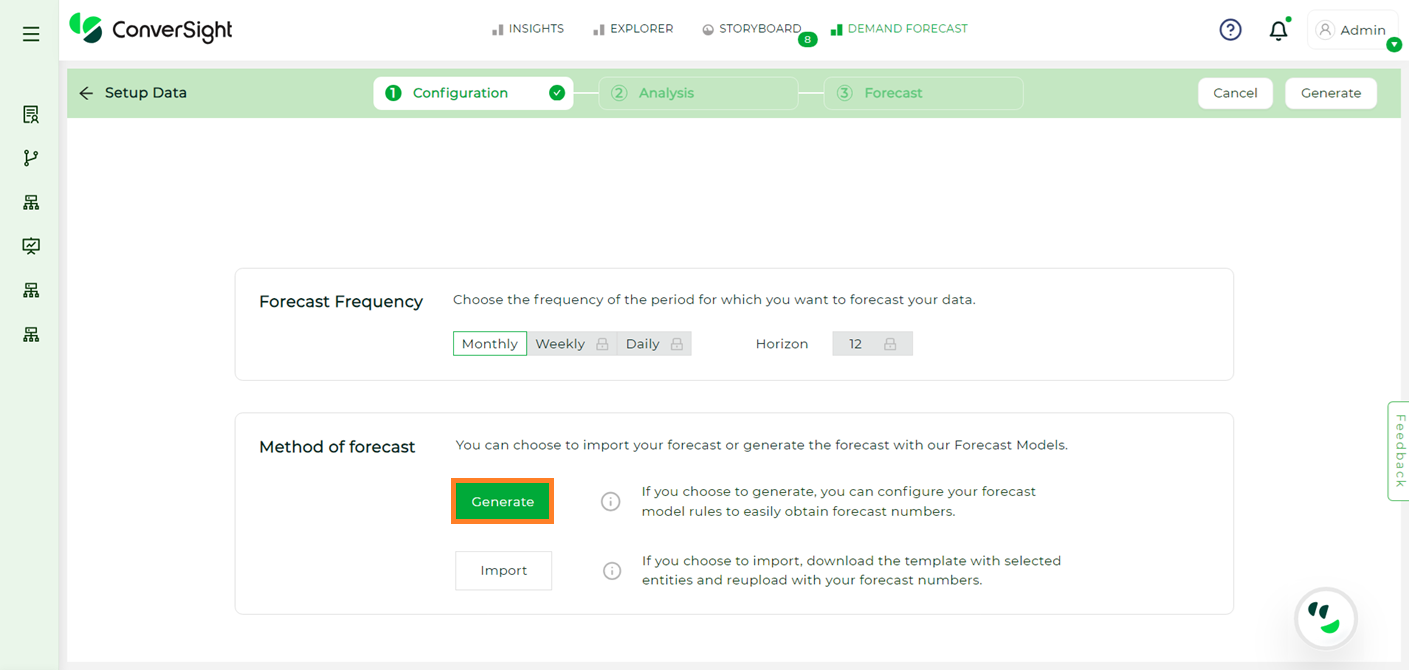
Generate Flow: The Generate option in the forecast feature enables users to create forecast values using the Conversight forecasting models. Below are the steps to generate forecast values using the Generate option:
Step 1: Click on the Generate option.
Generate#
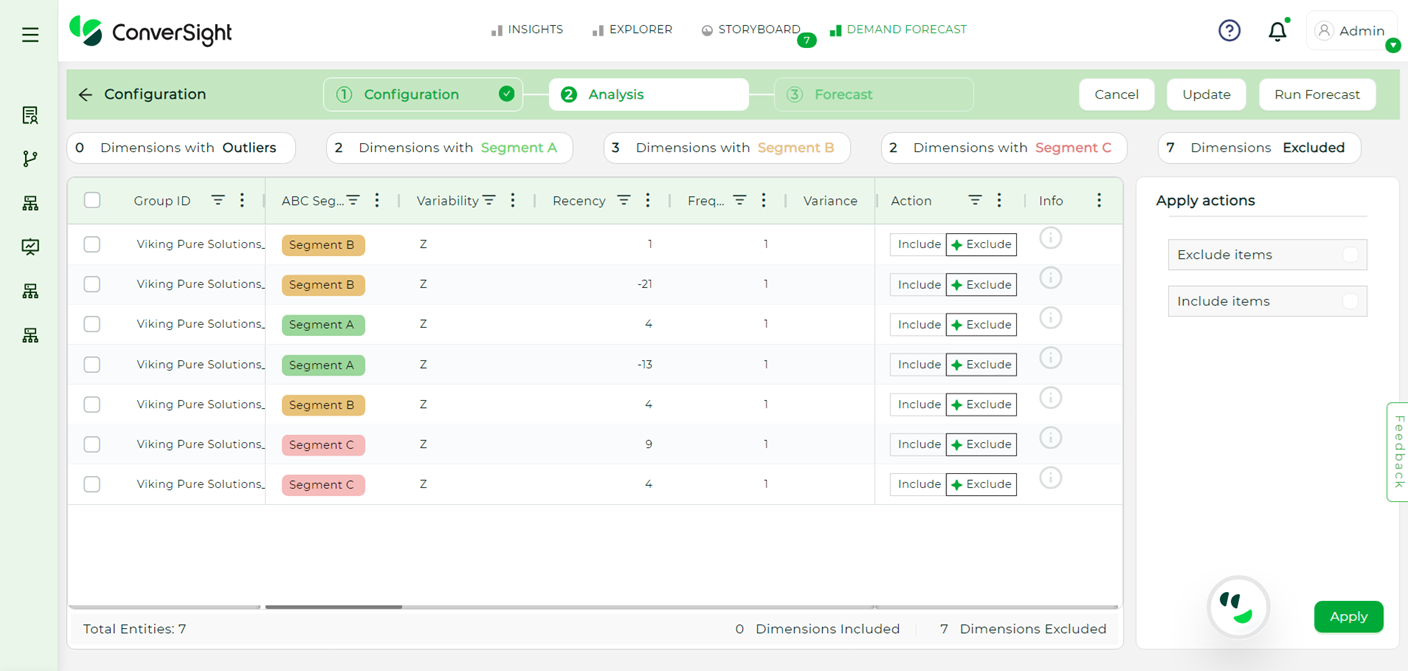
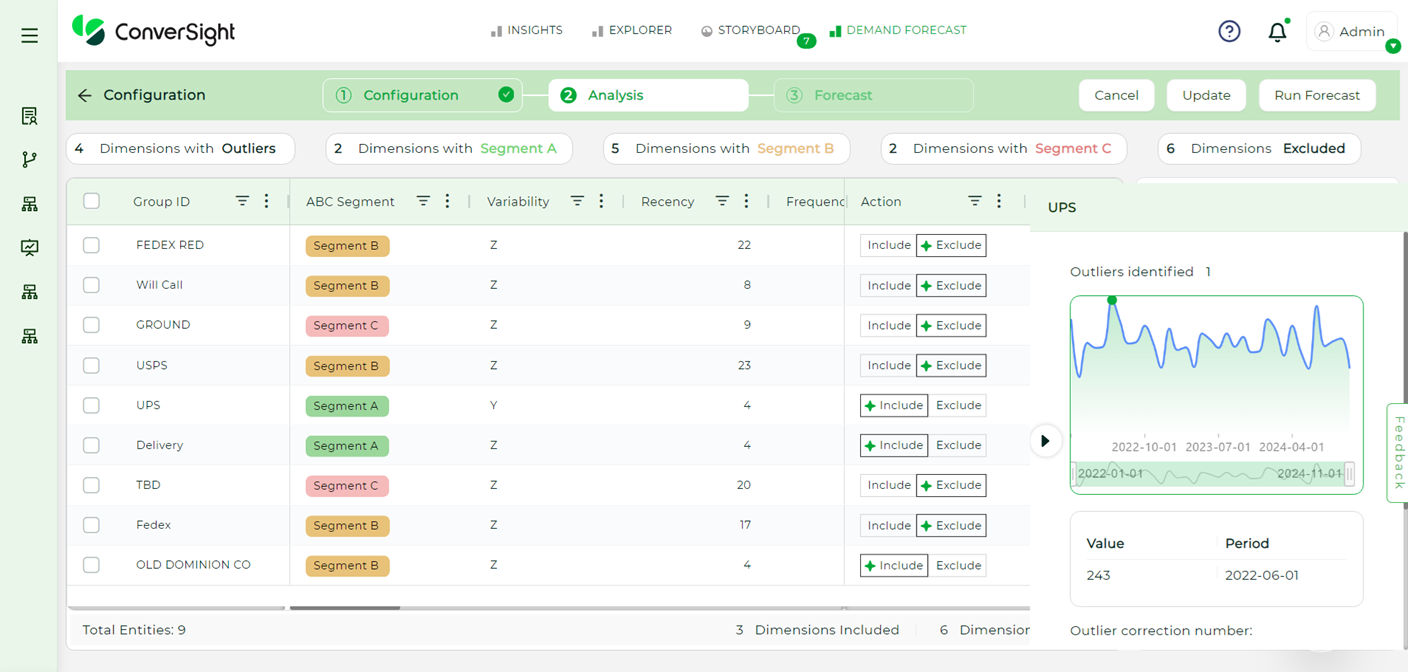
Step 2: When users click on the Generate option, the forecasted values will be analyzed and generated. This analysis may take some time. Once completed, users will see a detailed view of the data, with analyses classified based on various variables, including Segment, Variance, Recency, RRS, Outlier Counts, Negatives, Zeros, Mean, Median, Standard Deviation, Coefficient of Variance and Skew.
Analysis#
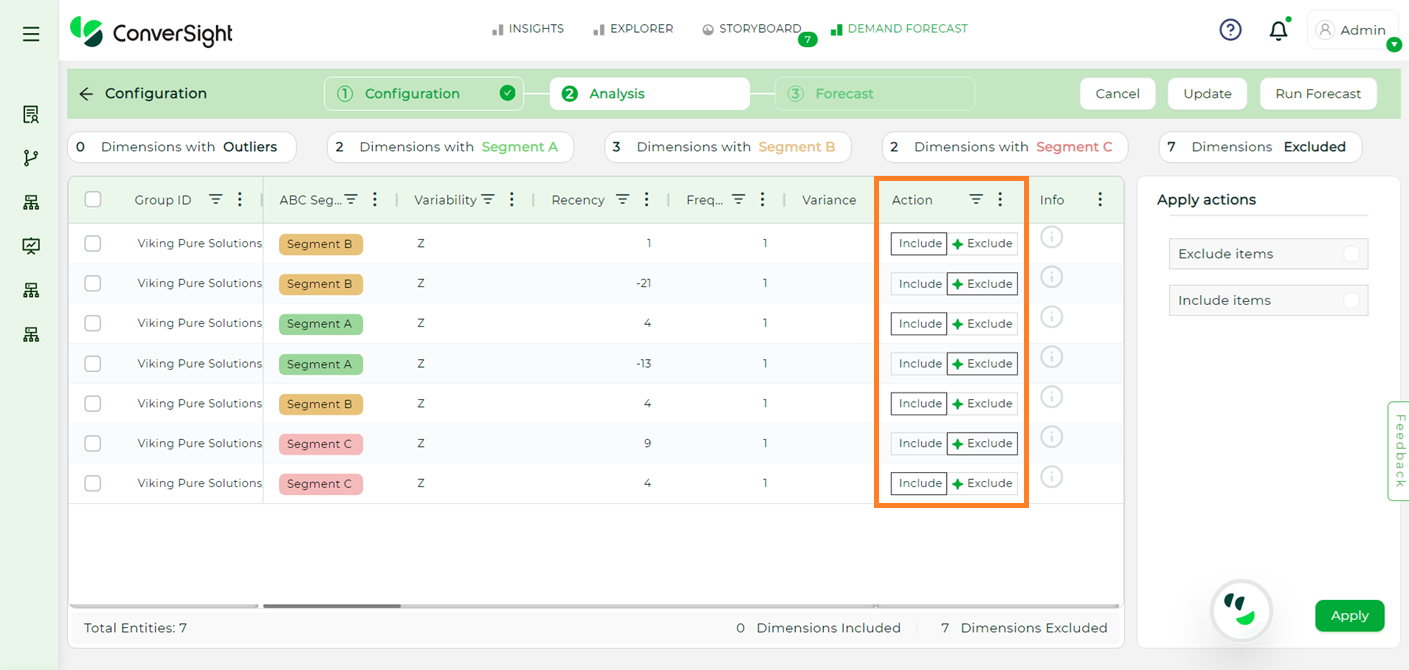
Step 3: In the Action columns, users can click on “Exclude” or “Include” to add or remove values from the forecasting. The starred options are recommendations from ConverSight for improved forecasting. Once selected click on the Apply button.
Include or Exclude#
Clicking on the Info icon provides a clear explanation of why a specific value has been included or excluded from the forecast, complete with a visual representation.
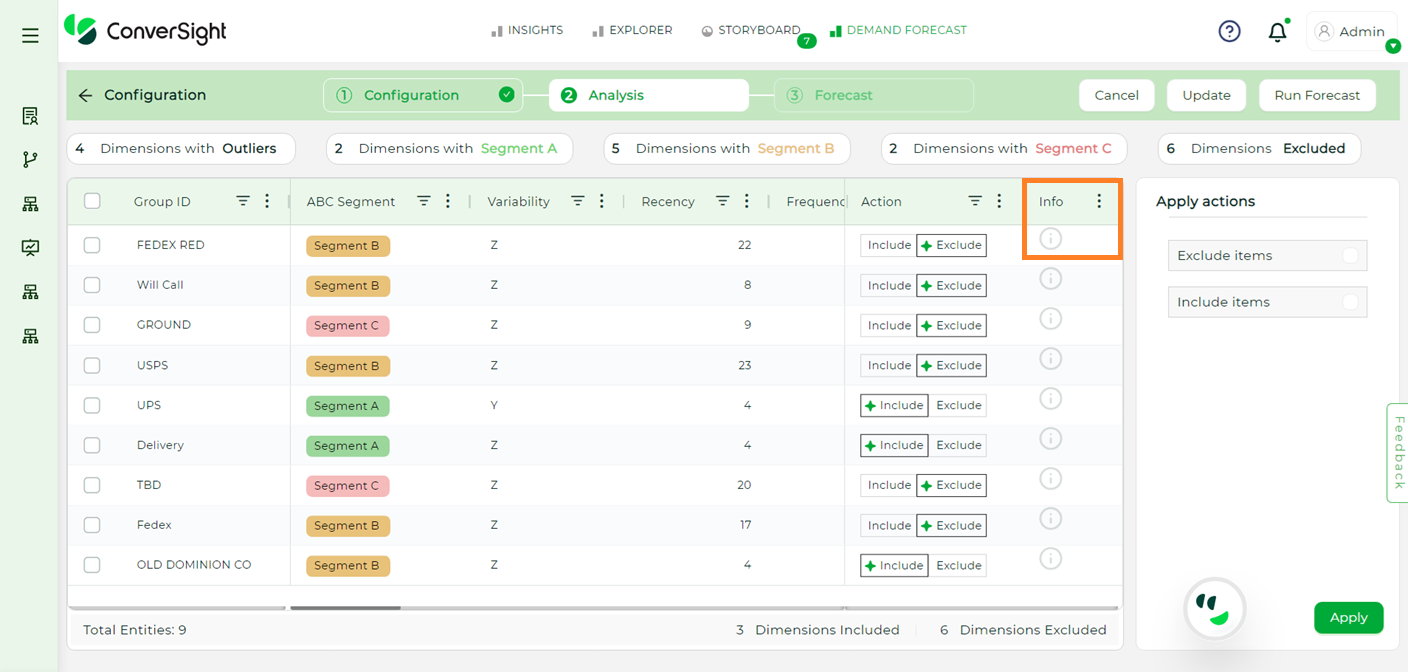
Info#
Info#
Step 4: Once the selections are made, click on the Save button and then click on the Run Forecast button.
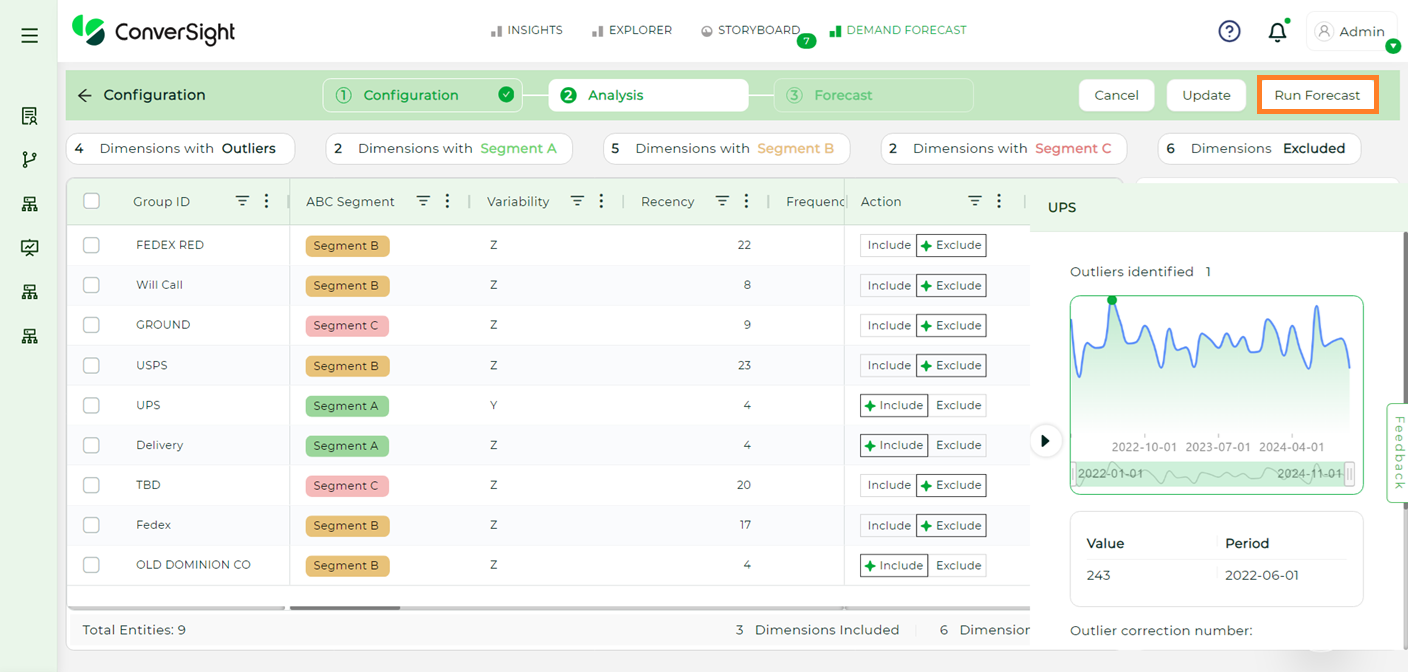
Run Forecast#
Step 5: Users can update all storyboard values created or holding values based on the forecasted results by clicking the Publish button.
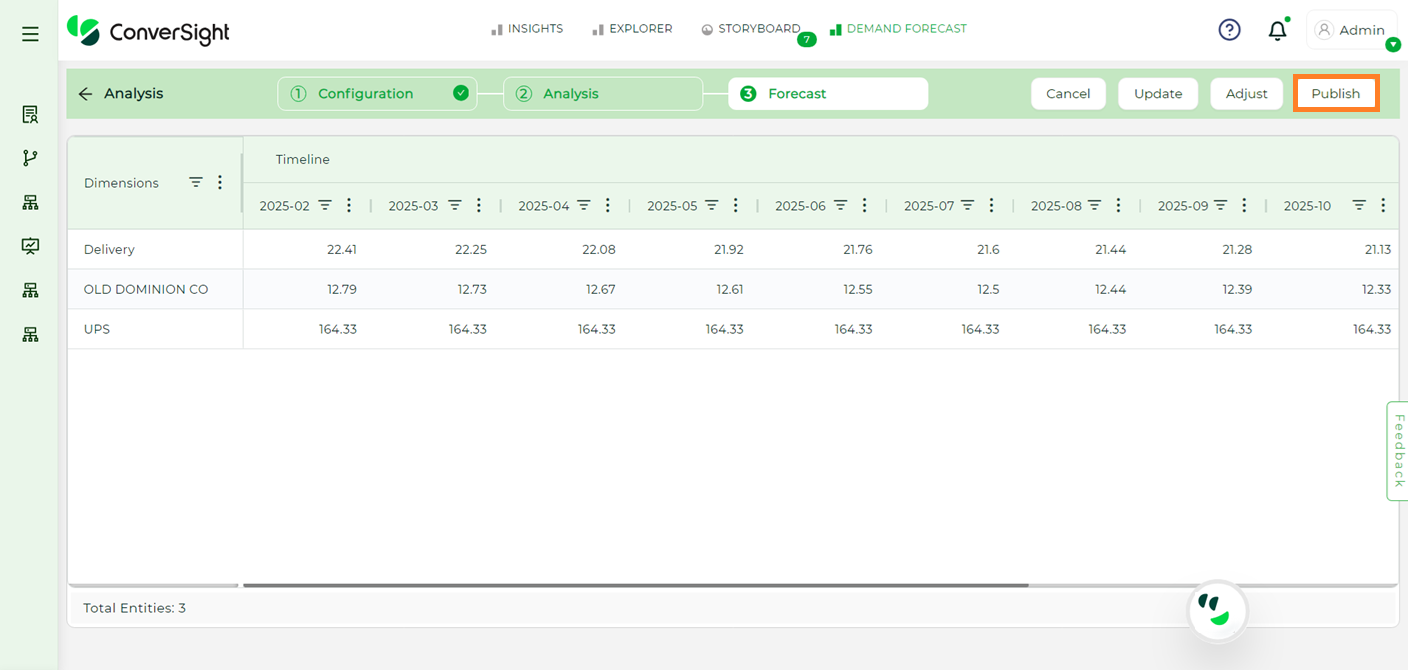
Publish to Storyboards#
Adjusting Forecasting Values#
Users have the flexibility to adjust forecasted values by following these steps:
Adjusting Values by Growth Factor#
Step 1: Click the Adjust button to make the forecast table editable.
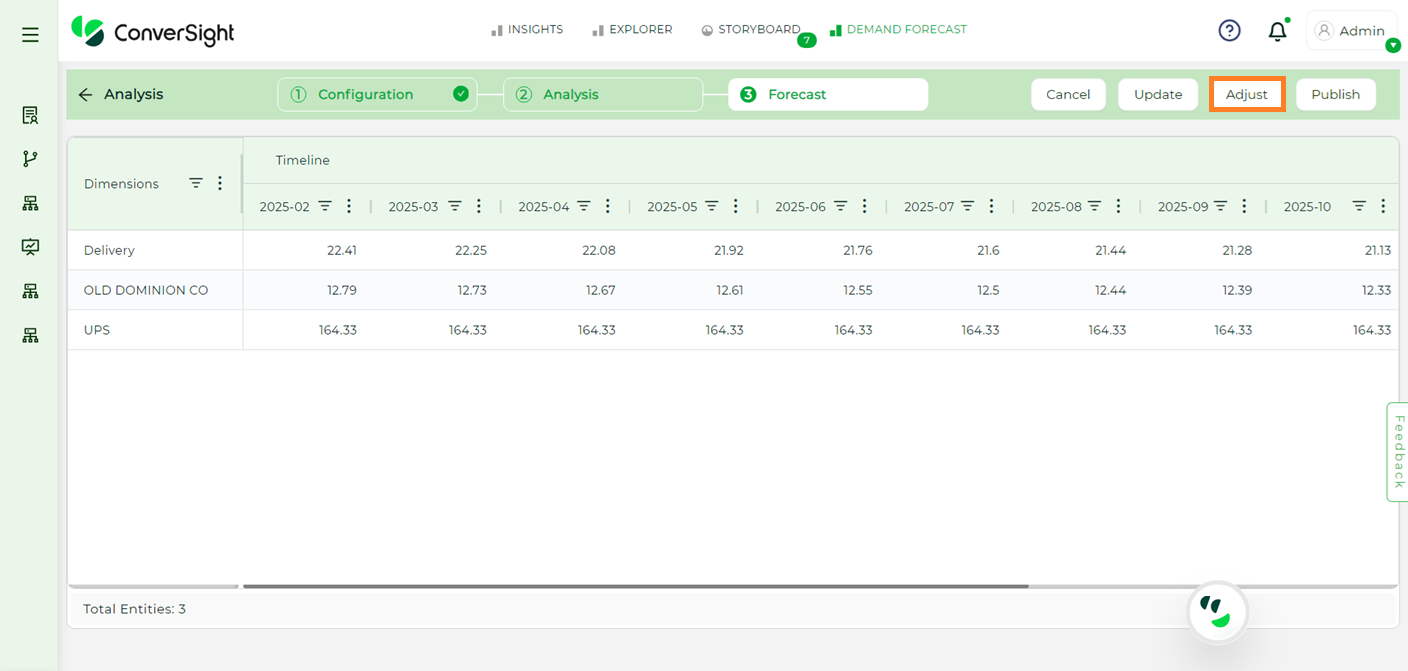
Adjusting Values#
Step 2: Select values either by Dimensions or by Timeline by checking the check box.
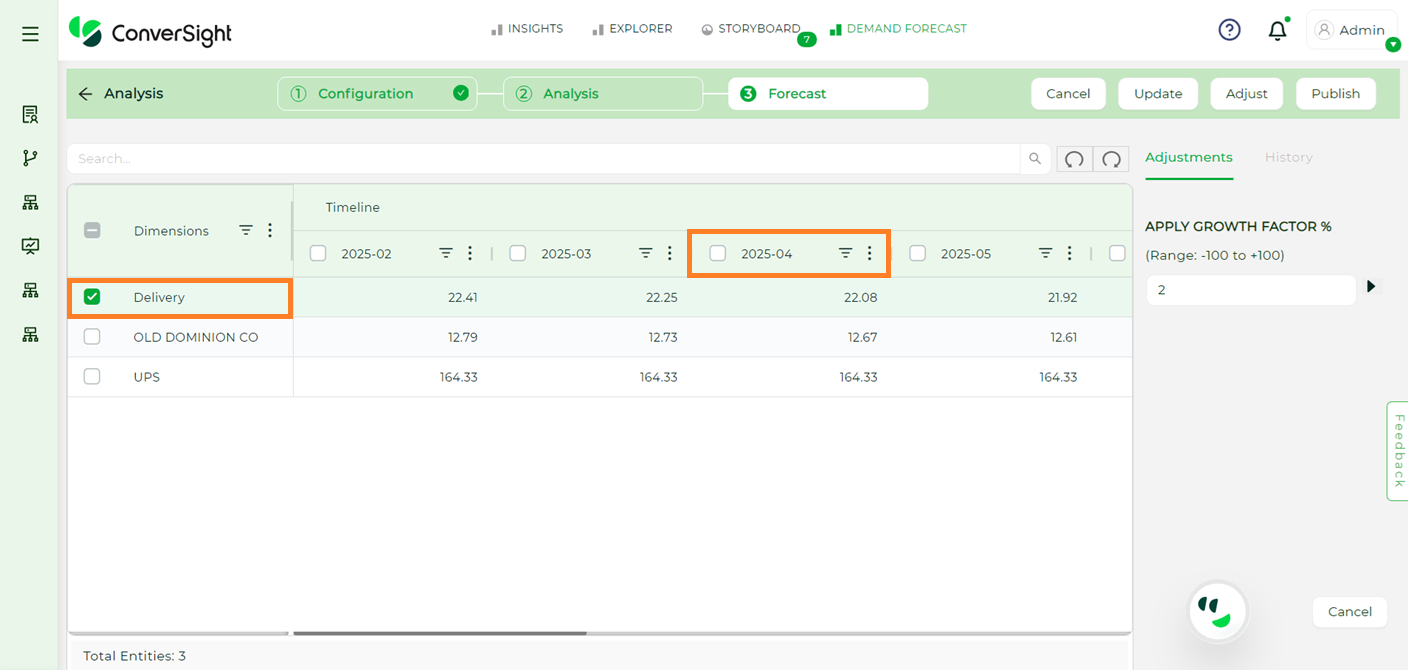
Adjusting Values#
If a specific value needs adjustment, simply double-click on the cell to make it editable. Enter the new value directly into the cell.
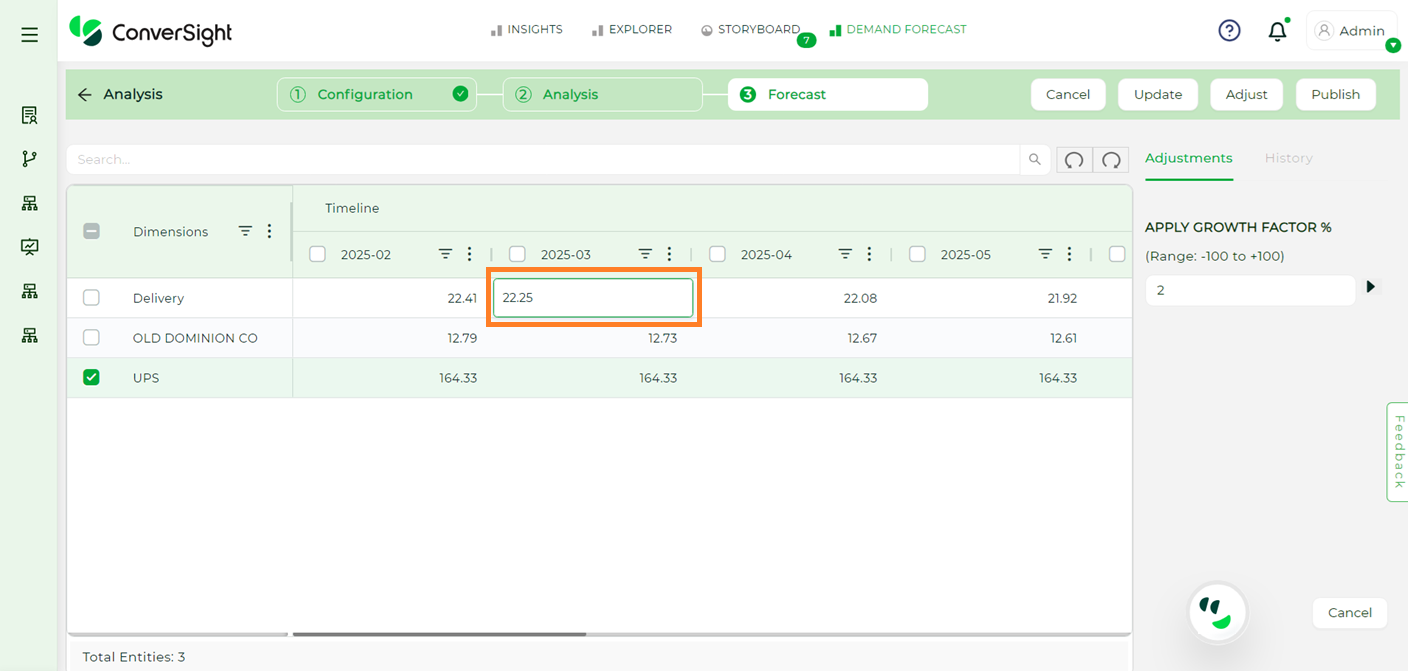
Adjusting Specific Values#
Step 3: To apply a growth factor, enter the desired percentage in the Apply Growth Factor % input box located under the adjustment section. Once the growth factor is applied, click the Play button to implement the changes.
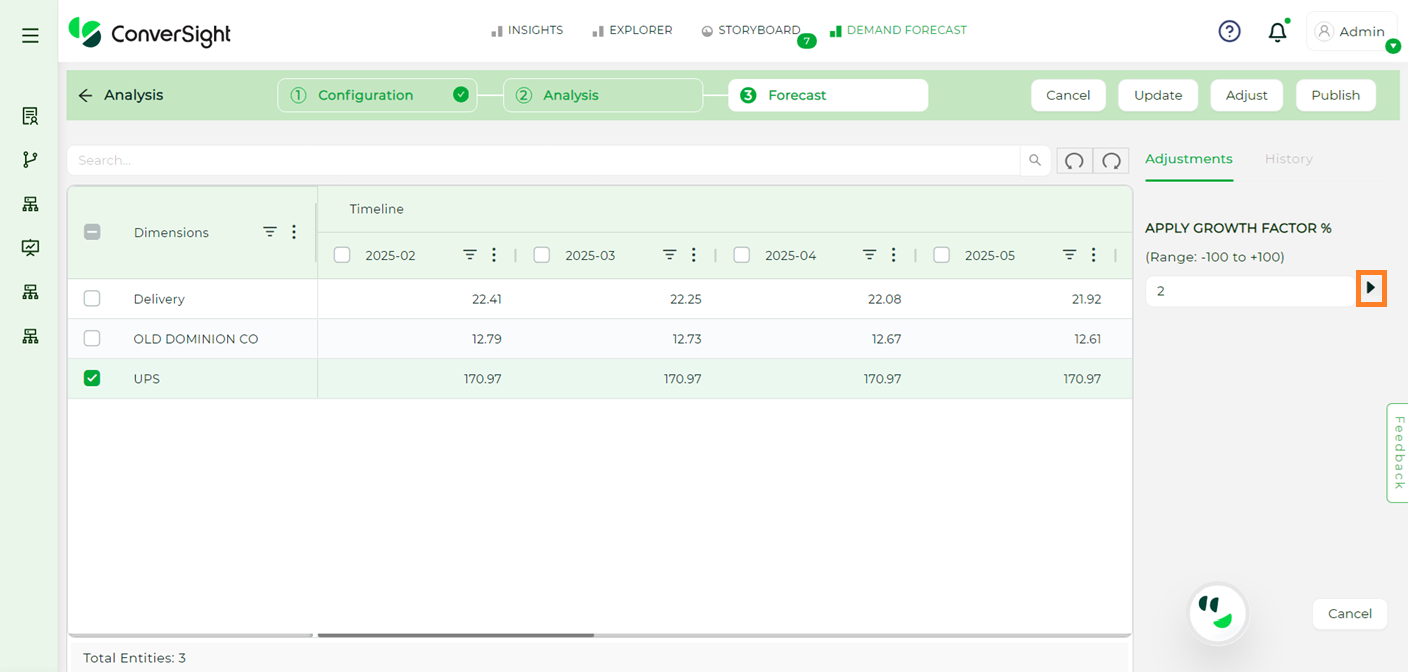
Adjusting Specific Values#