Storyboard#
A Storyboard is a convenient way to view and organize all of the charts, graphs and insights that are relevant to you in one place. You can access all of the saved visualizations you have created and pin them to a Storyboard to create a custom display of your data.
Usage of Storyboard
You can pin charts and tables to any Storyboard you have created and those that have been shared with you with the edit privilege. When you create a Storyboard, you can share it with other people with either the view or edit privilege. Storyboard are interactive and allows you to perform actions like filtering, excluding values and drilling down on the visualizations.
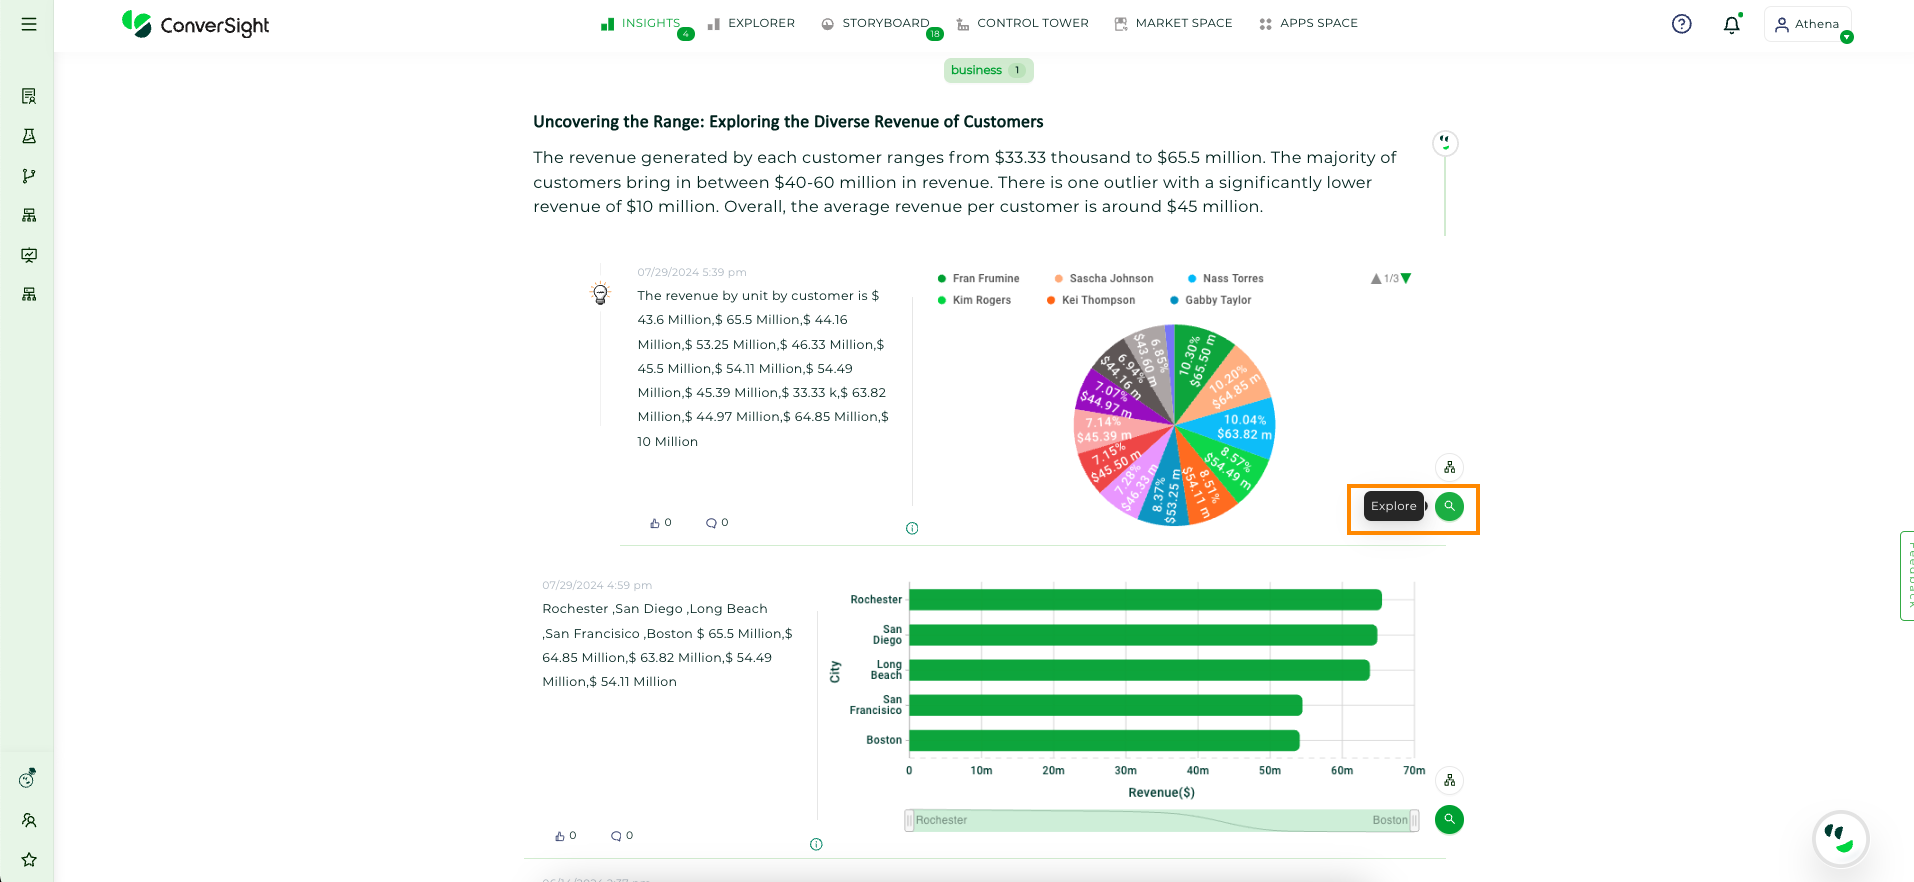
You can use the explore icon from any insight which you wish to add to Storyboard.
Insights#
Now, let’s add the insights to a Storyboard.
Add to Storyboard#
Create a New Storyboard#
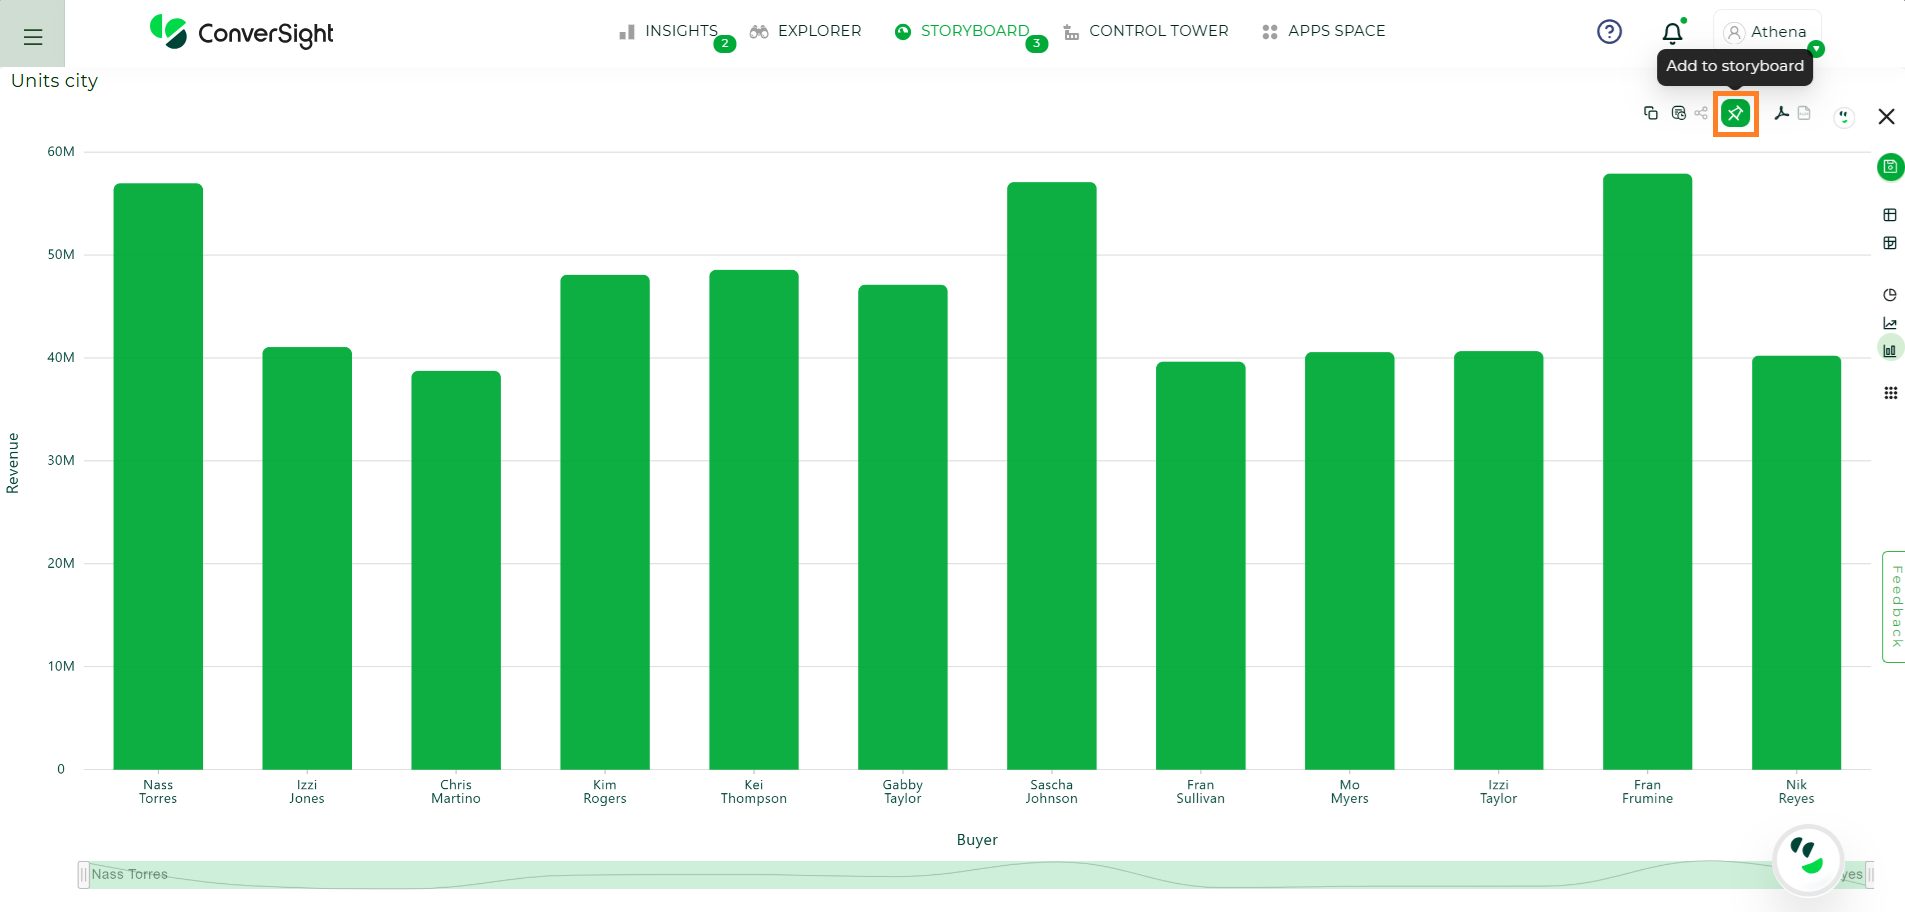
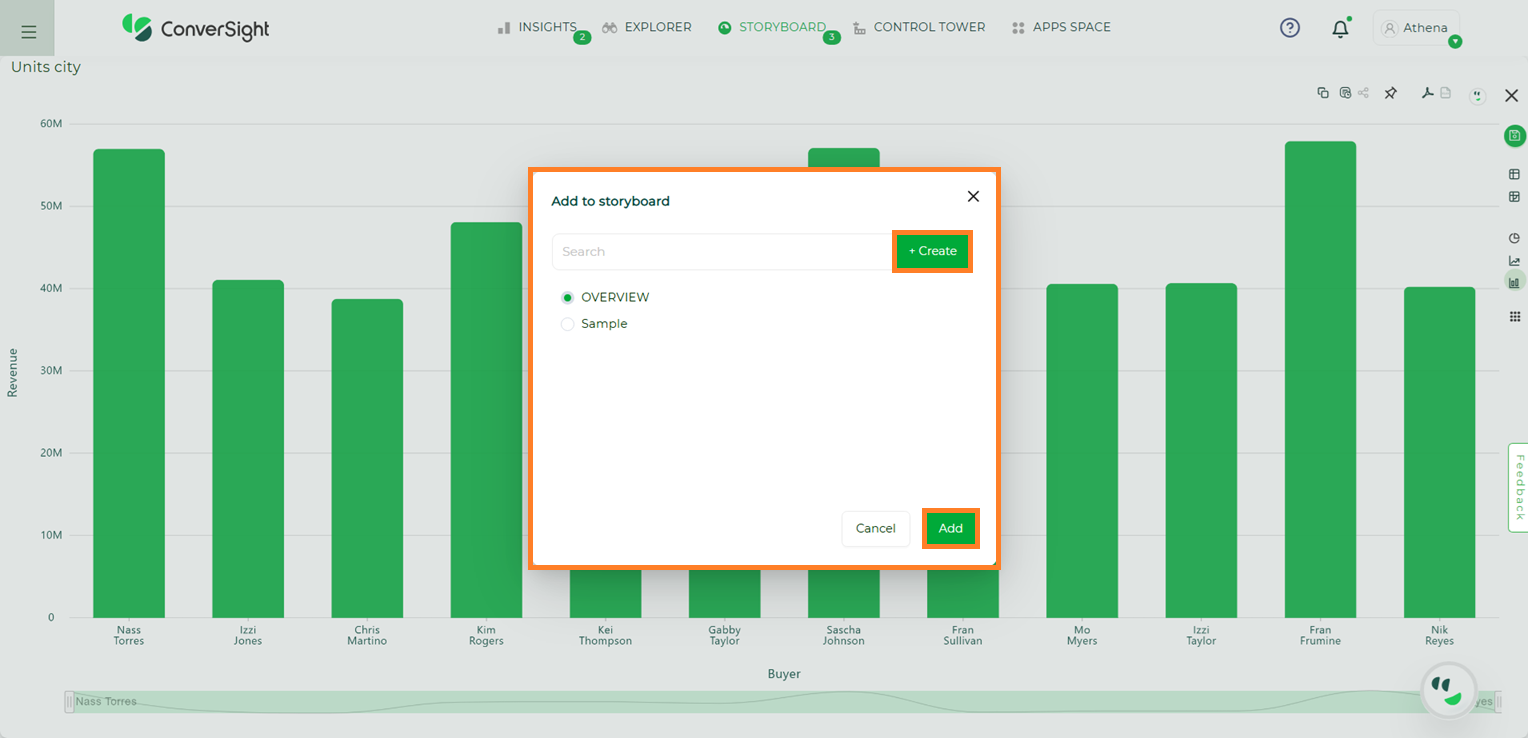
Click on the  icon on the insights page, then you can add your query report to Storyboard. In the dialog box, you can click the + Create to create a new Storyboard or you can add the query report to existing Storyboard. In the dialog box, a list of existing Storyboards will be displayed, from which you can select one and click the add button.
Add a Storyboard
You will get the dialog box for adding to a Storyboard, enter a new Storyboard name, then click on the create and add button, which will then save it and add it to the Storyboard.
Create a New Storyboard#
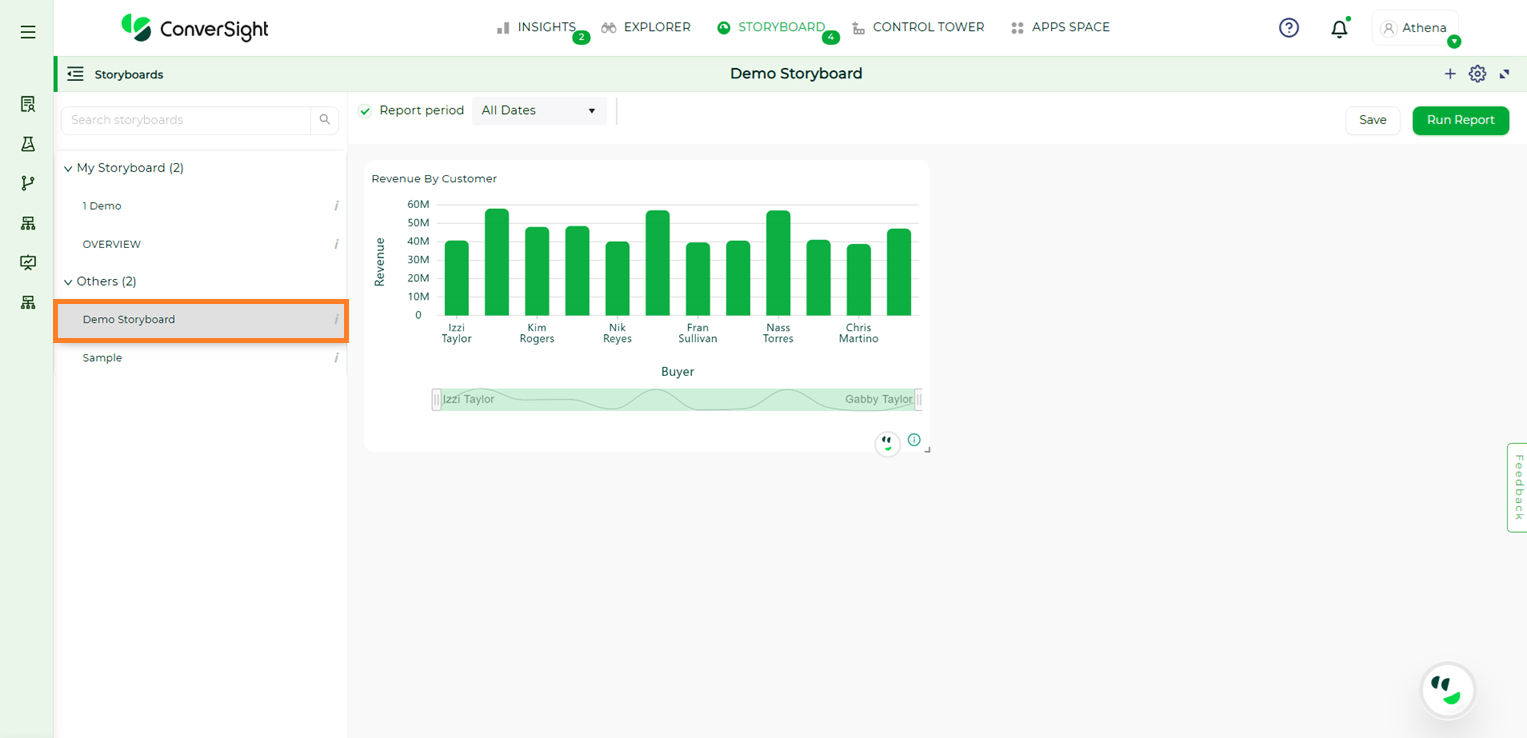
Here, a new Storyboard named Sample Storyboard is created.
Created a New Storyboard#
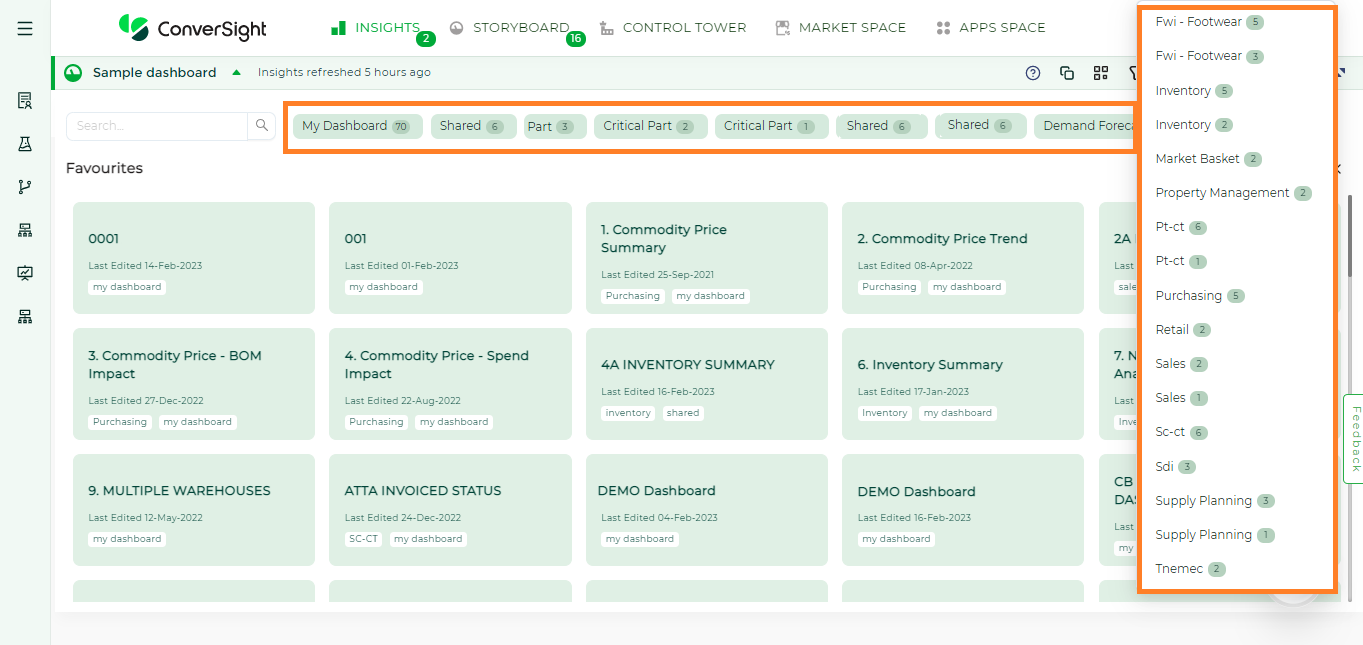
The Storyboard bar on the home page displays your saved Storyboard. The created Storyboard will be added to a business area, which is similar to a tag. For example, because you created the Storyboard Test, it will be added to the business area My Storyboard automatically. While editing a Storyboard, the business area can be changed.
Business Area#
My Storyboard#
NOTE
With the Storyboard, you can view the pinned datasets and receive insight updates every time there's a republish.
My Storyboard is like a folder to view your pinned items. You can find the insights pinned in your Storyboards and share them with your team easily.
Your pinned insights will be displayed in a graphical representation, columns and tables.
Embed Storyboard#
The Embed Storyboard feature is really helpful when an organization’s members want to use Athena in their own apps instead of going directly to ConverSight platform. By making use of this capability, users can implement filters to limit access, customizing it for particular users and enabling them to easily retrieve data from anywhere.
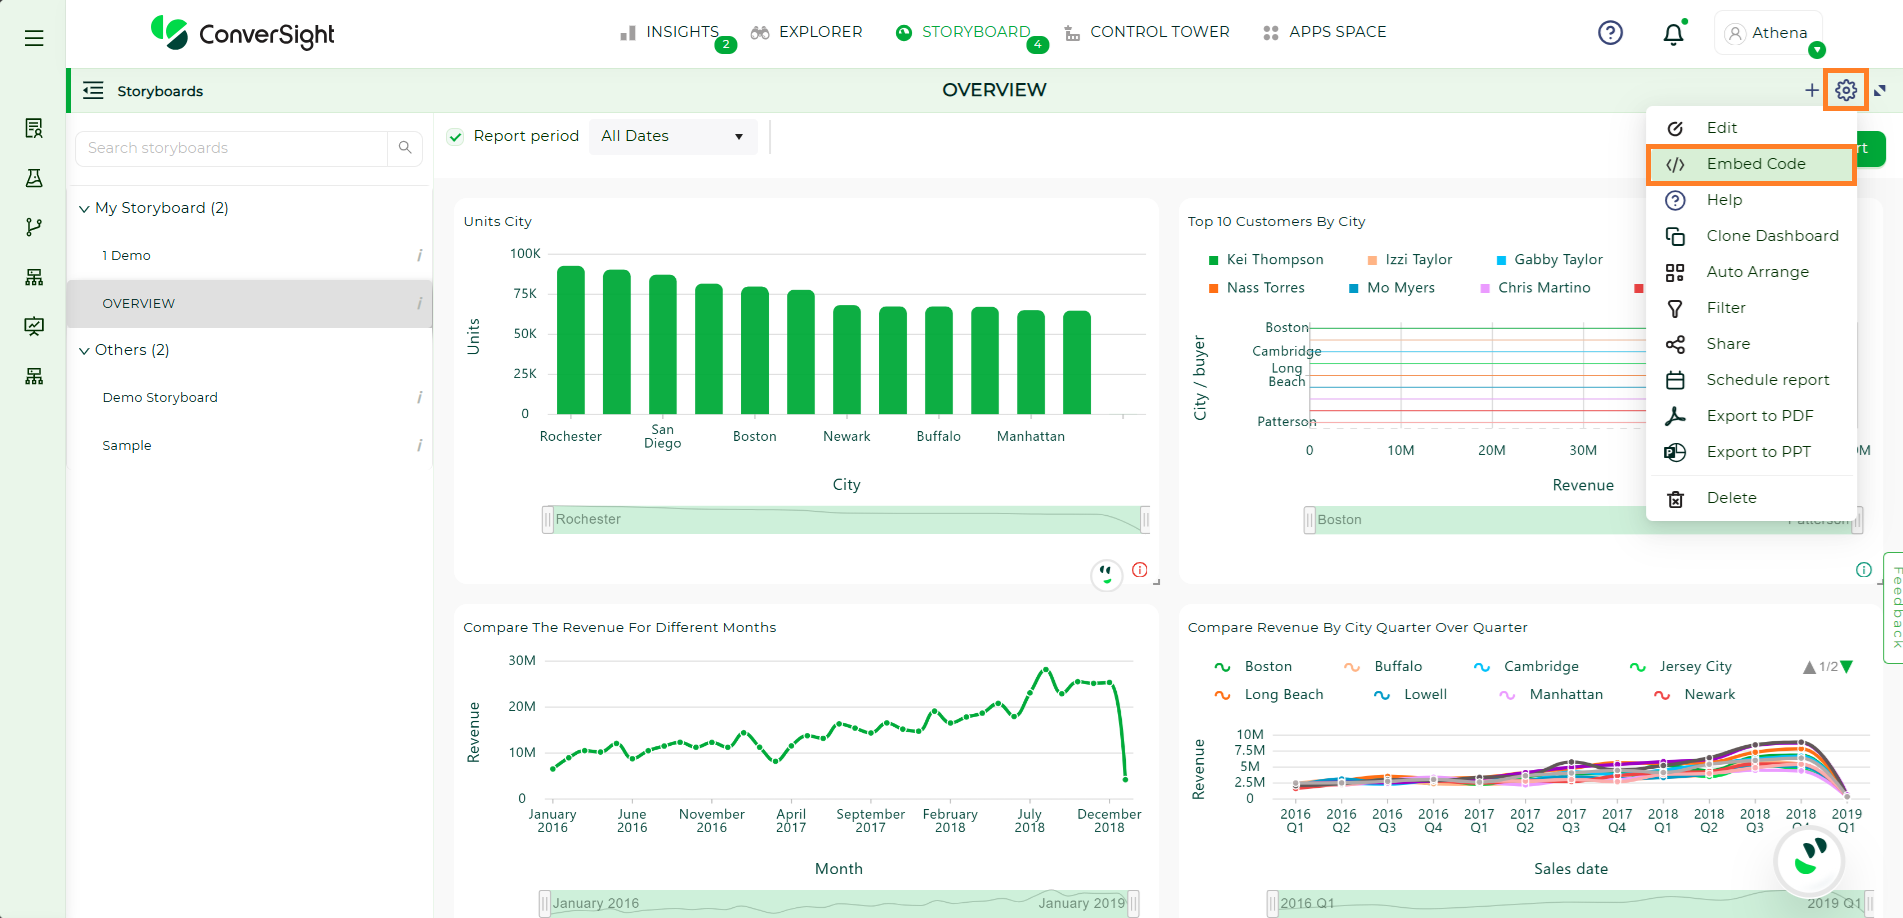
Embed Storyboard#
To know more about how to Embed Storyboard click here..
To watch the video, click on Embed Storyboard.
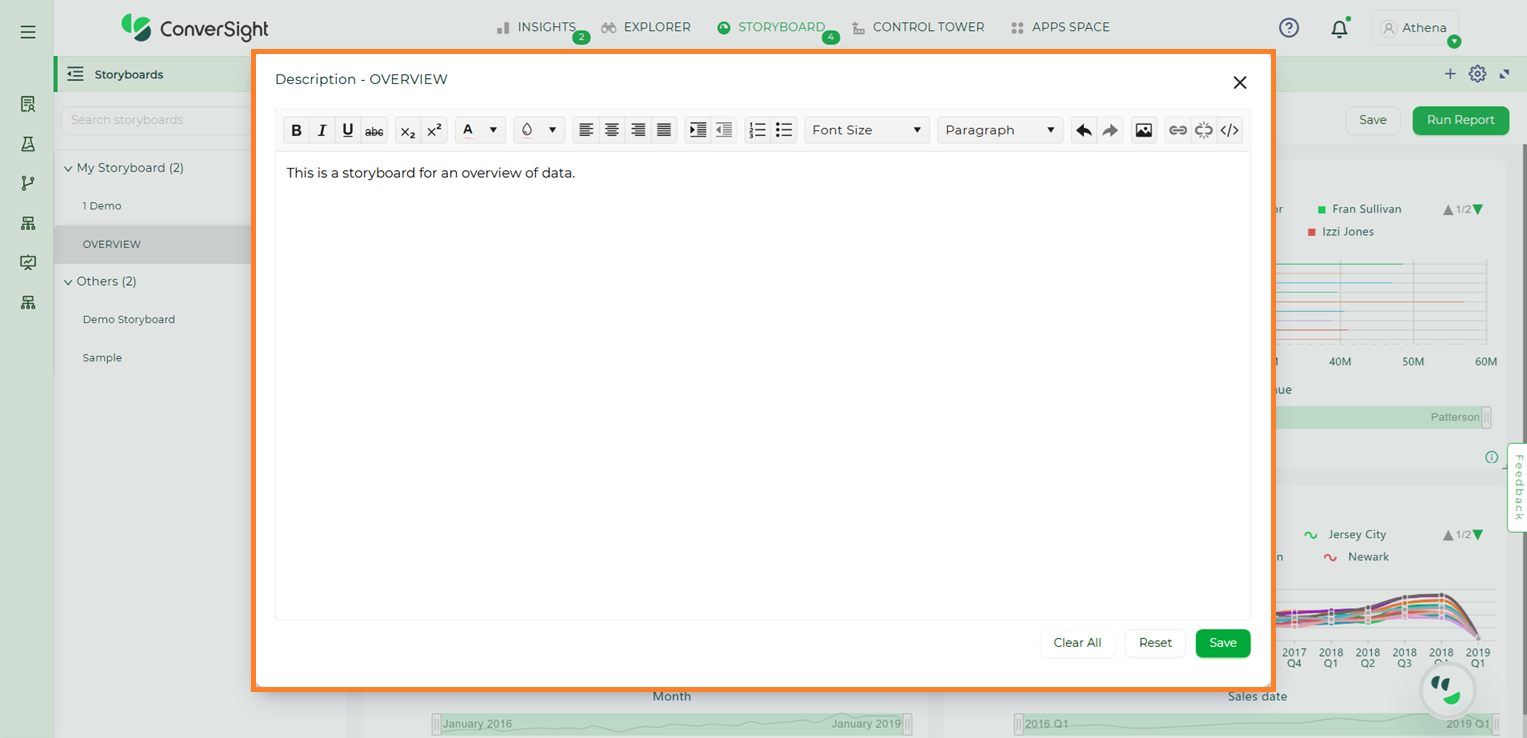
Add Help#
Click on the Add help icon in the Storyboard page. You can add description about the Storyboard. So that when you share your Storyboard with others, they can read the description and make use of the Storyboard.

Add Help#
Along with the description, you can also add images as attachments for better understanding.
Add Help#
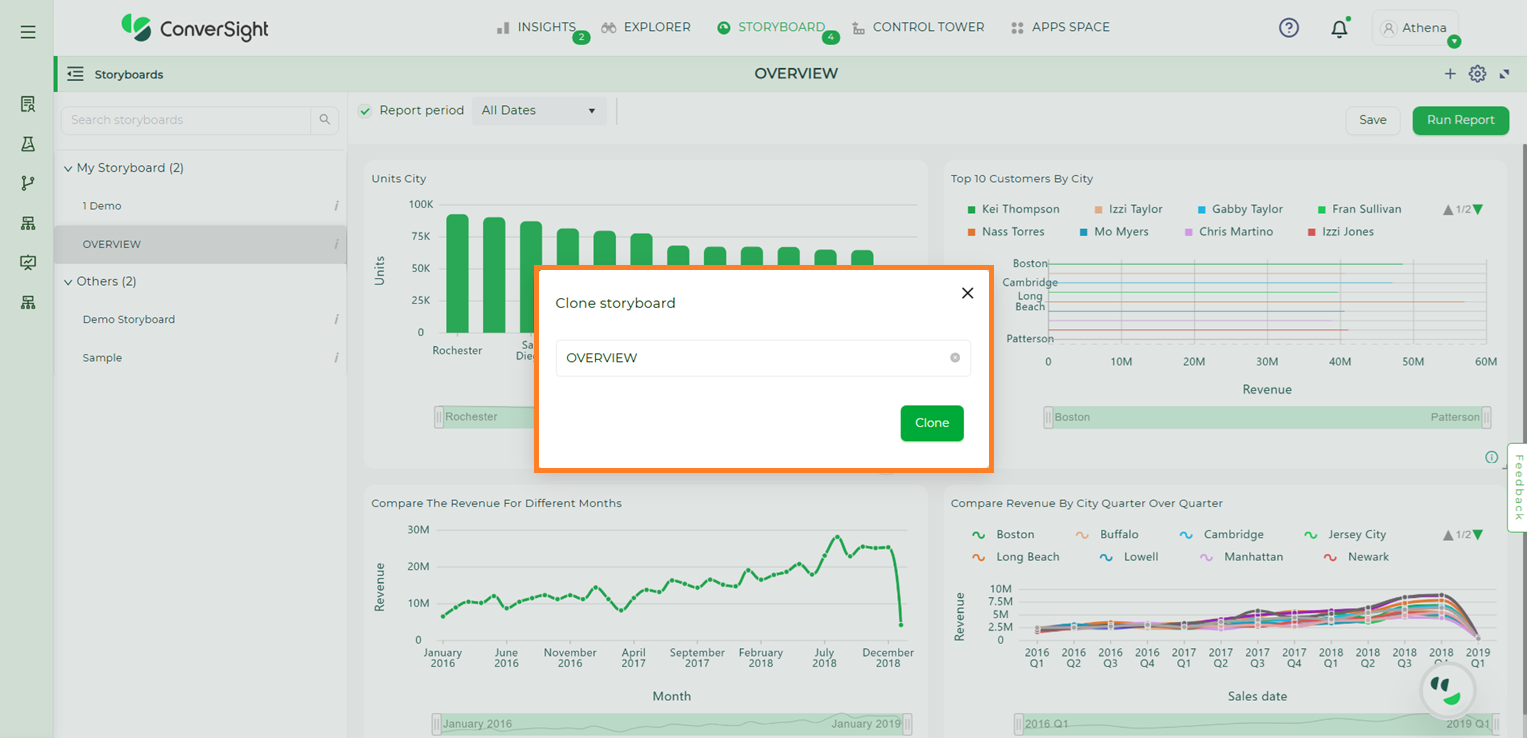
Clone#
Click on the Clone icon in the Storyboard page. Clone helps you in creating a copy of your Storyboard and edit it as required to create another Storyboard.
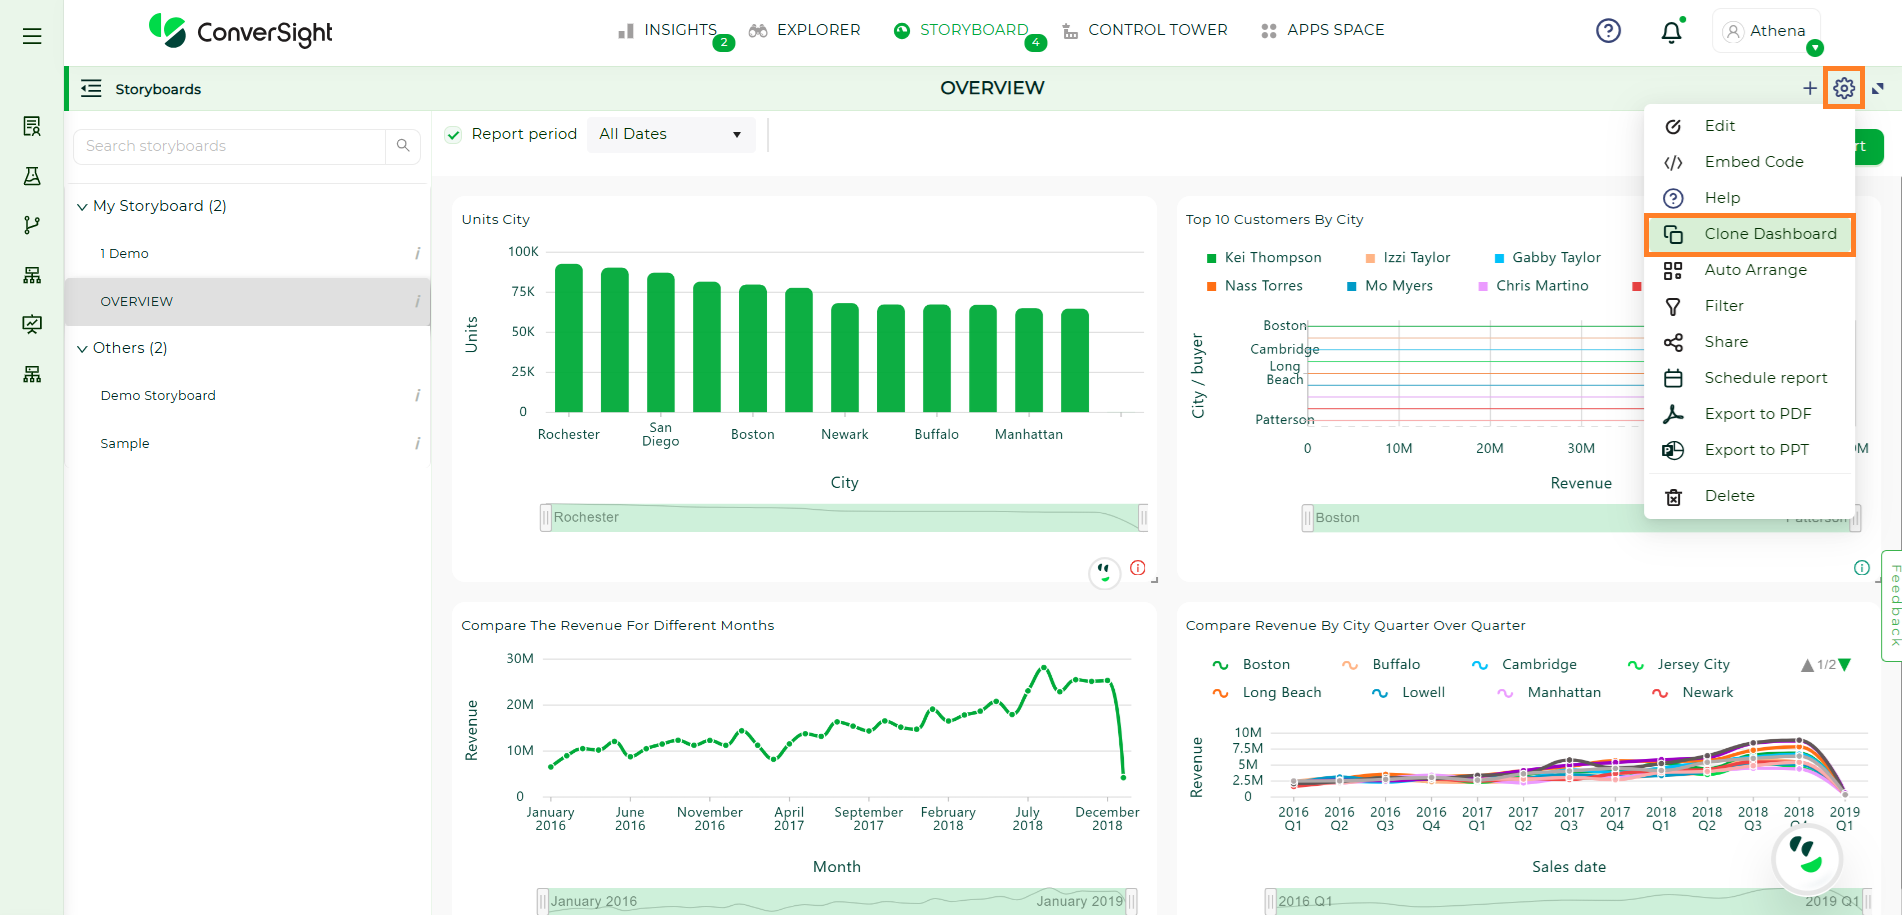
Clone a Storyboard#
Clone a Storyboard#
Auto-Arrange#
Click on the Auto Arrange icon in the Storyboard page. This helps you in re-arranging your data or components in the Storyboard and gives you the best view by reducing free spaces.
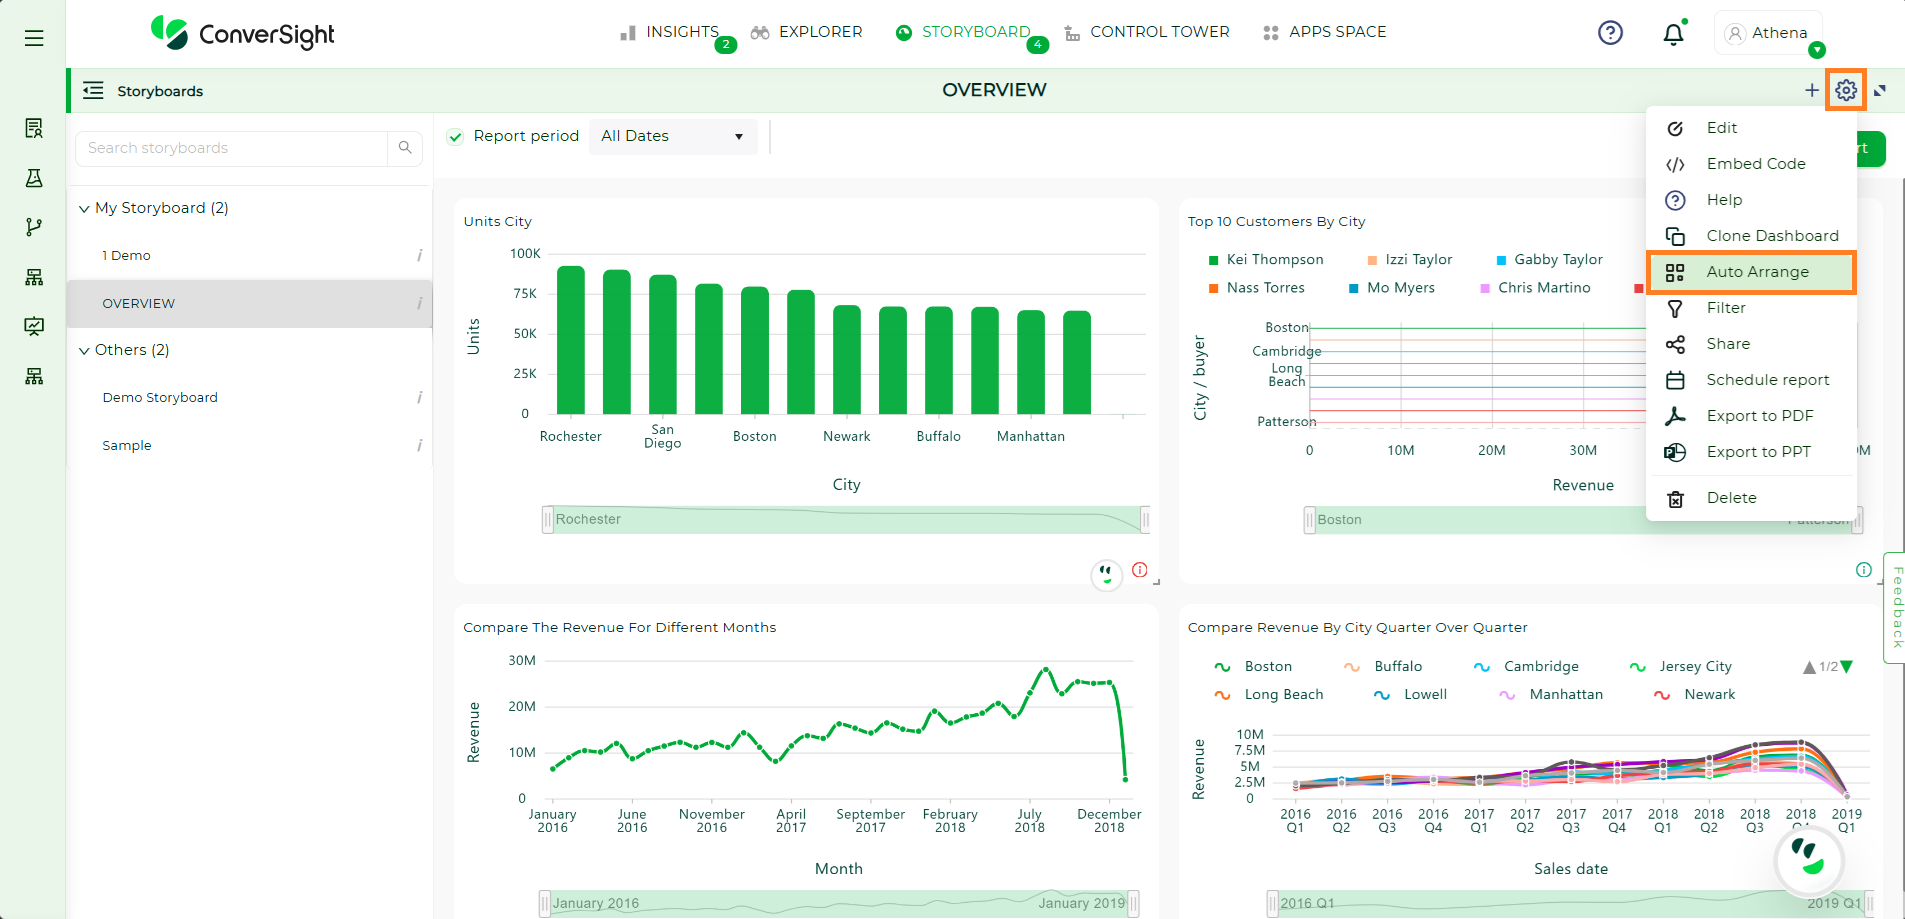
Auto Arrange a Storyboard#
Share Storyboard#
Click on the Share icon from the Storyboard page. You can share the selected Storyboard.
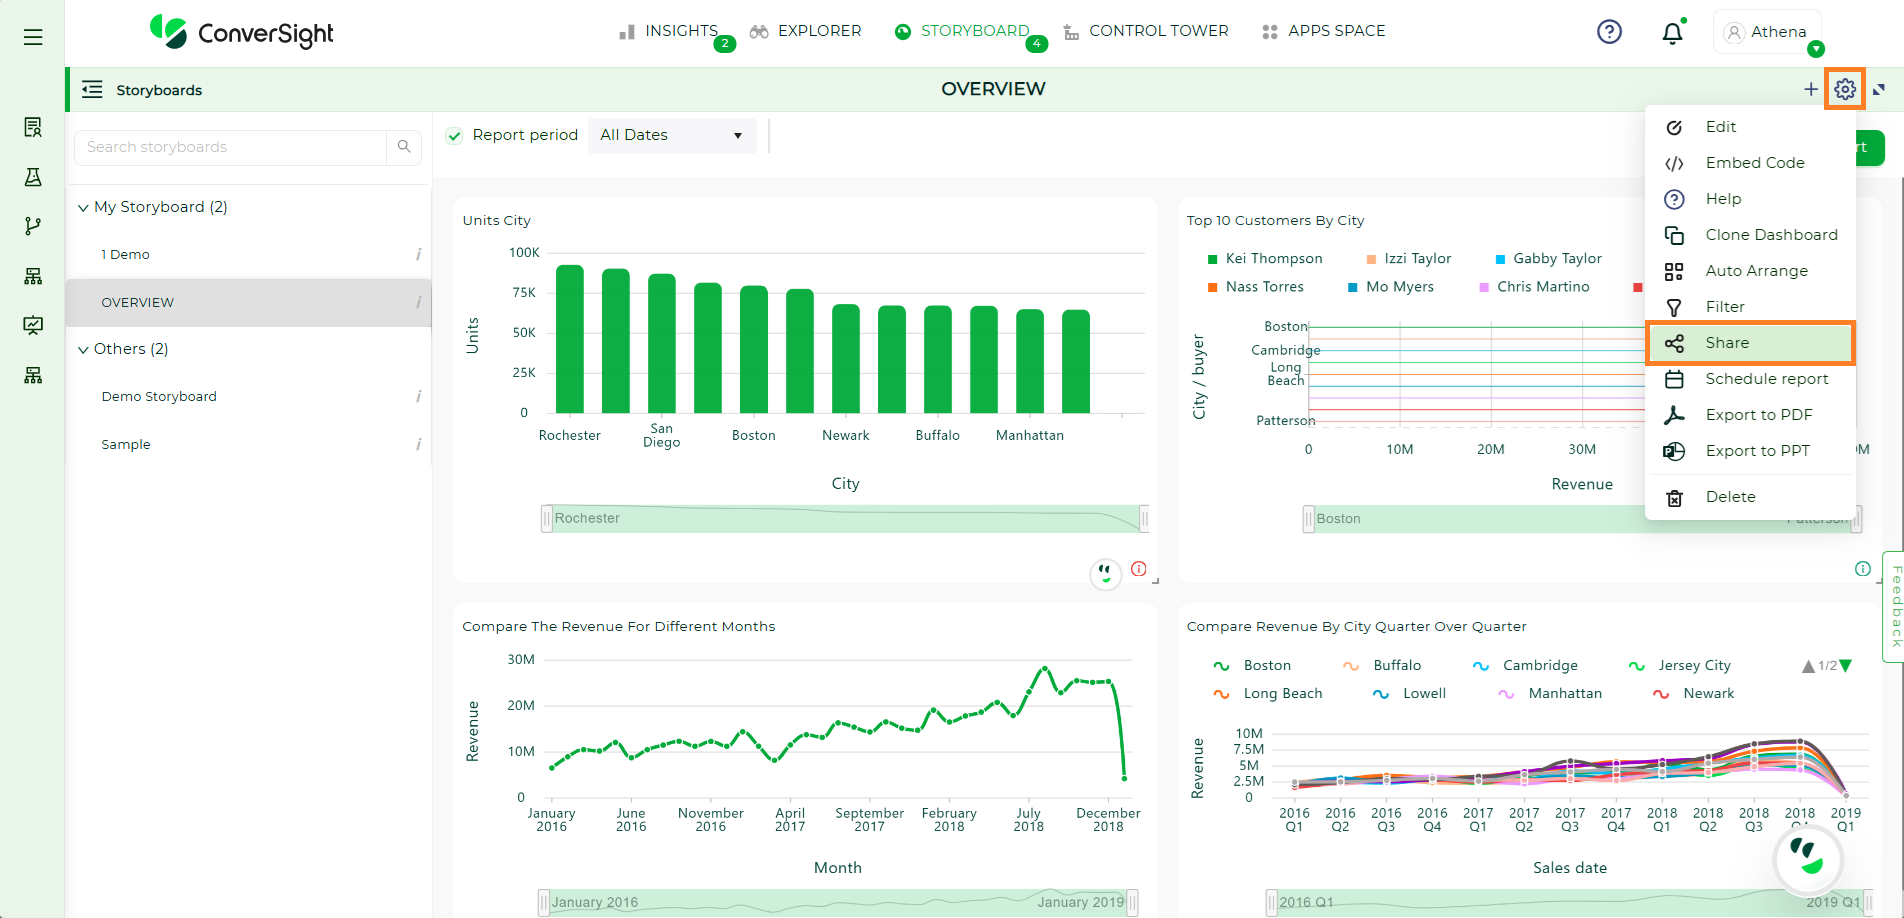
Share a Storyboard#
Select the user’s email address and you can share your selected Storyboard graph.
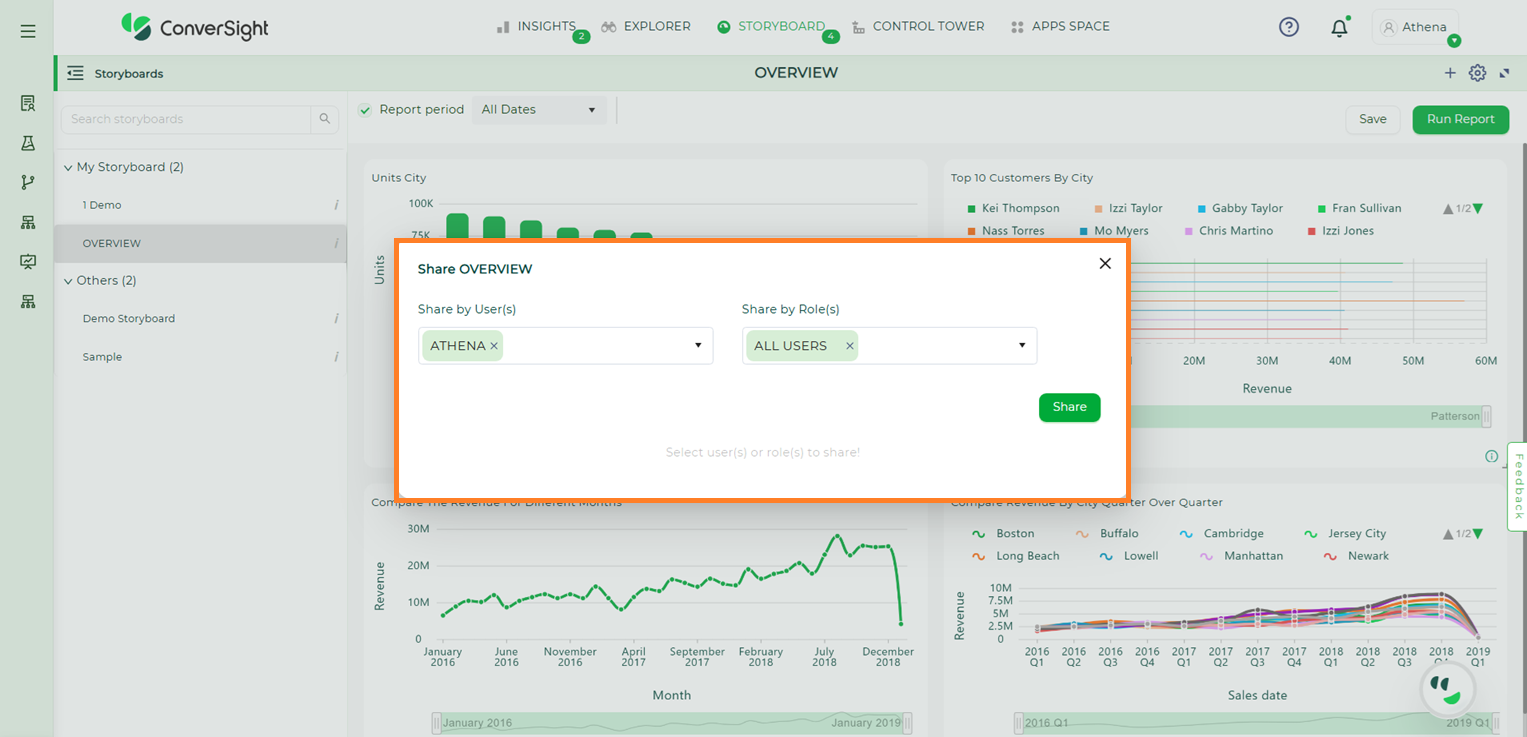
Share a Storyboard#
Schedule a Storyboard#
You can schedule a Storyboard job for any Storyboard. Click the Calendar icon on the top right corner of the My Storyboard selected Storyboard.
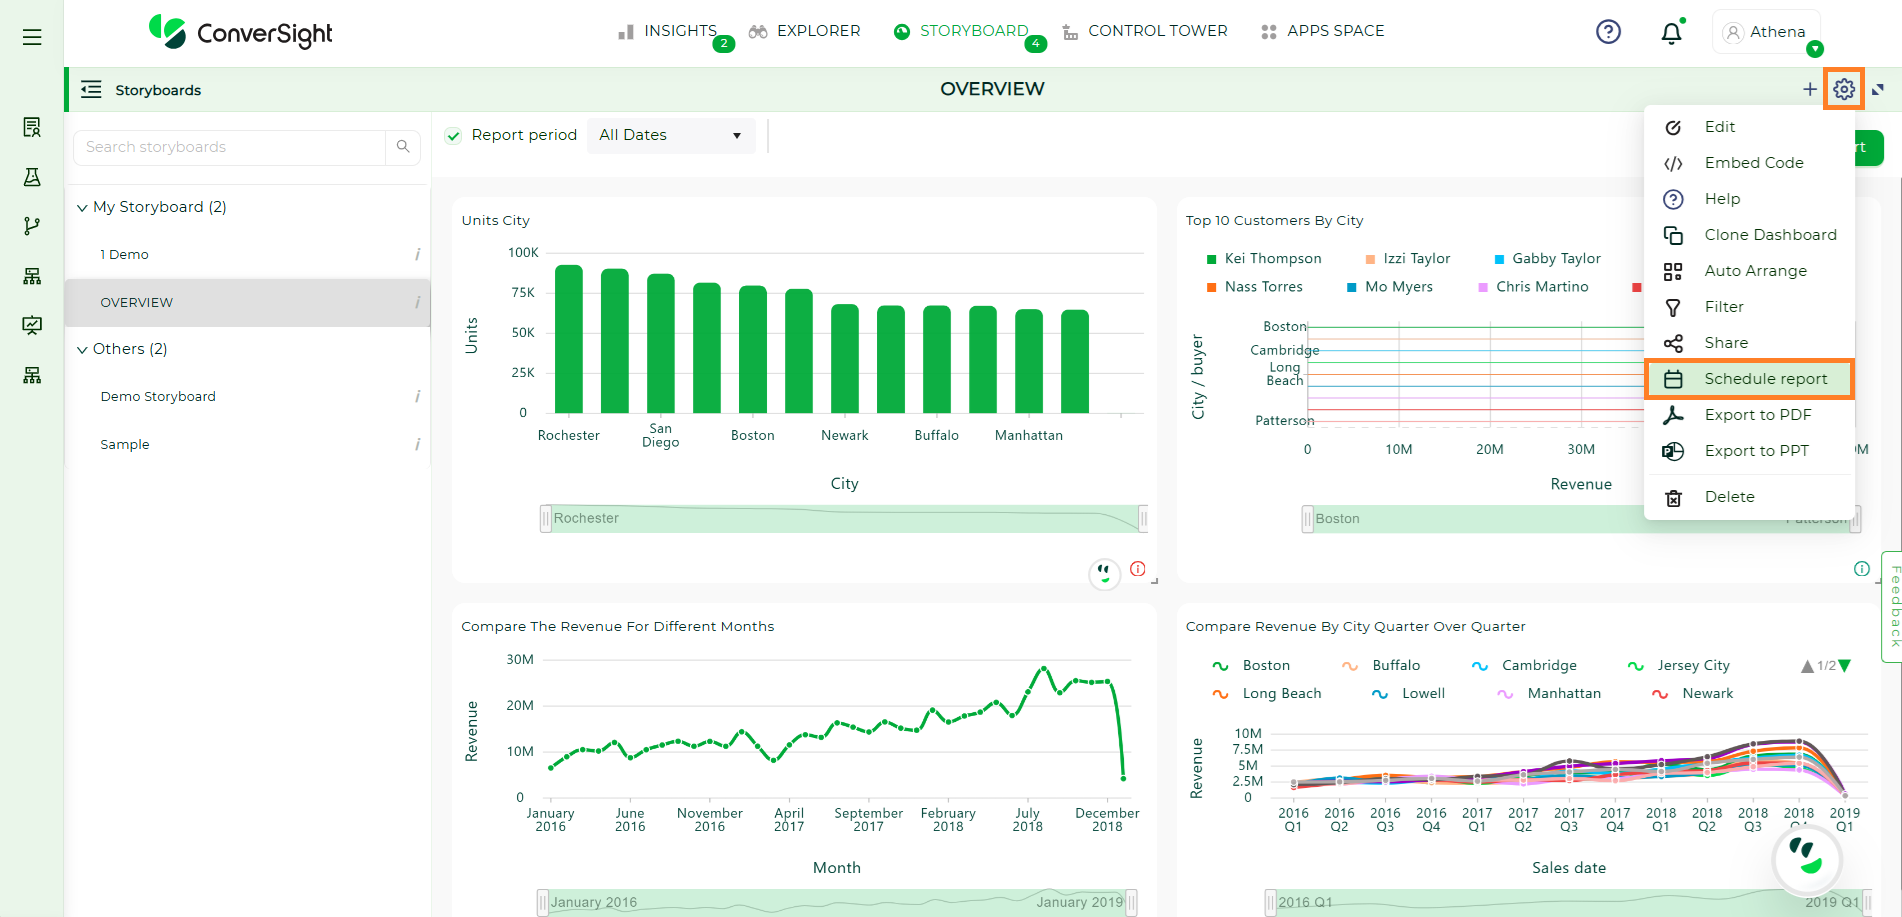
Schedule a Storyboard#
In the Scheduled Storyboard dialog box, you can add your email address as well as emails you would like to CC. You can set your schedule to daily or weekly and can also set your timings. Once you save your scheduled Storyboard, it will be sent to the recipient email with your set timings.
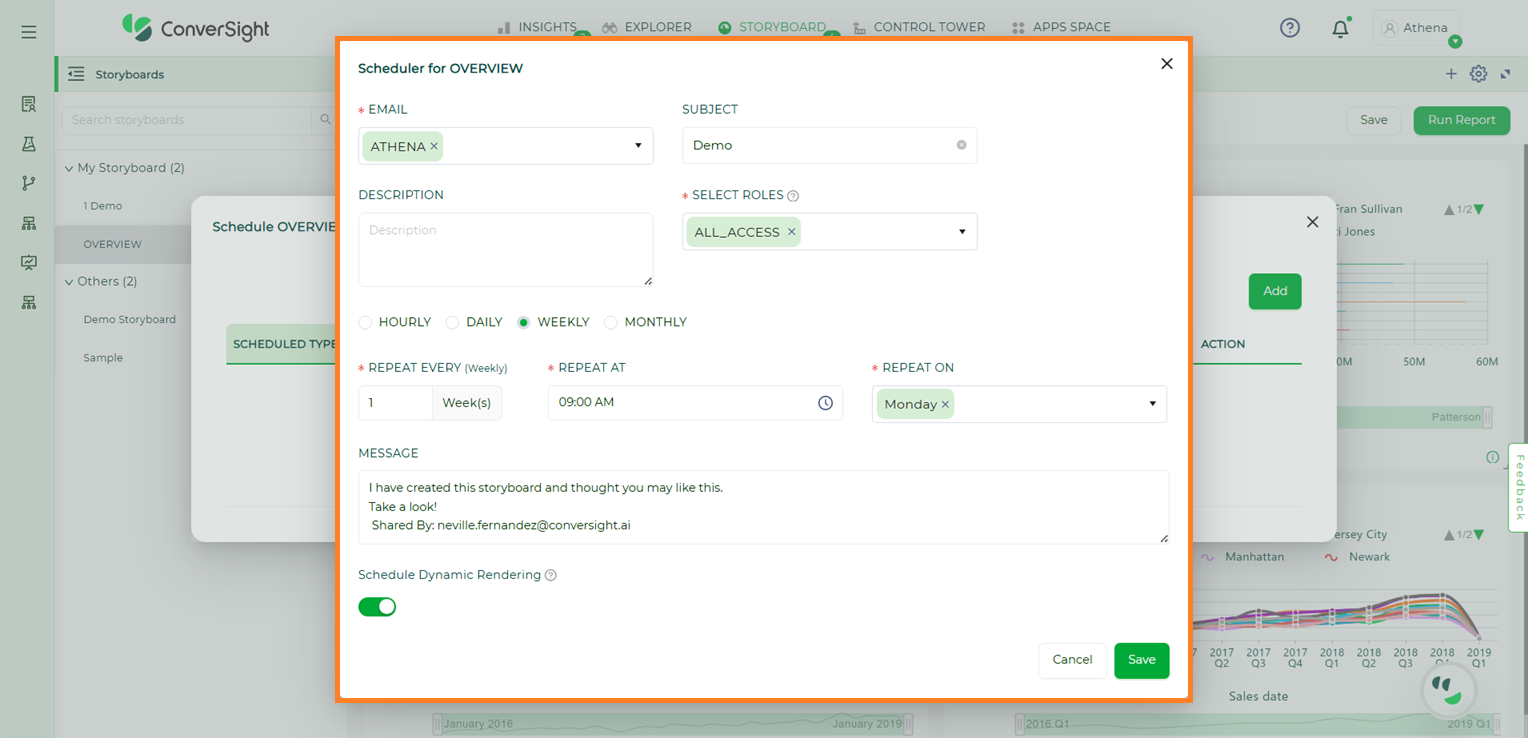
Schedule a Storyboard#
To watch the video, click on Scheduling Storyboard.
Edit a Storyboard#
If you want to edit the original Storyboard, click on the edit icon and you can change your Storyboard name.
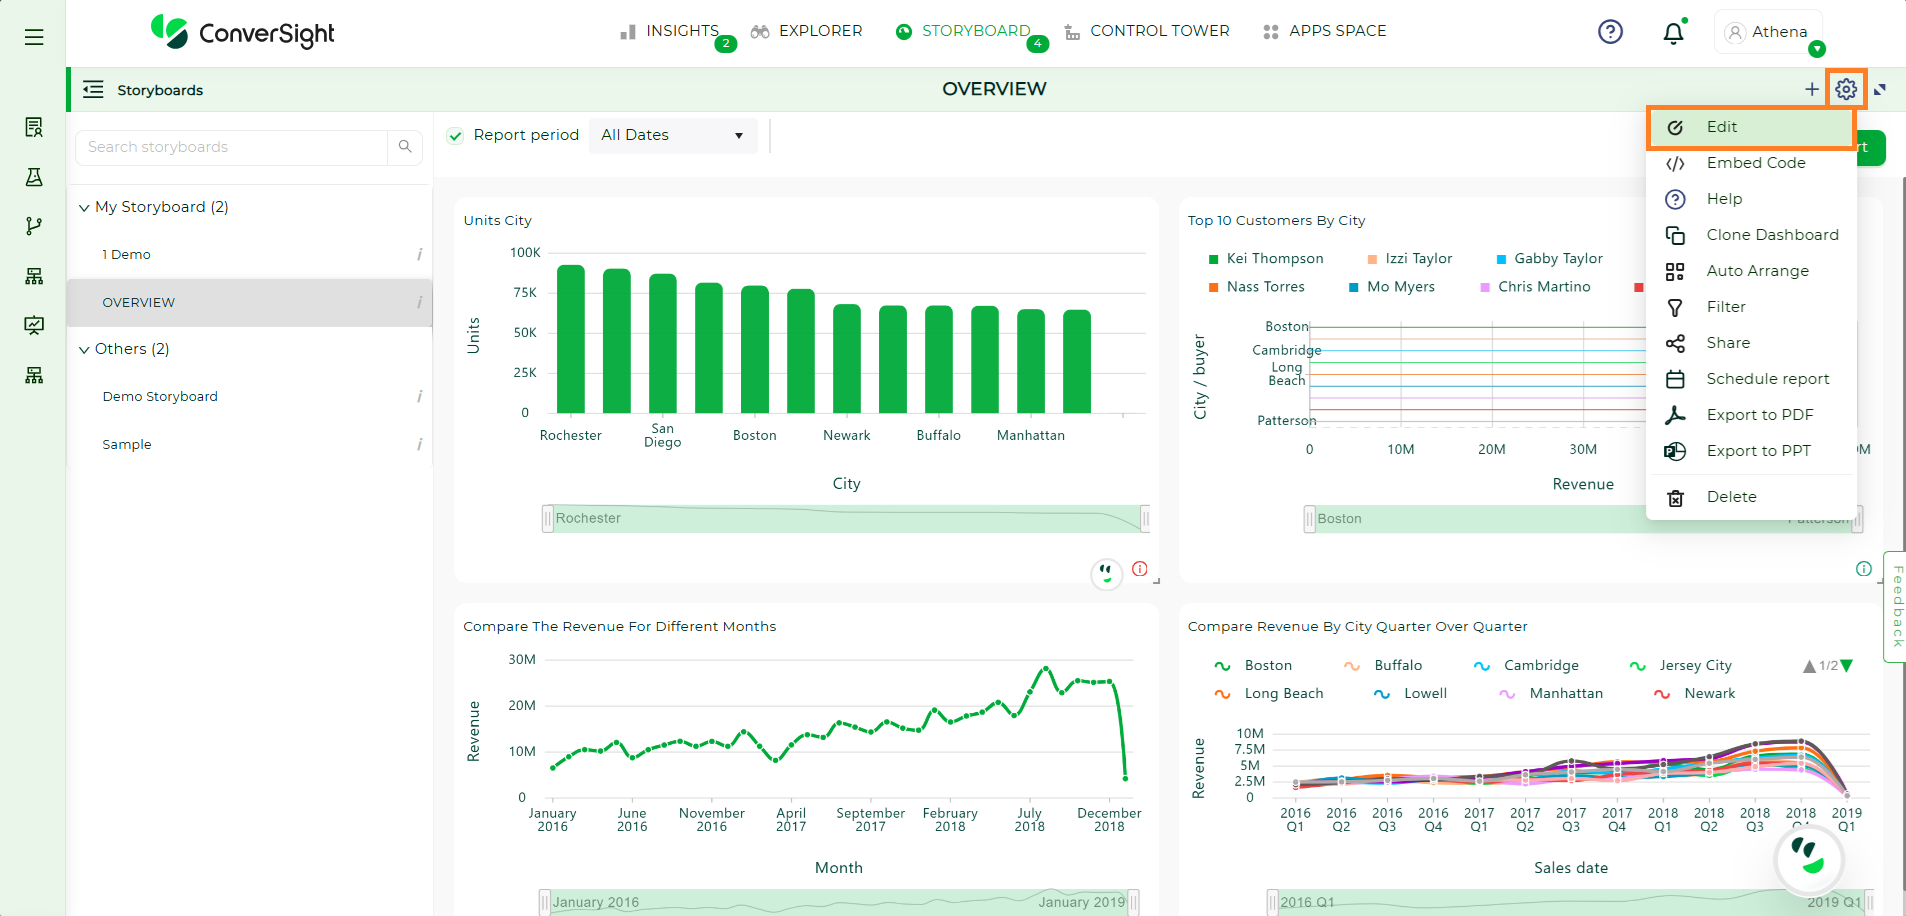
Edit a Storyboard#
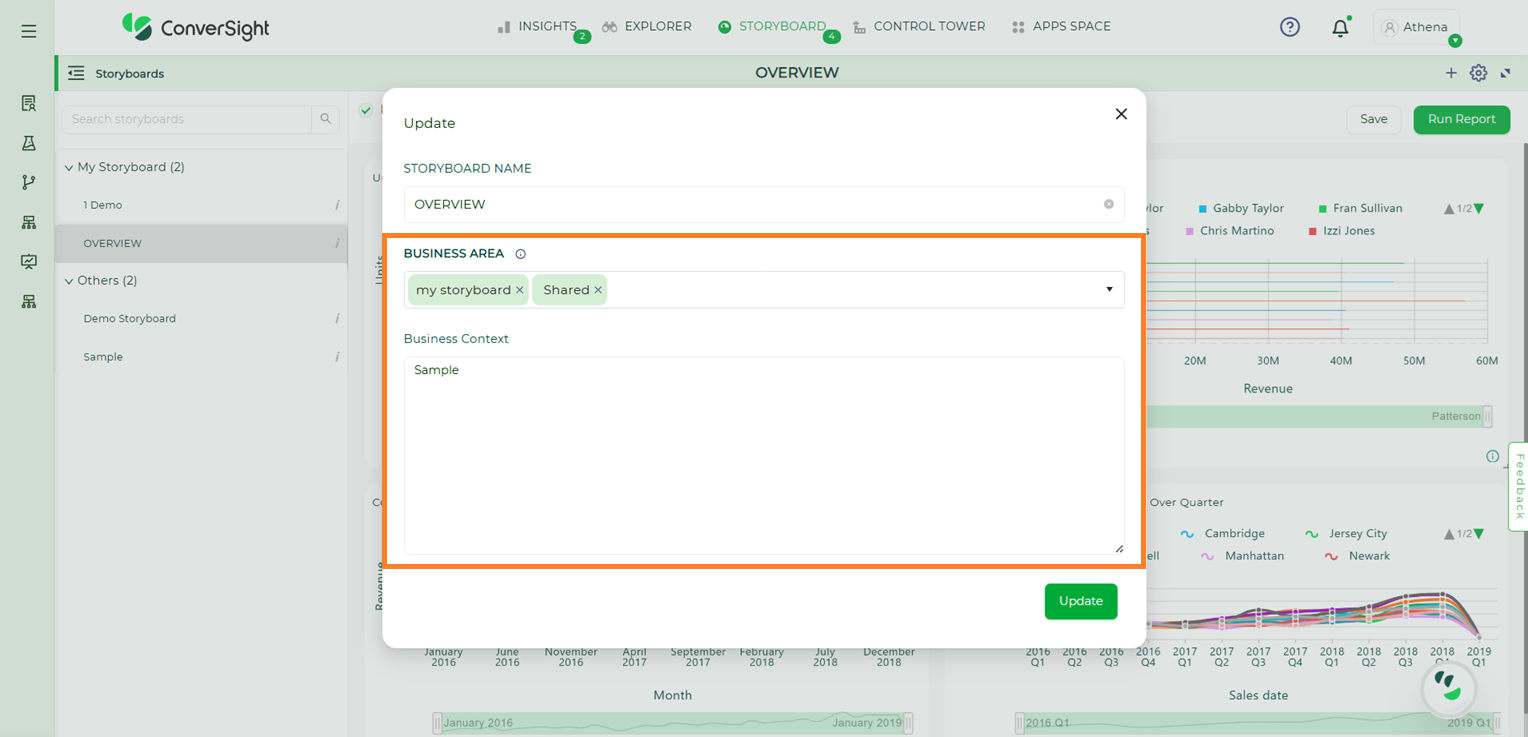
Edit a Storyboard#
This is where you can make changes to the business area.
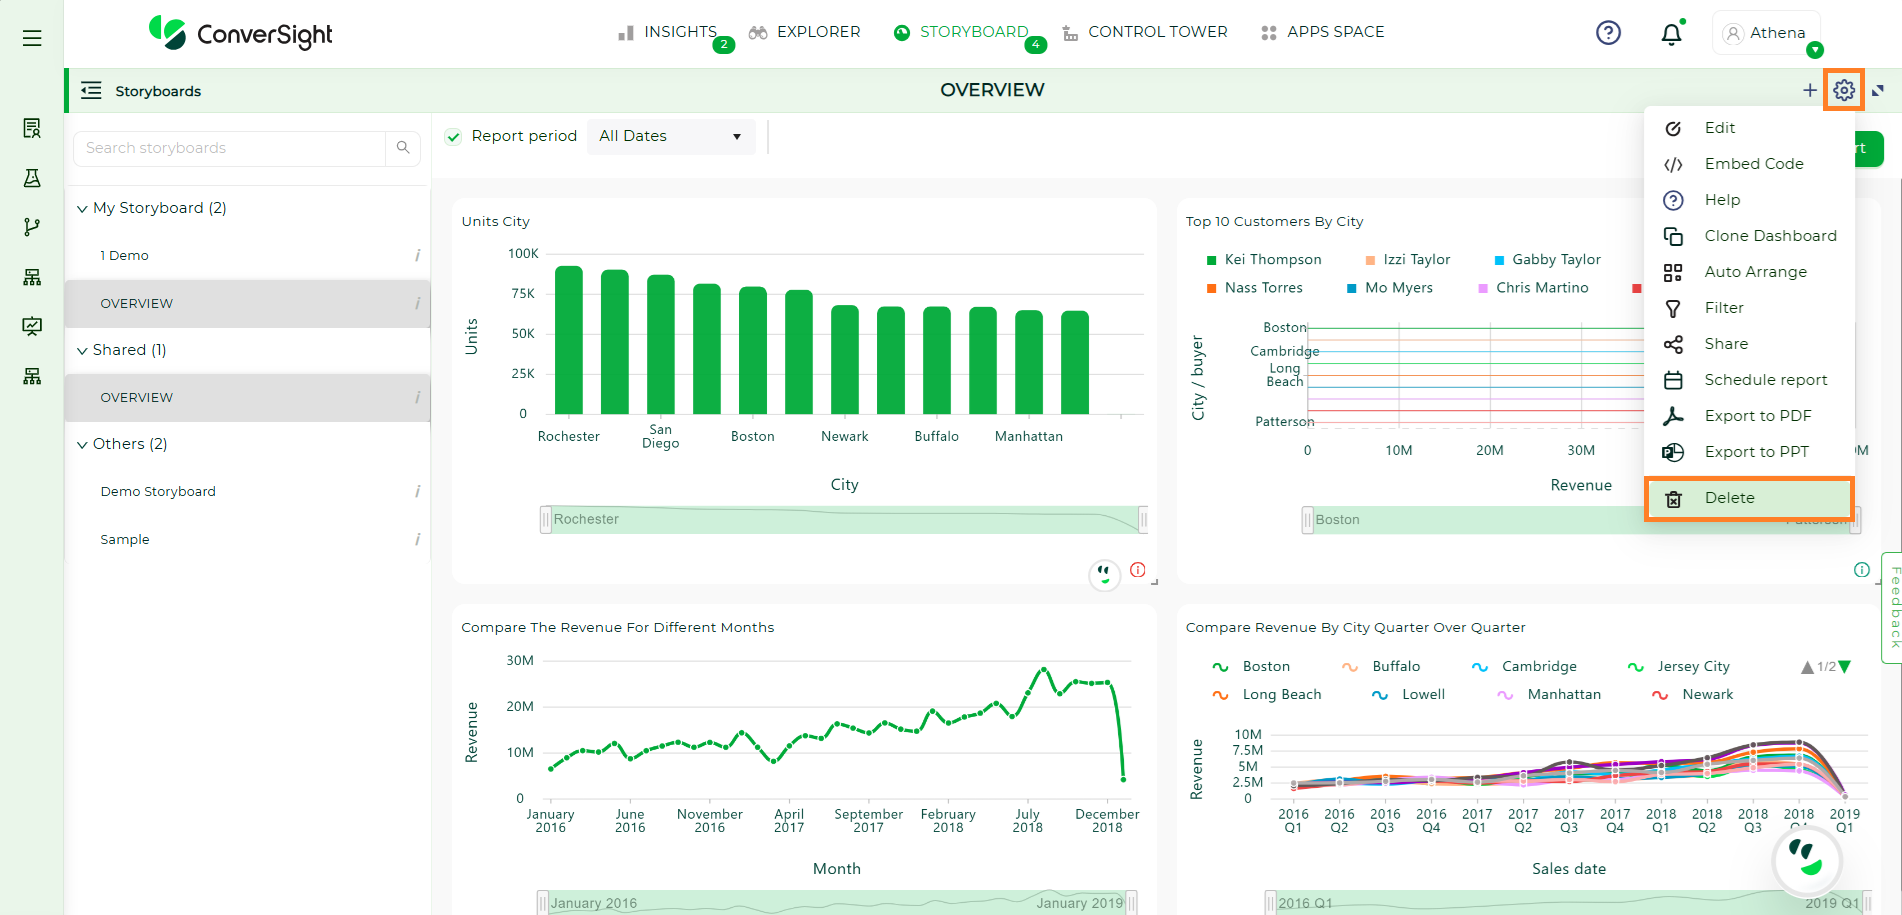
Delete a Storyboard#
Click on the Delete icon, you can delete the selected Storyboard.
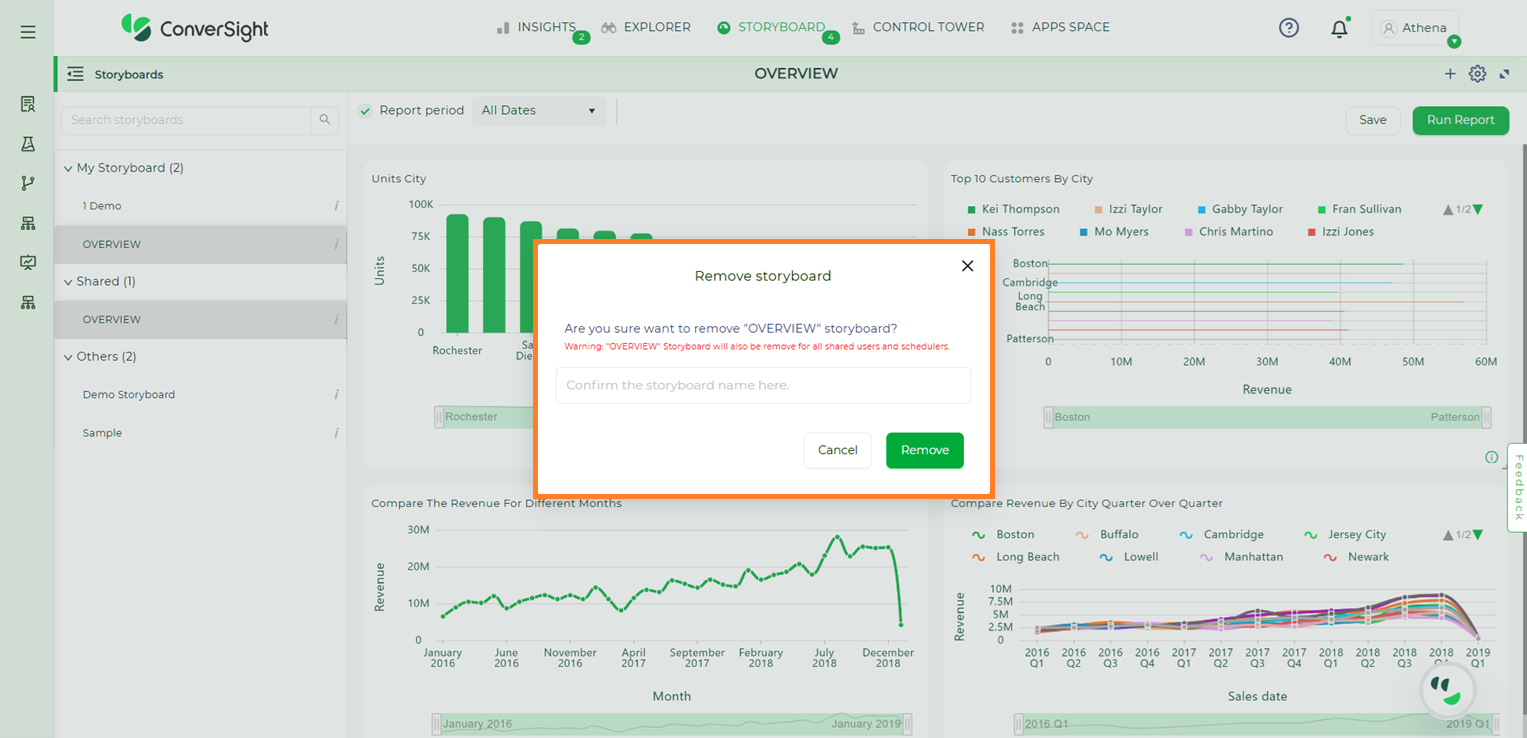
Delete a Storyboard#
When you click the Yes button, your selected Storyboard will be deleted.
Delete a Storyboard#
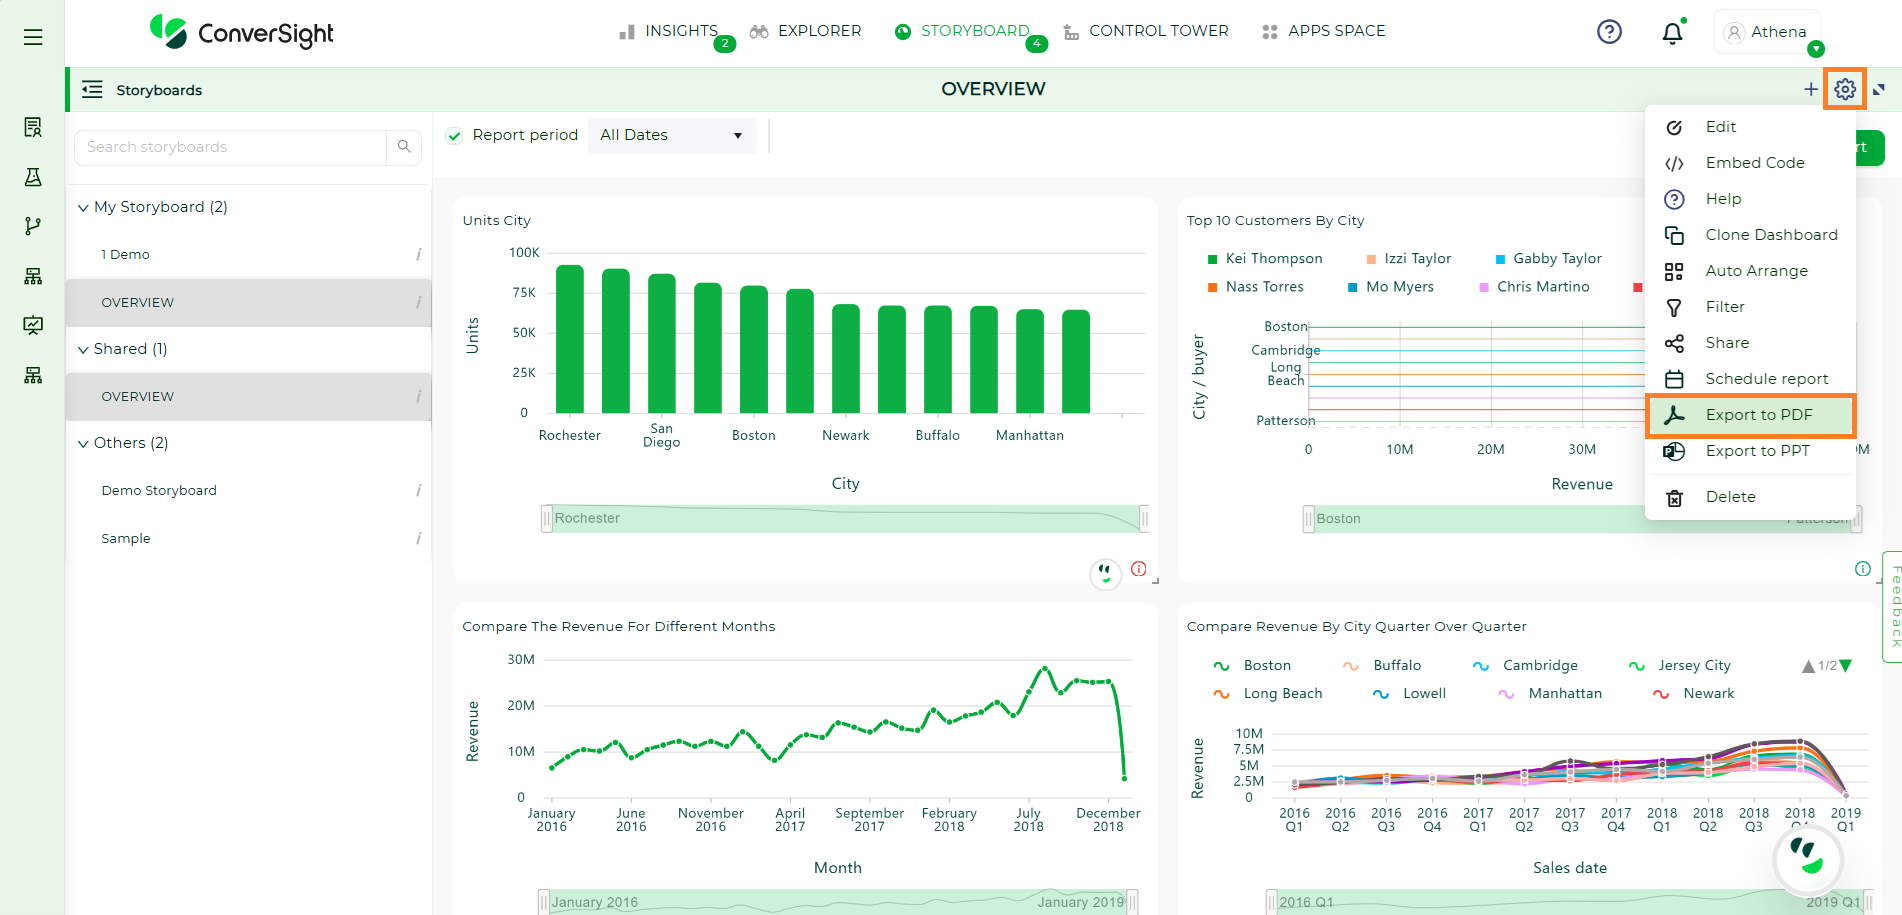
Export to PDF#
Click on Export to PDF icon  , you can download the Storyboard to the PDF file.
In ConverSight, you can download the entire Storyboard in PDF format, so you can share it with people inside and outside your organization.
Export to PDF#
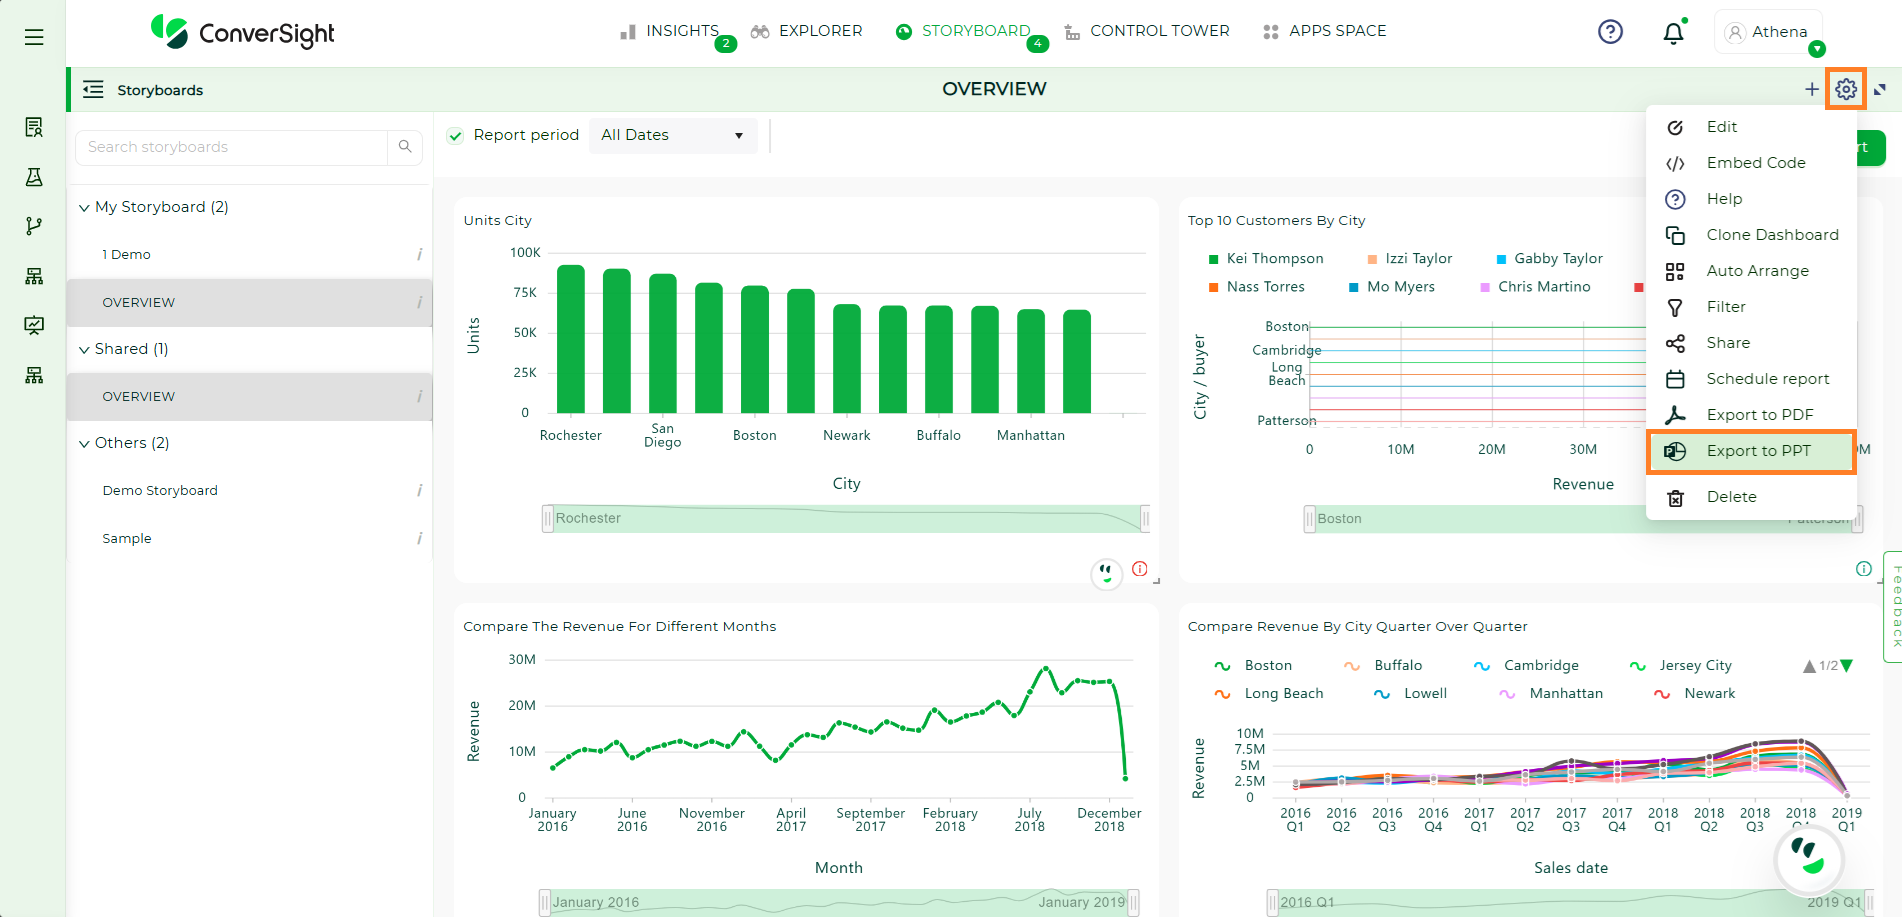
Export to PPT#
To generate a PowerPoint (PPT) version of your report, choose the specific storyboard and then click on the Export to PPT icon ![]() .
In ConverSight, you can download the entire Storyboard in PPT format, so you can share it with people inside and outside your organization.
.
In ConverSight, you can download the entire Storyboard in PPT format, so you can share it with people inside and outside your organization.
Export to PDF#
Linking a Storyboard#
The Navigate to feature in the Storyboard enables you to establish connections from your Storyboard to other elements like apps, insights, another Storyboard or even a designated URL of your choice.
Now let's look at the steps to link a Storyboard:
Step 1: Switch to the Storyboards page from the Insights page.
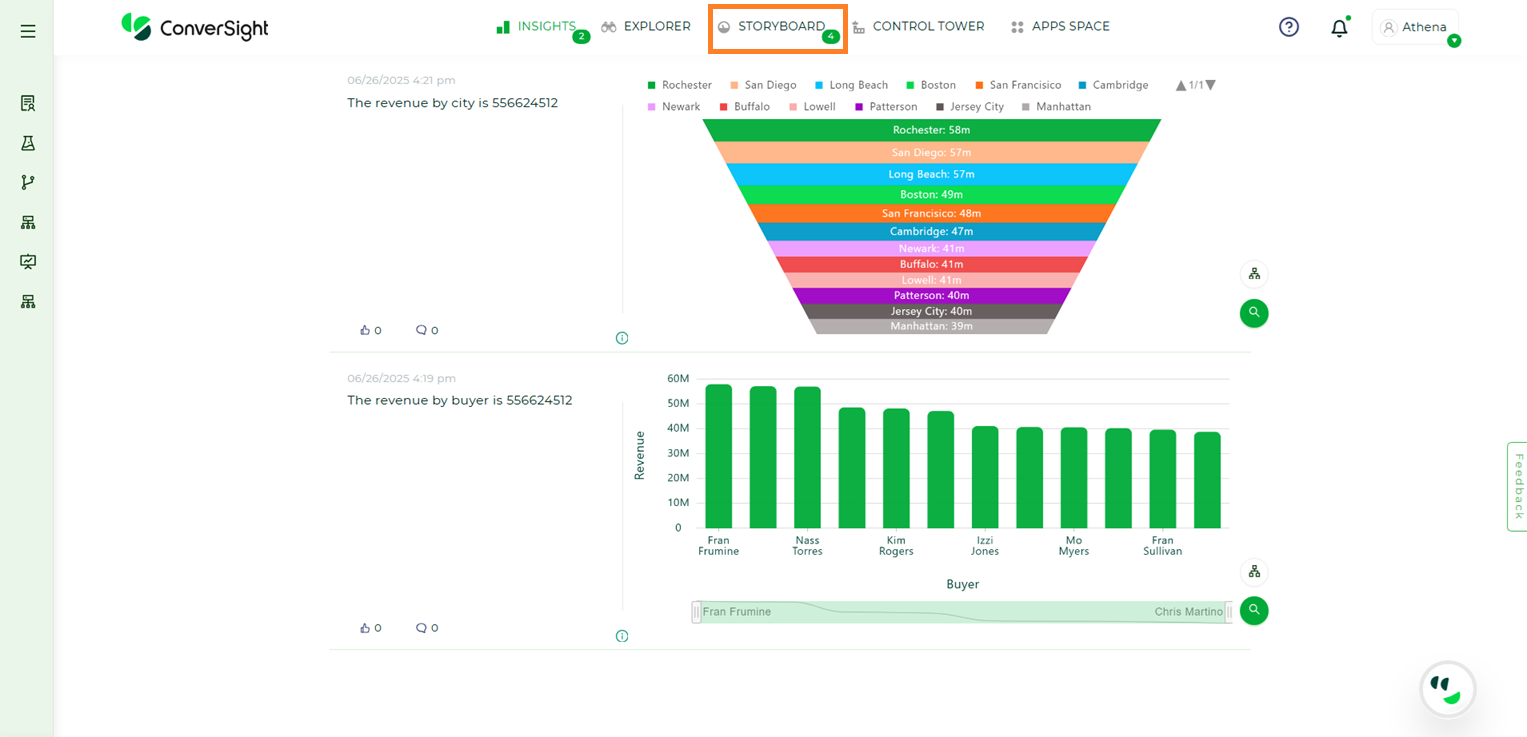
Storyboard#
Step 2: Select the preferred Storyboard to connect with other elements.
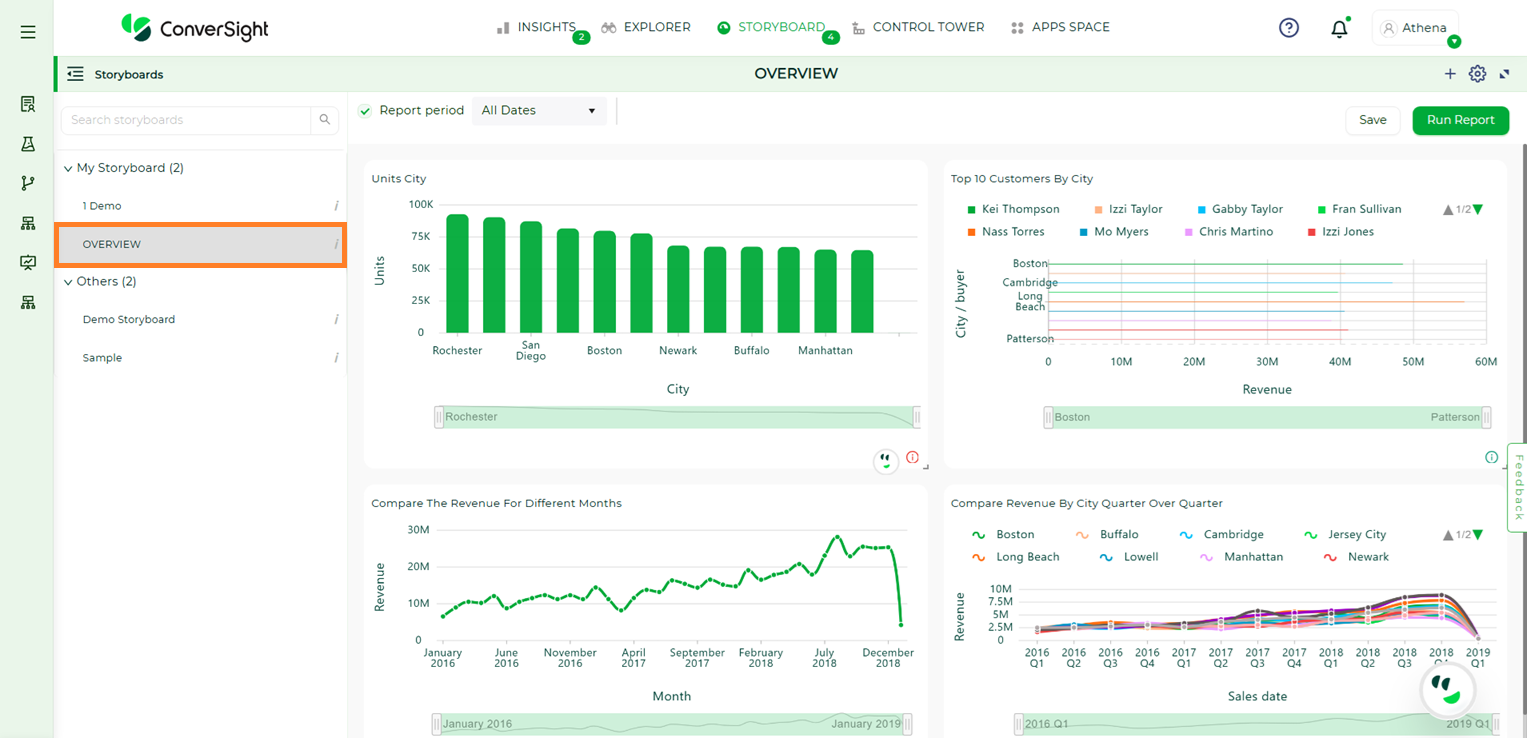
Storyboard#
Step 3: Click on the Storyboard’s title to create a connection with other elements and to edit the title of the Storyboard.
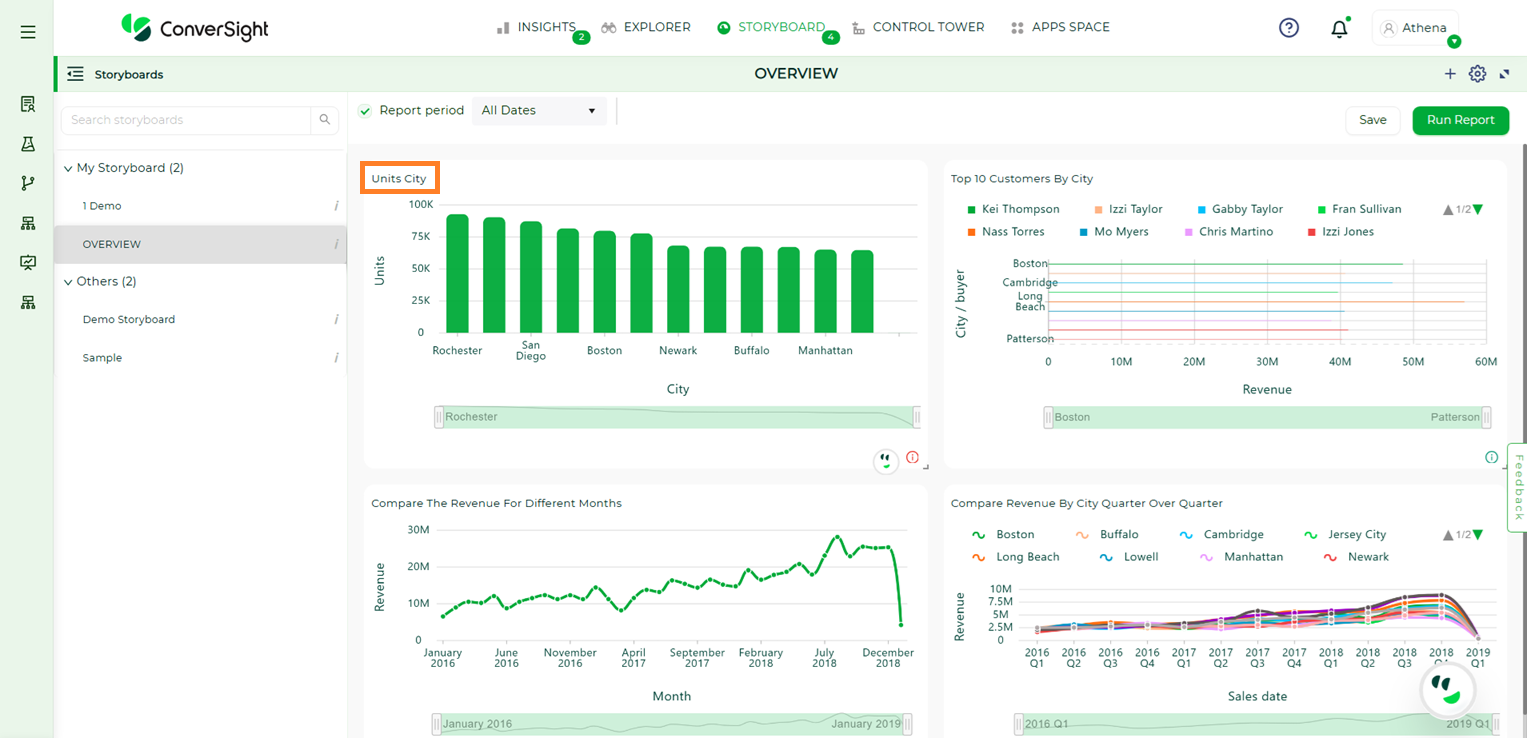
Storyboard title#
Step 4: In the Navigation to dropdown, choose your Storyboard’s redirection destination which are Apps, Insights, Storyboard or URL.
When you choose Apps, you can create a link between your Storyboard and a preferred CS App. Clicking the Storyboard’s title will then redirect you to the selected CS App.
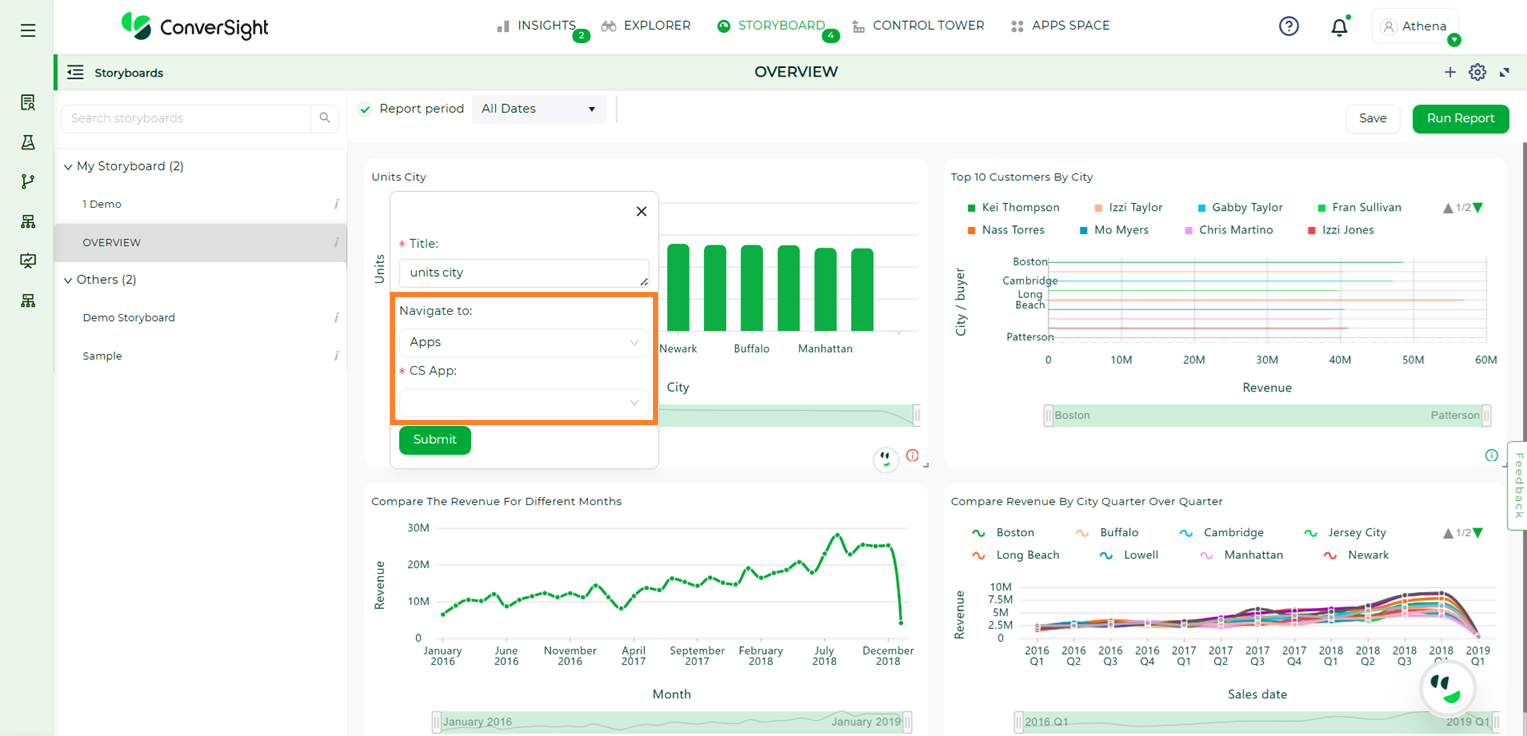
Navigate to Apps#
If you select Insights, you can establish a connection between the Storyboard and the Insights page. Clicking the Storyboard’s title will then direct you to the Insights page.
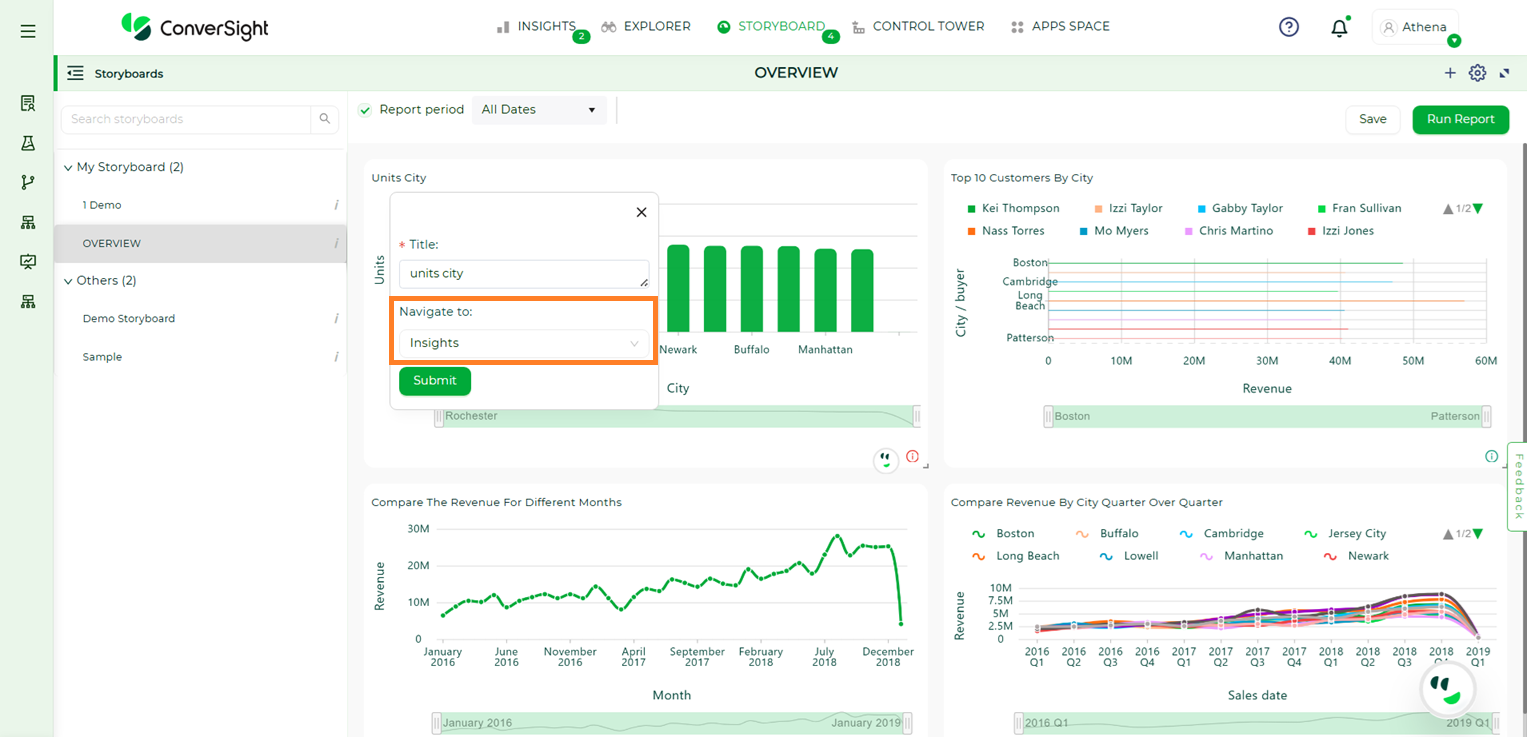
Navigate to Insights#
Opting for the Storyboard option allows you to establish a link to a pinned item within a Storyboard of your choice. When you click on the Storyboard’s title, it will lead you to the pinned Insight on the selected Storyboard’s page.
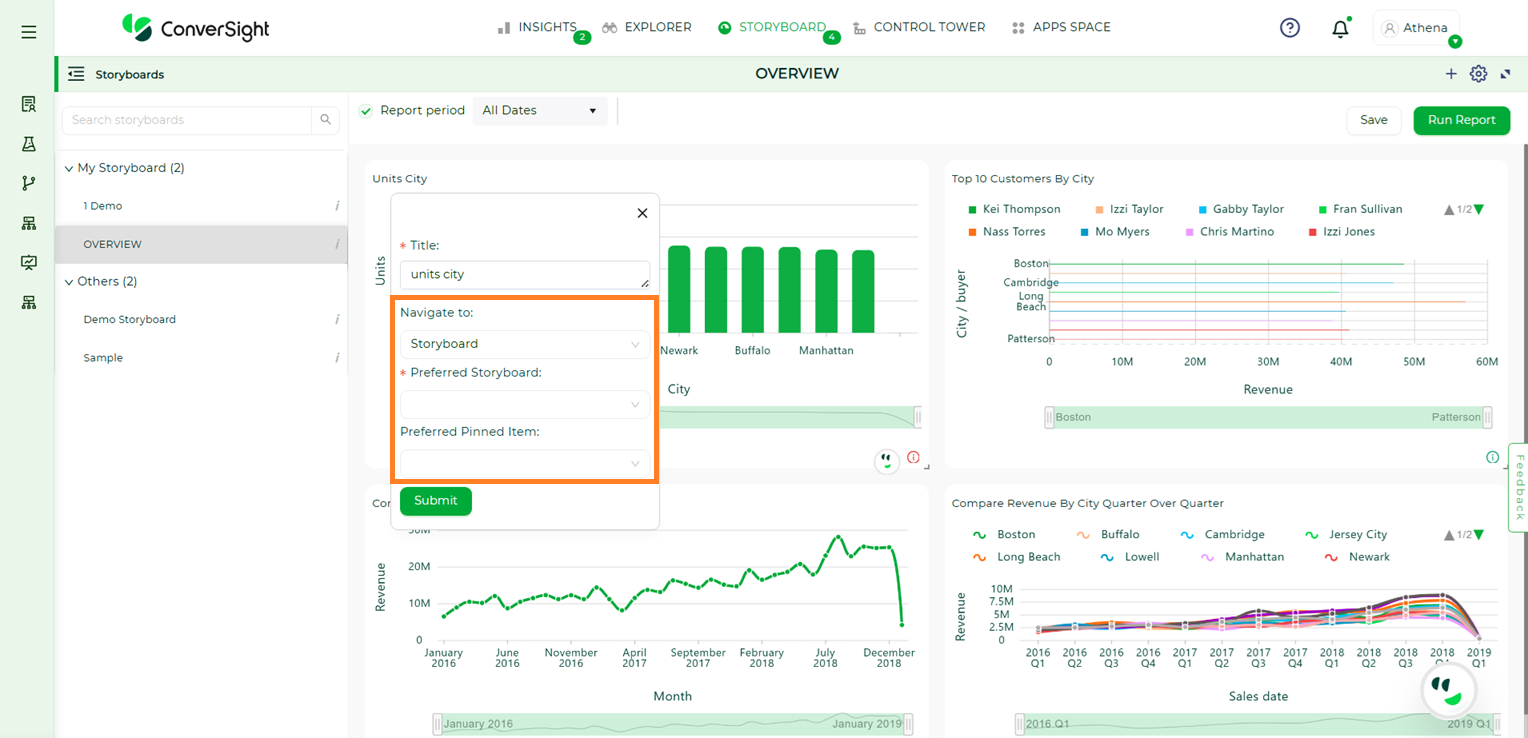
Navigate to Storyboard#
If you choose URL , you have the option to establish a link between your Storyboard and an external website by inputting the URL. Clicking on the Storyboard’s title will then take you to the specified link. If you check the Open in a new tab checkbox, the link will open in a new browser tab.

Navigate to URL#
Step 5: After making your selection for the Storyboard’s redirection destination, click the Submit button.
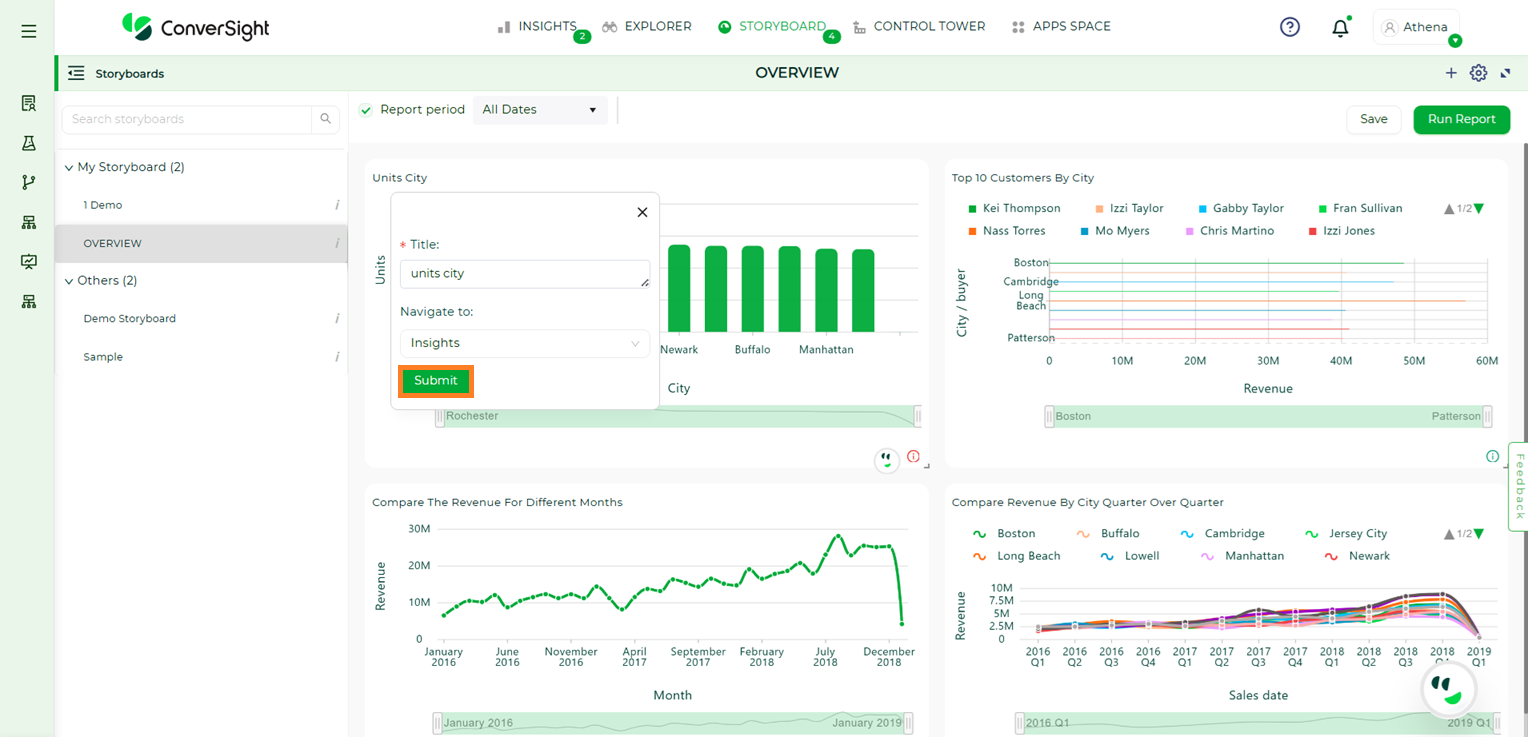
Submit#
Once the link is established, the Storyboard title will convert into a hyperlink, rendering it clickable. Upon clicking the title, the Storyboard will redirect to the selected destination. This navigation feature within Storyboards is also accessible to users within the organization with whom the storyboard has been shared.
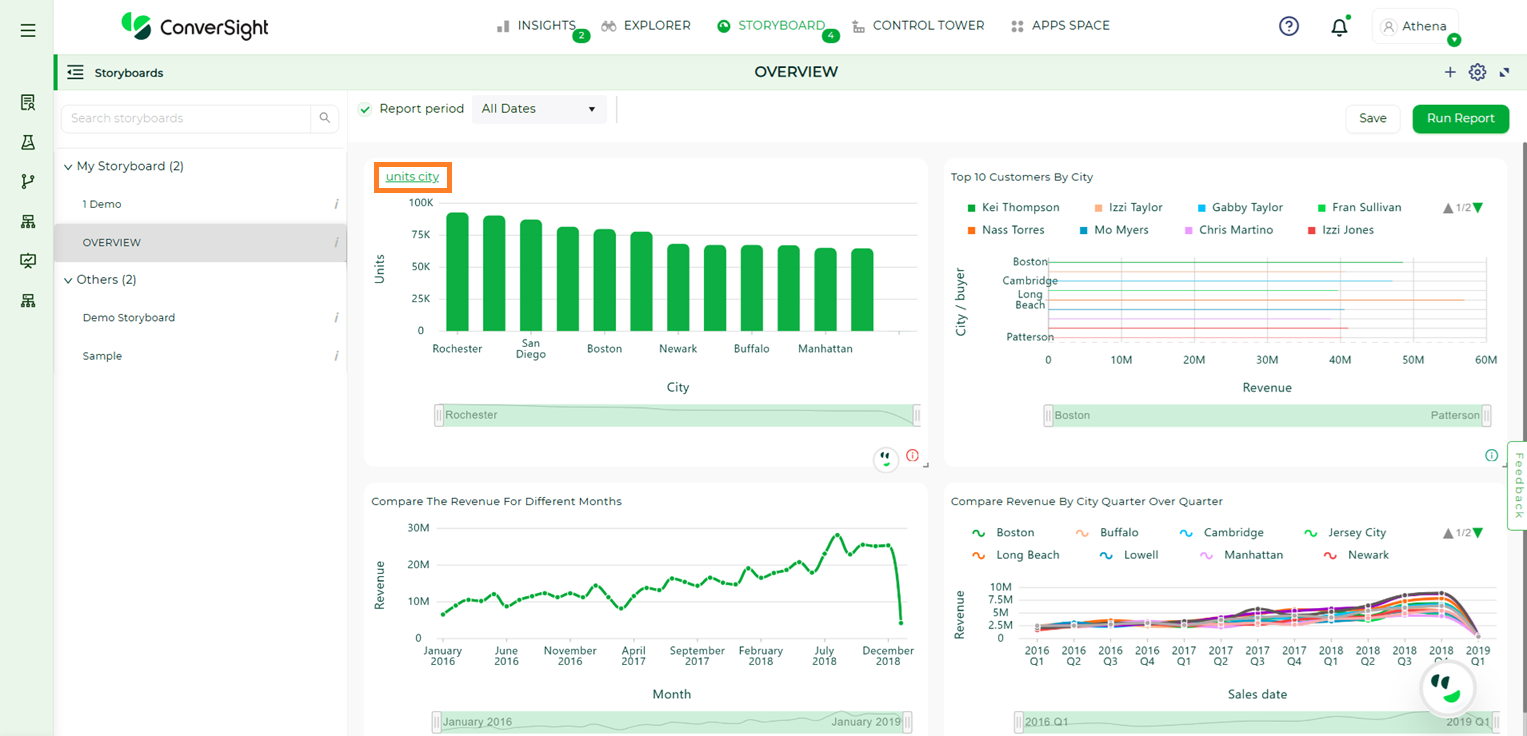
Linked Storyboard#
By clicking on  , you can either edit the Storyboard’s title or modify its redirection destination.
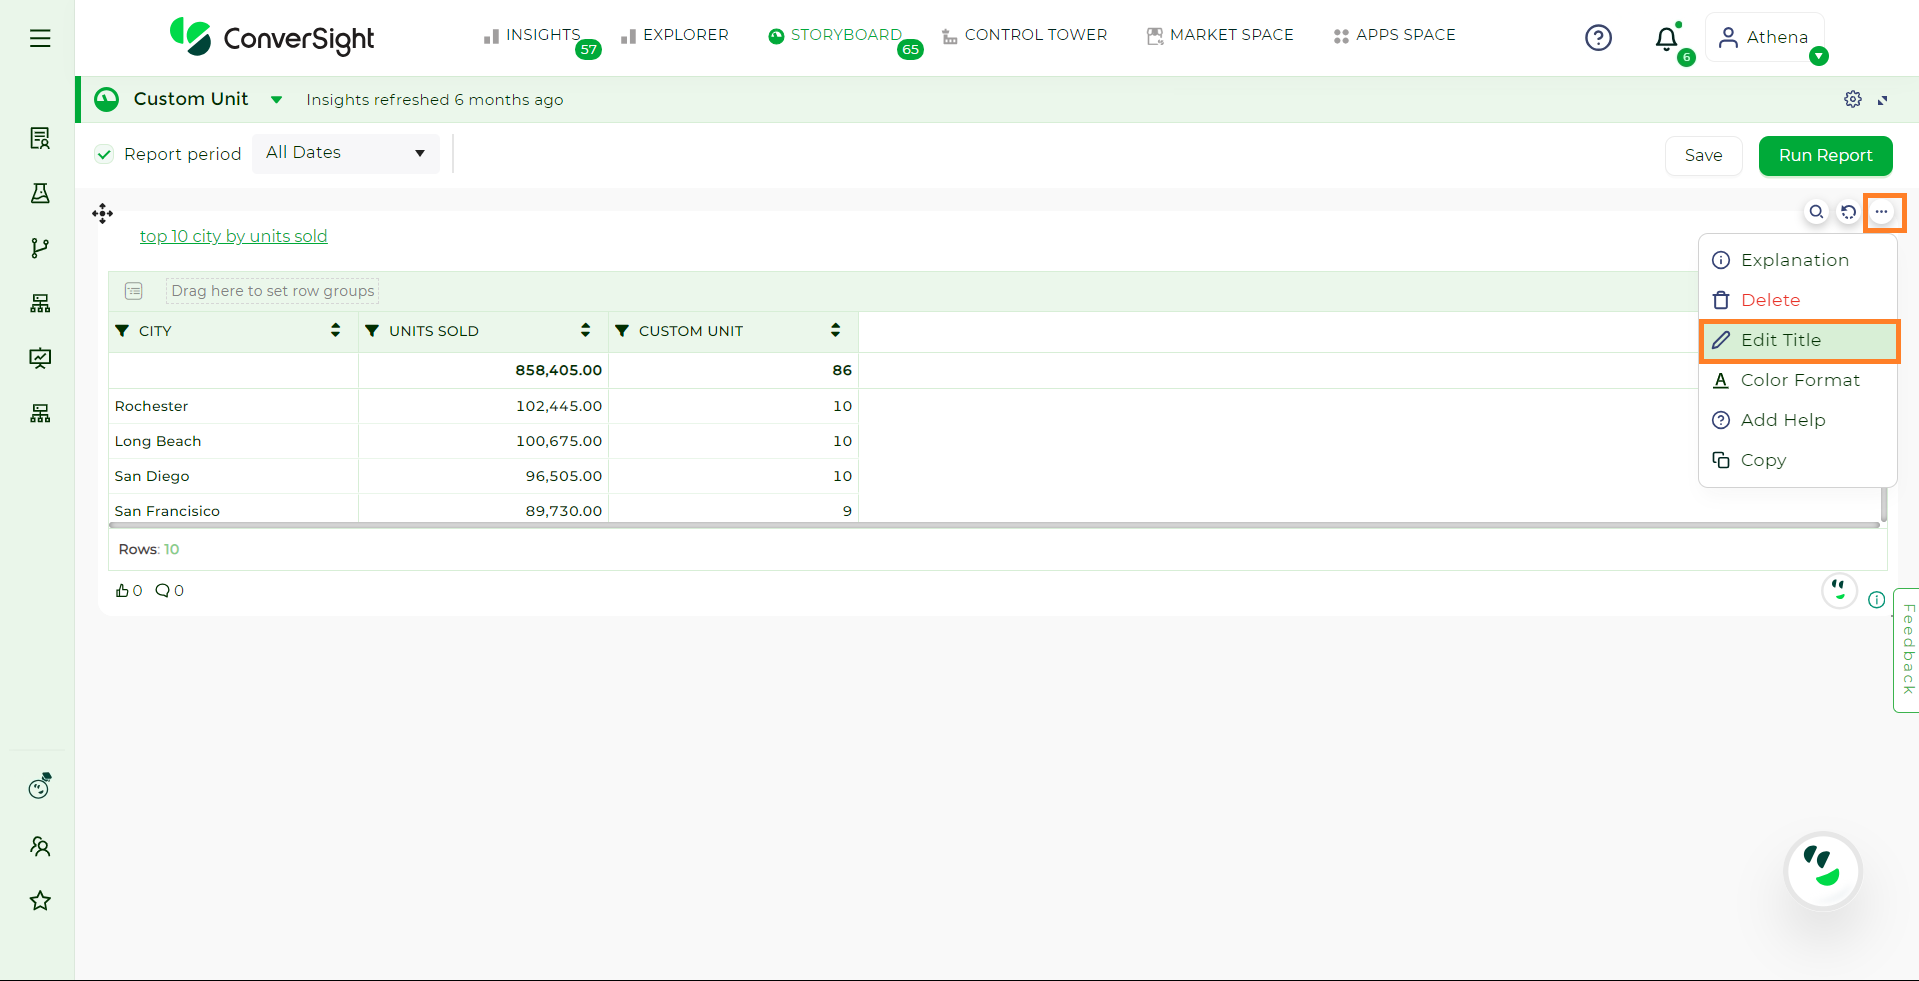
Edit Title#
Storyboard Filters#
Filters can be applied to Storyboards just as with tables and charts. These kinds of filters apply to an entire Storyboard, making it easy to see only the data that you are interested in across the tables and charts within a Storyboard.
Clicking on the Filter icon will open up a list of columns from the table. From here, you can pick the column you want to apply a filter to.
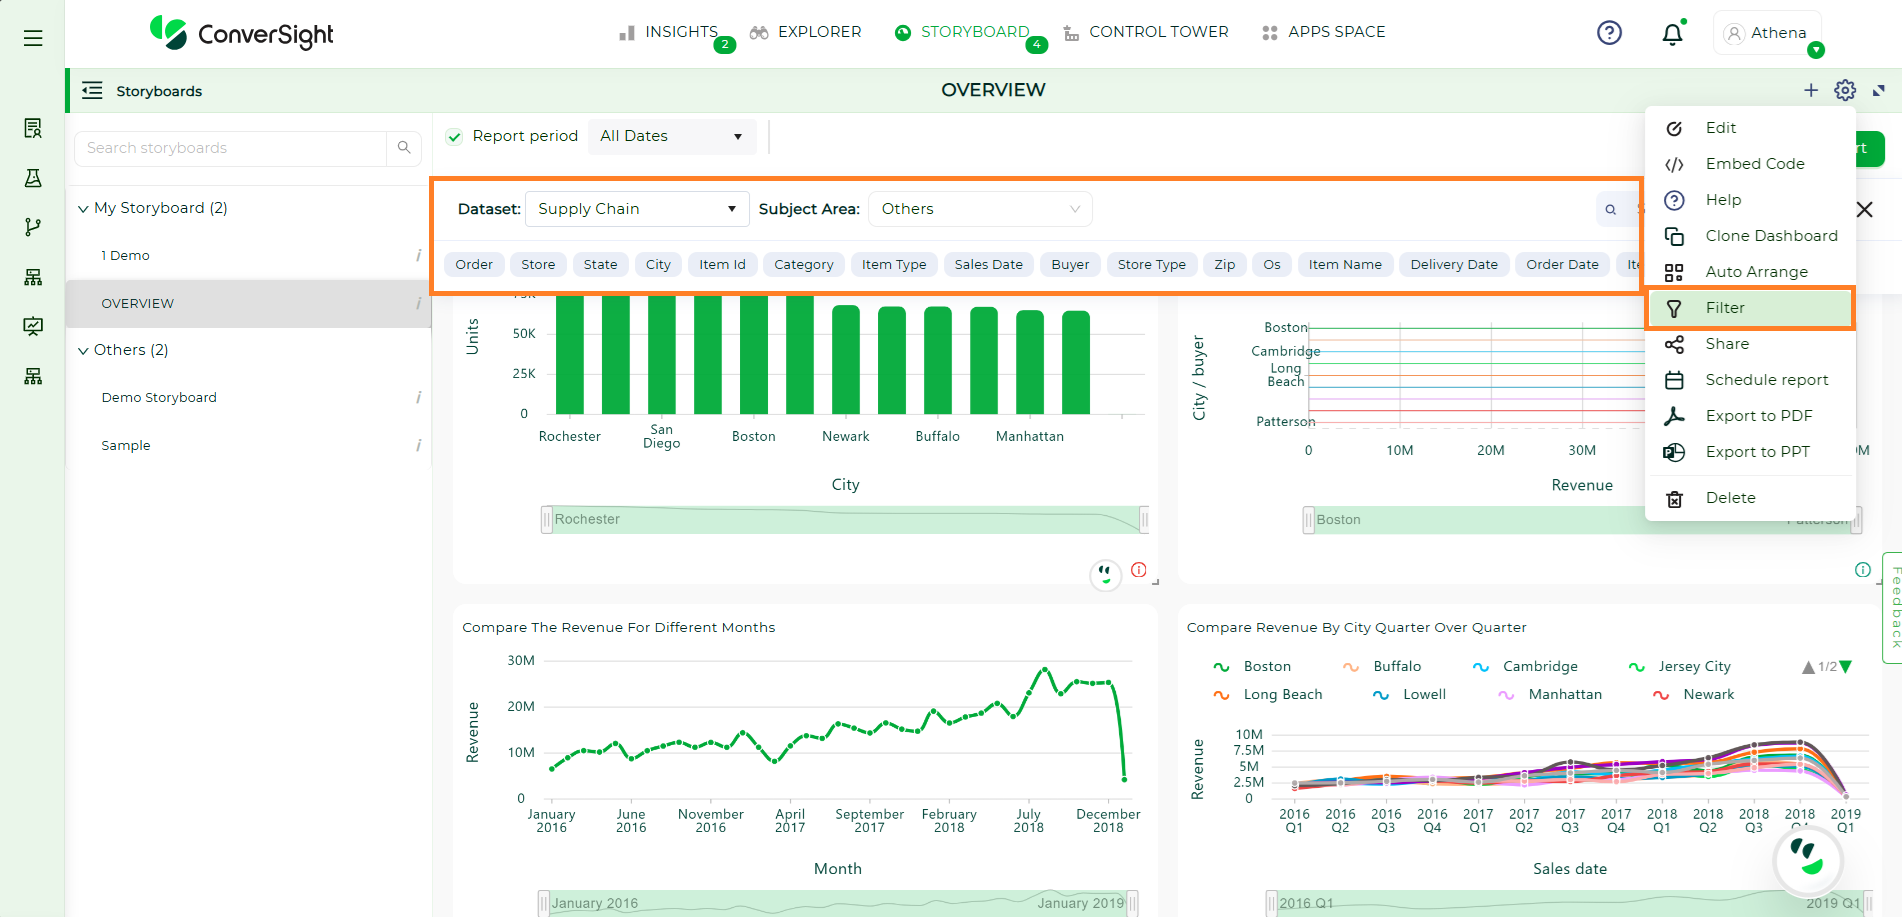
Storyboard Filters#
Hovering over the Filters will show you information about the column.
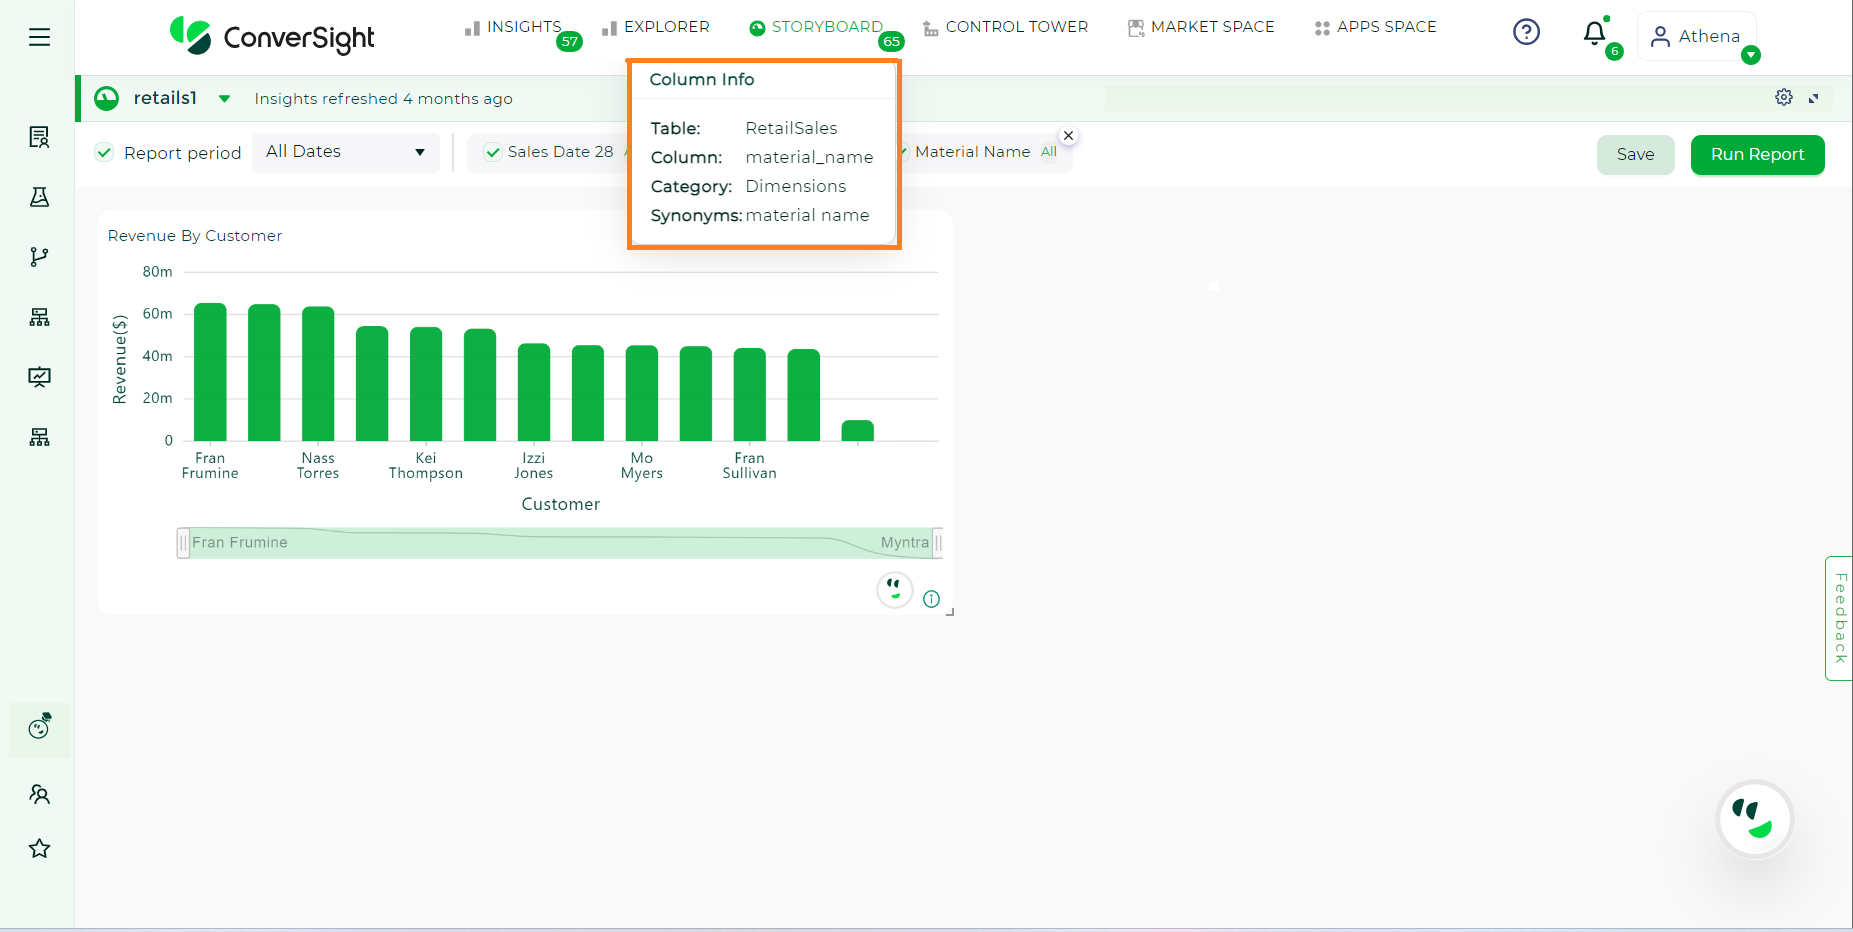
Column Details#
If the selected Filter’s column category is a dimension, you can choose an operator for the value in the column.
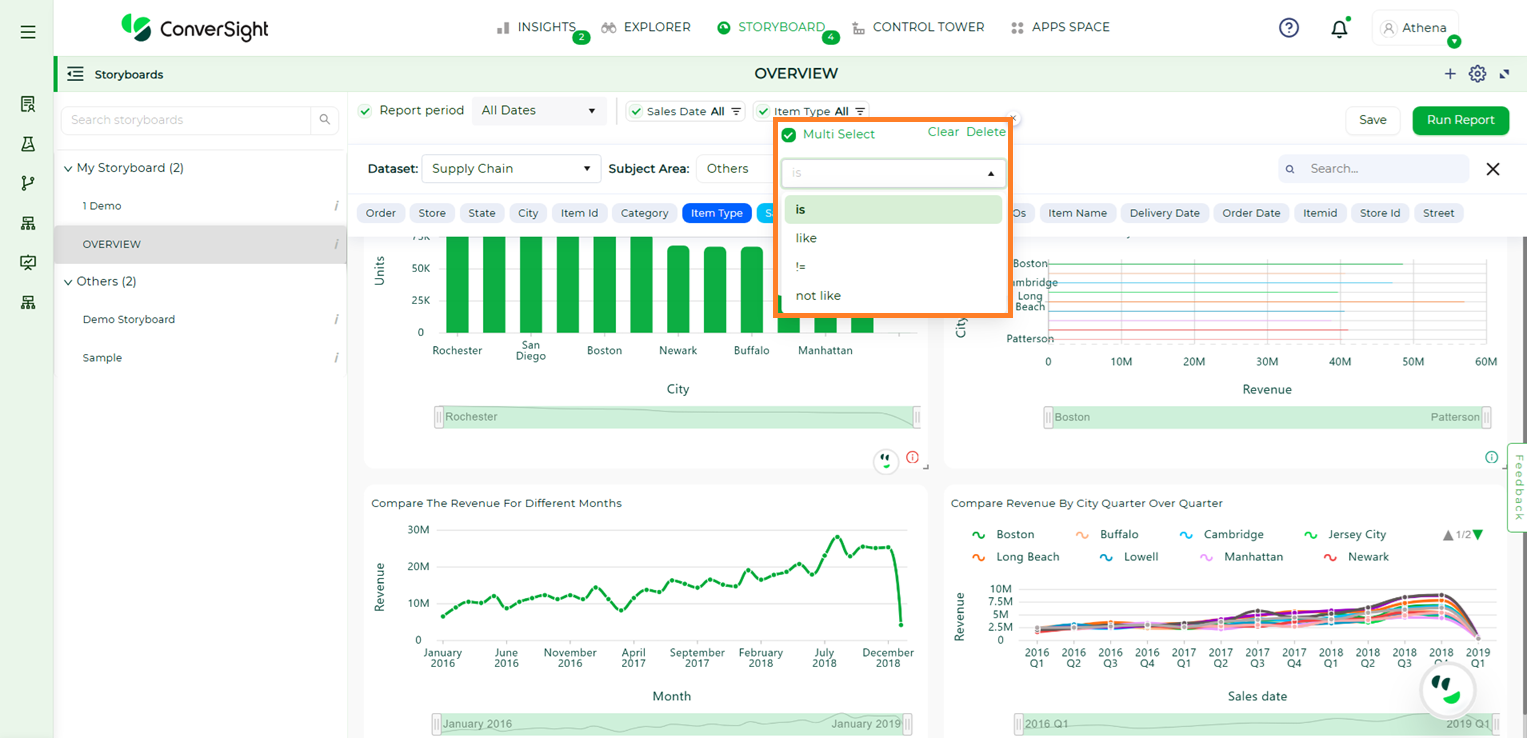
Dimension Column#
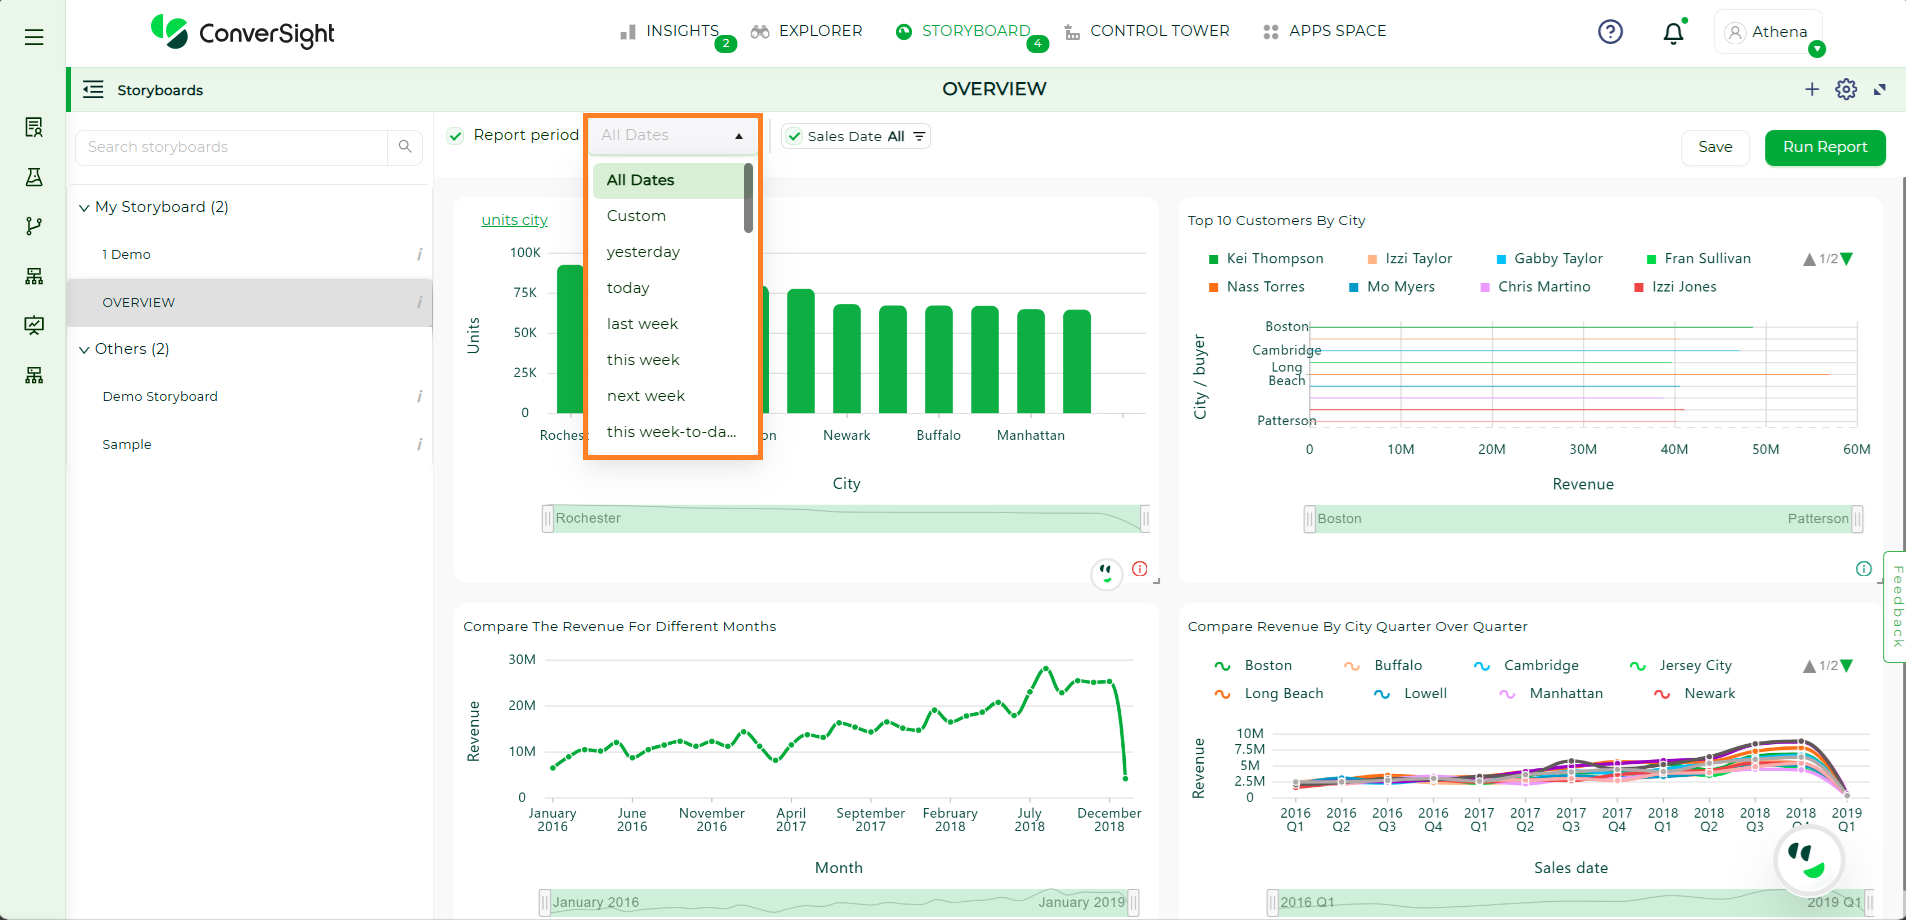
If the column falls under the date category, you have the flexibility to pick different date values.
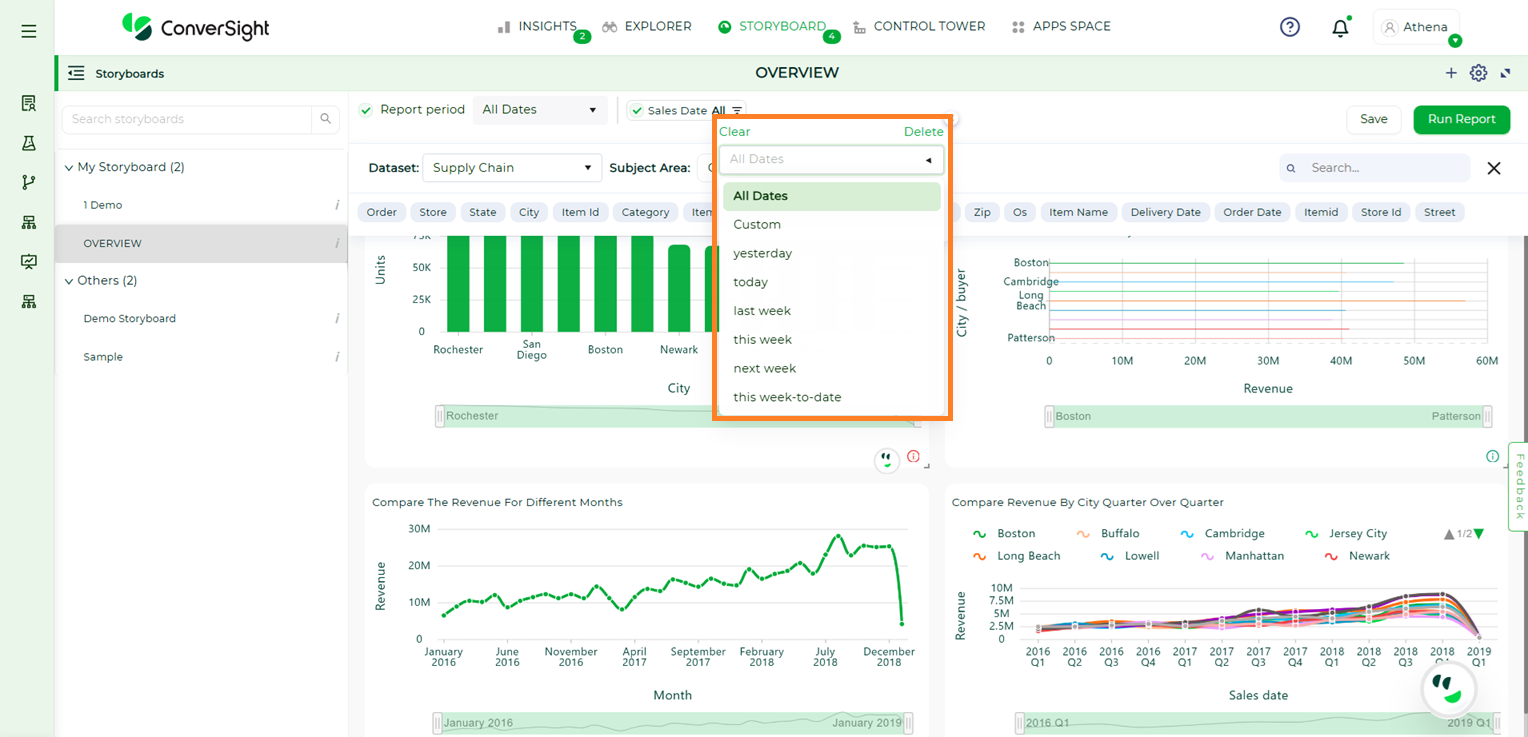
Date Column#
Once you’ve made your selections, click Run Report to generate a visualization output. If you want to keep this output for later, you can choose to Save it. Saving the visualization makes it permanently available for reference and use whenever you need it.
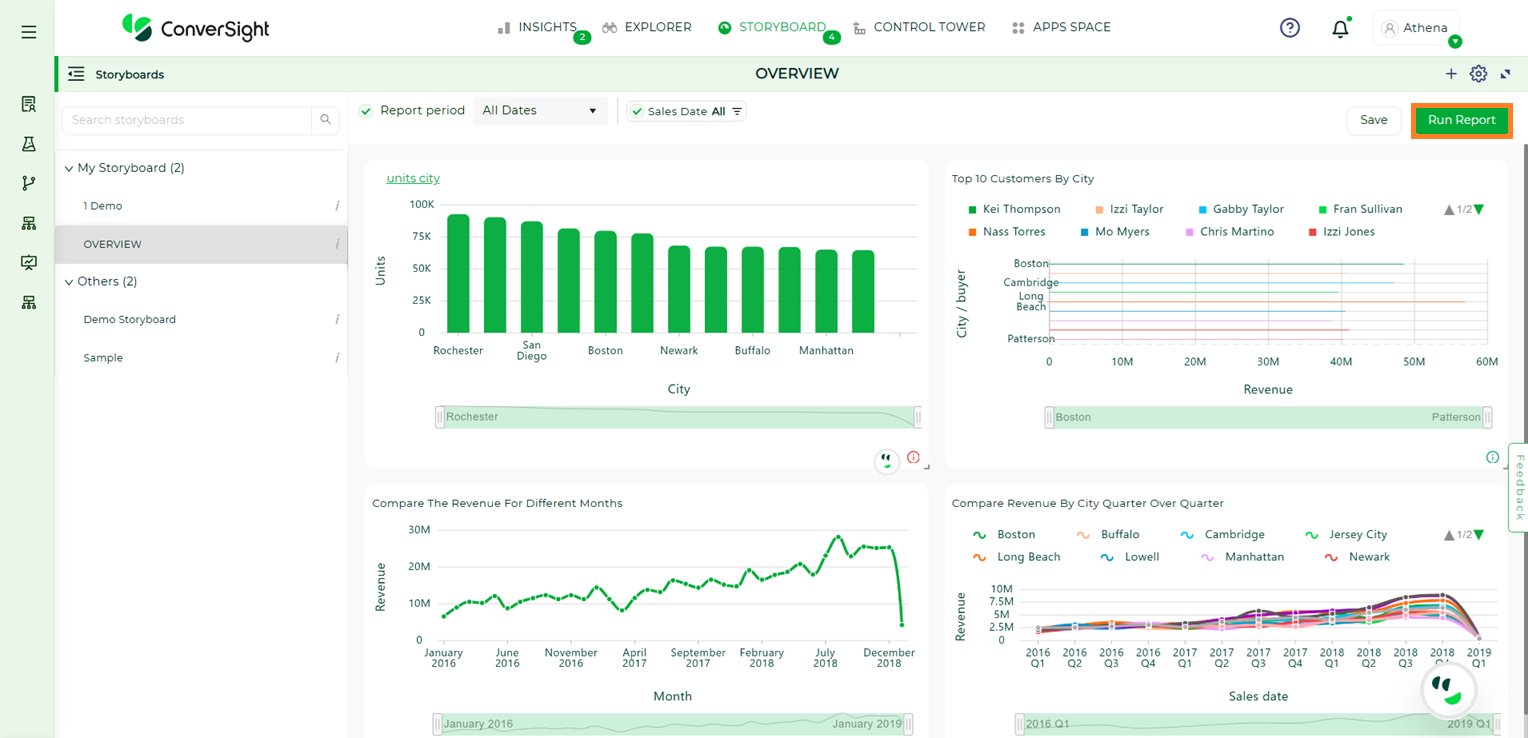
Run Report#
The Report period feature is a handy way to filter data based on specific dates.
Report period#
NOTE
If the category of the column is metric or calculated metric, the Storyboard filters will not be applicable.
In conclusion, a Storyboard is your personalized canvas for data visualization and organization. It empowers you to effortlessly compile, access and showcase your charts, graphs and insights in a single, cohesive space. In a world inundated with data, Storyboards offer clarity and convenience, ensuring that your most critical insights are always at your fingertips, ready to inform and guide your decisions.
To watch the video, click on Storyboard Customization