September 2025#
New Features#
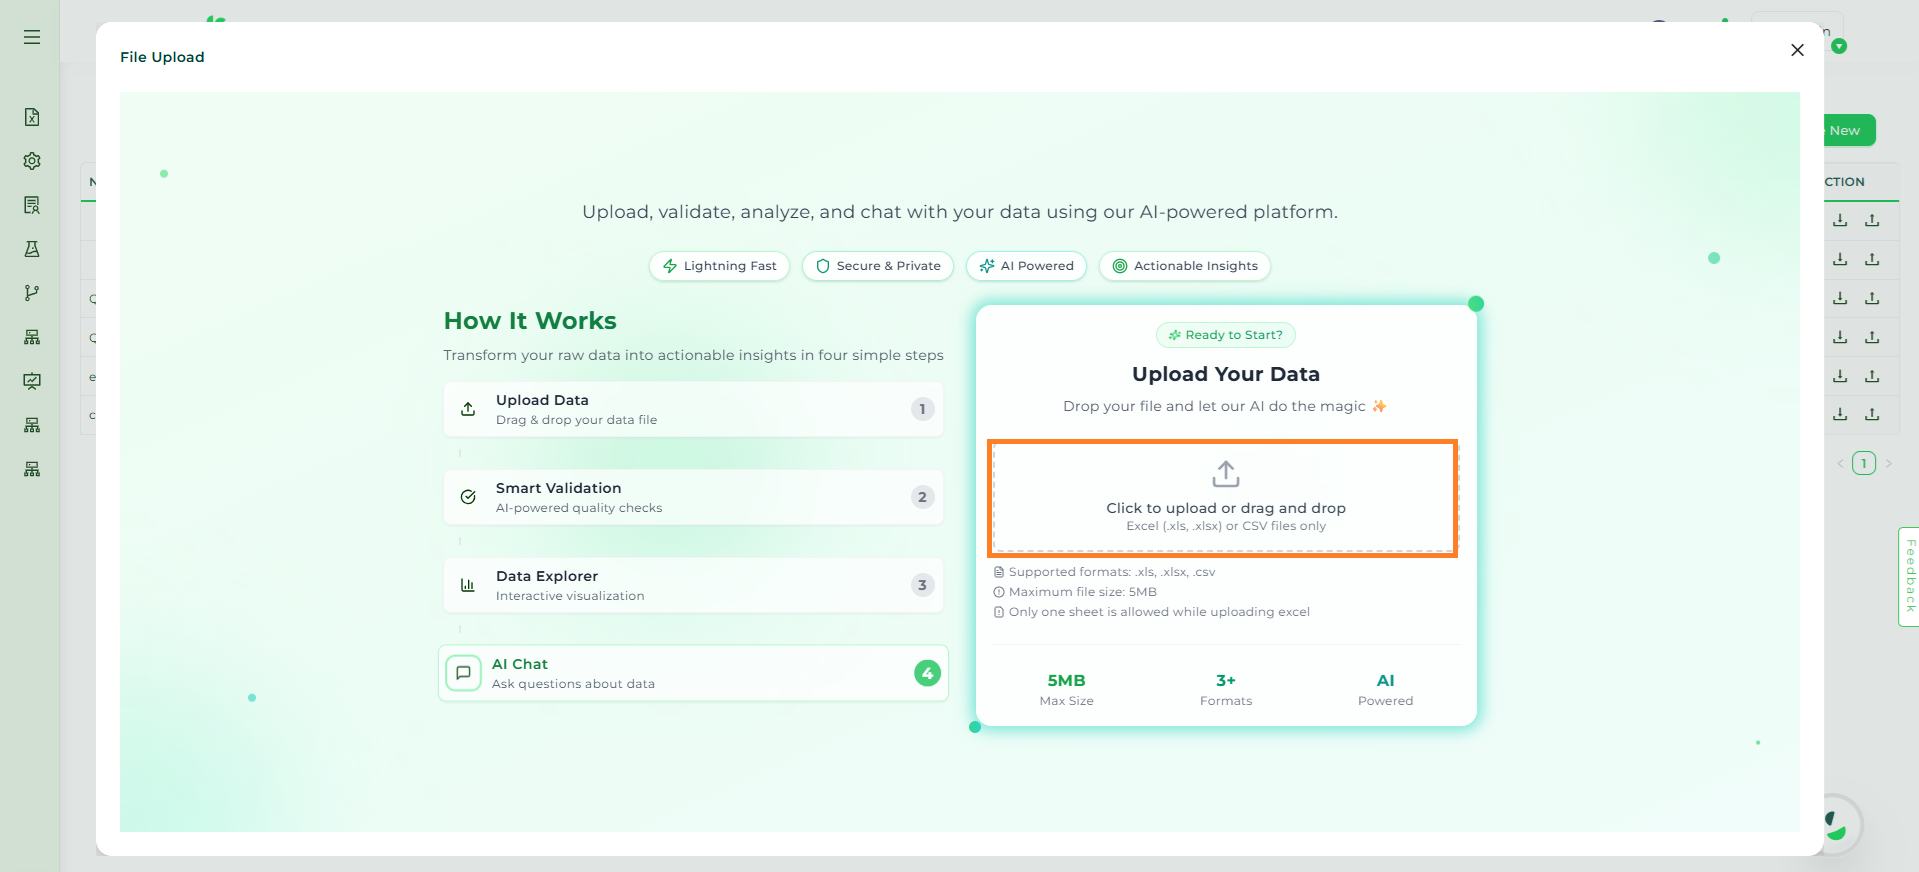
Quick Insights: Introduced Quick Insights, enabling users to seamlessly add their Excel file into the platform with fewer steps, reducing manual effort and accelerating access to insights.
Storyboard
Storyboard to Explorer for V2 Datasets: Enabled the ability to open Storyboard components directly in Explorer for V2 datasets, providing full access to dataset columns and settings for easier edits and faster updates.
Edit a Storyboard Component#
Tab Widget for Storyboard Pins: Introduced tab widget support for storyboard pin components, allowing multiple components to be grouped within tabs for a cleaner layout and consistent filter application.
Demand Forecast
Multi-Model Forecast: Introduced support for multiple forecasting models, enabling users to compare outputs and select the most accurate model for their business needs.
Filter Cards in Forecast: Enabled filter cards within Forecast, allowing users to refine and adjust forecast views dynamically for more targeted insights.
Forecast Score: Introduced forecast scoring, providing a performance score for each forecast to help evaluate accuracy and reliability.
Enhancements#
Storyboard
Timestamps in Card View: Introduced timestamps in Card View, providing clear visibility into when data was last refreshed.
Dimension Count in Text View: Enabled dimension counts in Text View, delivering a simplified format for improved readability.
Decimal Precision in Card View: Enhanced Card View to display decimal values with precision, ensuring accurate and consistent representation of numeric data.
MarketSpace
User Flow Integration: Added a guided user flow within MarketSpace to simplify navigation and enhance overall usability.
Bug Fixes#
Athena Chat & Explorer
Fixed an issue where field names ending with underscores caused errors.
Resolved a defect where the LIKE operator required explicit “%” usage; it now functions as expected.
Fixed a bug where calculated fields were ignored in Smart Column.
Corrected an issue where queries using LIKE removed leading zeros, preserving values such as ZIP codes.
Corrected misalignment of calculated metrics for consistent display.
Explorer’s special query tab configuration now correctly retains popup trigger changes.
Insights
Corrected the time format in the Insights timeline to display dates as YYYY-MM-DD instead of DD-MM-YYYY.
Adjusted pie chart font sizing for improved readability.
Storyboard
Fixed the “No Row to Show” issue in CsTables.
Adjusted side panel widths for smoother navigation and consistent layouts.
Resolved an issue where dataset access was not applied correctly for certain users.